 Print
PrintThe following post comes to us from John Pollack and David Rosewater, partners focusing mergers & acquisitions at Schulte Roth & Zabel LLP. This post is based on the Schulte Roth & Zabel PE Buyer/Public Target M&A Deal Study: 2012 Mid-Year Update, which is available here. Posts about previous versions of the study are available here, here, and here.
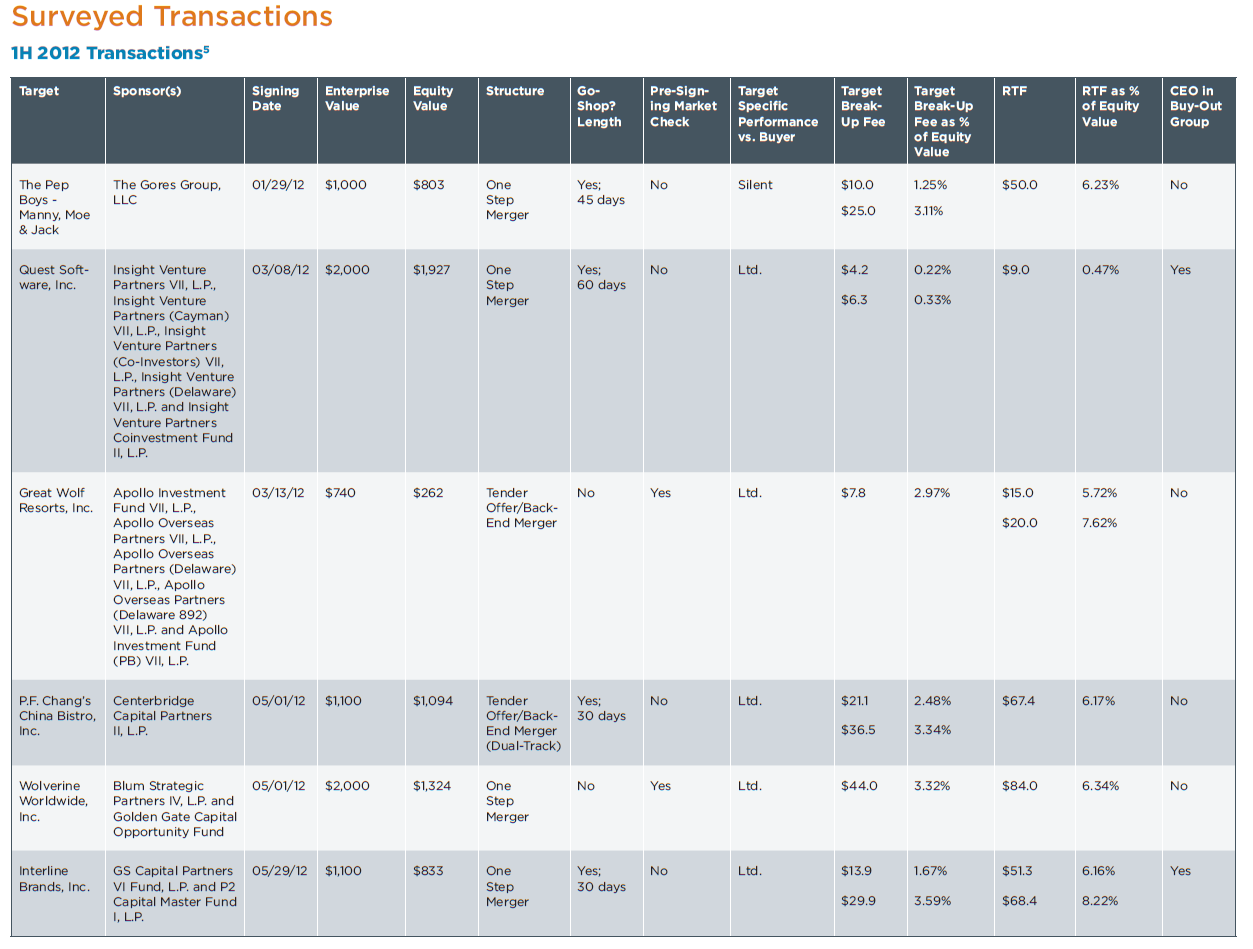
The large private equity buyer/public company segment of the U.S. M&A market (all cash deals over $500 million) was significantly affected in the first half of 2012 by troubles in the U.S., European and global economies. Only six transactions within our deal parameters were executed. Five of them had key deal terms generally consistent with our prior observations; the remaining transaction, Insight Venture Partners/Quest Software, had certain key deal terms (“go-shop” period, target break-up fee and buyer reverse termination fee) that were outliers. Accordingly, for certain of our observations below, we have expressed the data including and excluding Insight Venture Partners/Quest Software (“Quest Software”). [1]
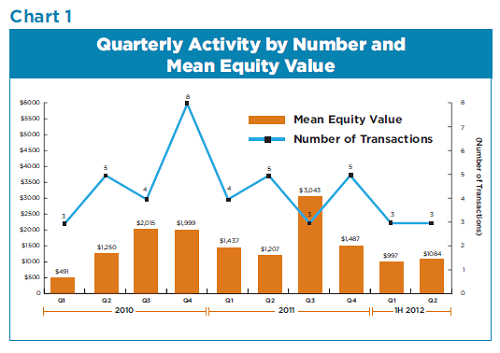
1. Fewer deals were completed in 1H 2012 and average deal size decreased. The decline in deal activity that began in Q1 2011 continued in 1H 2012. In 1H 2012, deal activity was down 33% compared to 1H 2011, and down 25% compared to 2H 2011. On an annualized basis, deal activity in the segment surveyed decreased 29% in 2012 compared to 2011. Equity values were also lower. For 1H 2012, in the deals within our survey, mean equity value fell 21% when compared to 1H 2011 and 54% when compared to 2H 2011. (See Chart 1 below.)
2. Deals took longer to get signed up. The protracted sale process we previously observed has become more pronounced. For 1H 2012, for the deals we surveyed, the mean time from the start of the target’s process to signing a definitive agreement was 11.5 months, compared to 9.3 months for 2011, an increase of 24%. Similarly, for the 1H 2012 deals we surveyed, the mean time from the buyer signing a confidentiality agreement with the target to signing a definitive agreement was 5.2 months, compared to 4.1 months for 2011, an increase of 27%.
3. The use of the two-step tender offer/back-end merger structure continues to grow. The two-step tender offer/back-end merger structure was used in 33% of the 1H 2012 deals we surveyed compared to 18% in 2011. The dual-track or “Burger King” structure was used in approximately 50% of the 1H 2012 deals we surveyed, which was consistent with 2011.
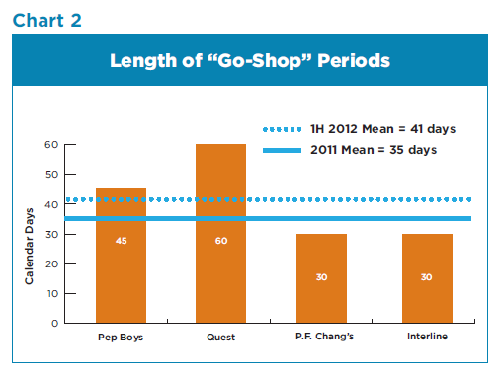
4. Despite the protracted pre-signing process, fewer targets engaged in pre-signing market checks [2] — which likely resulted in the inclusion of more “go-shop” provisions. Targets engaged in pre-signing market checks in only 33% of the 1H 2012 deals we surveyed as compared to 65% for 2011. Not surprising given the absence of pre-signing market checks, “go-shop” provisions were included in 67% of the 1H 2012 deals we surveyed as compared to 29% for 2011. Comparing “apples to apples,” of the 1H 2012 deals that did not involve a pre-signing market check, 100% had a “go-shop” provision compared to 67% in 2011. In terms of the duration of the “go-shop” period in 1H 2012 deals, the period ranged from 30 to 60 days with mean and median periods of 41 days and 38 days, respectively. The 2011 deals had a mean period of 35 days and a median period of 30 days, increases of 17% and 27%, respectively, as compared to 1H 2012 deals, although the increase was due primarily to the unusual length of the “go-shop” period (60 days) in the Quest Software transaction. (See Chart 2 below.)
5. The limited specific performance remedy against the buyer remains the rule. The limited specific performance remedy (where the target’s ability to force the buyer to close is dependent on the buyer’s debt financing being available at closing) was used in 84% of the 1H 2012 deals we surveyed as compared to 88% in 2011. [3]
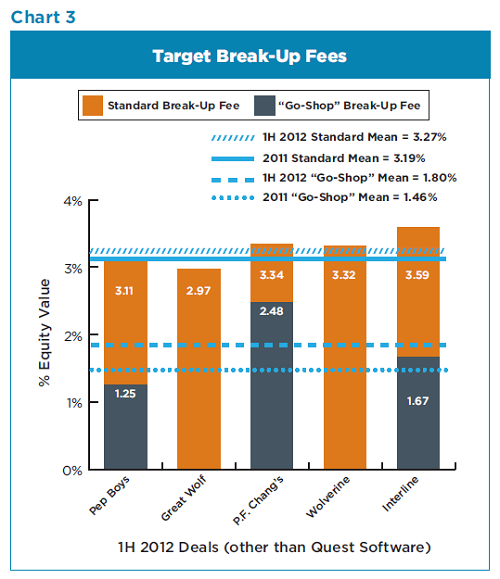
6. The average size of the target break-up fees and buyer reverse termination fees (“RTF”) were consistent with the 2011 deals, excluding the unusually low fees in one transaction. The Quest Software transaction included a standard target break-up fee of 0.33% of target equity value and a “go-shop” target break-up fee of 0.22%, whereas the other 1H 2012 deals had a mean standard break-up fee of 3.27% and a mean “go-shop” break-up fee of 1.80%. Excluding the Quest Software transaction, the fees in the 1H 2012 deals were consistent with the 2011 deals we surveyed [4] (3.19% and 1.46%, respectively). (See Chart 3 below.)
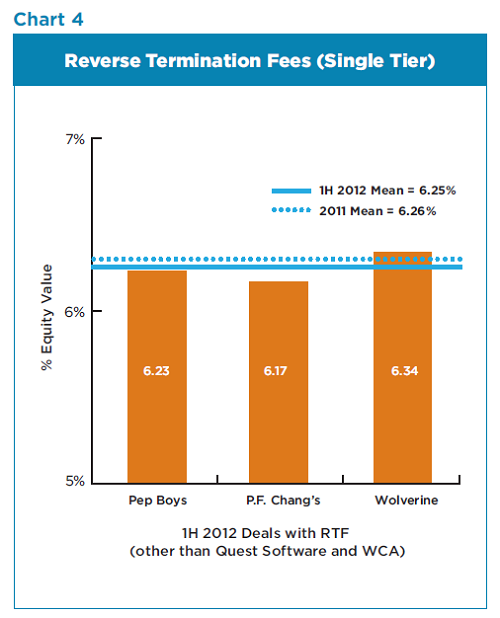
The Quest Software transaction had an unusually low RTF (0.47% of target equity value), whereas the mean size of single-tier RTFs for the other 1H 2012 deals in our survey was 6.25%. Excluding the Quest Software transaction, the mean size of single-tier RTFs was consistent with the 6.26% mean single-tier RTF we observed in 2011. (See Chart 4 below.)
7. CEOs of the target companies participated in more buy-out groups than in 2011. The target’s chief executive officer was a member of the buy-out group in 33% of the 1H 2012 deals we surveyed as compared to 18% in 2011.
Click here for larger image [5]
Survey Methodology
This Deal Study updates our survey of private equity buyer/public company target all-cash merger transactions involving consideration of at least $500 million in enterprise value.
For this update, we reviewed the treatment of certain key deal terms in the six transactions in 1H 2012 that met our study’s criteria. We compared the treatment of such deal terms with the treatment in the 17 transactions that met our criteria in 2011.
Please note that (i) our findings described in this survey are not intended to be an exhaustive review of all transaction terms in the surveyed transactions — instead, we report only on those matters that we believe would be most interesting to the deal community; (ii) our observations are based on a review of publicly available information for the surveyed transactions — the surveyed transactions accounted for only a portion of M&A activity during the survey period and may not be representative of the broader M&A market; and (iii) our observations in respect of 1H 2012 transactions are affected by the smaller sample size and equity value as compared to 2011 transactions (6 transactions in 1H 2012 vs. 17 transactions in 2011; mean equity value of $1.0 billion for 1H 2012 vs. $1.7 billion in 2011).
Endnotes
[1] On June 30, 2012, Quest Software terminated its merger agreement with Insight Venture Partners after Quest Software determined that a topping bid from Dell Inc. constituted a superior proposal. We did not include the transaction with Dell Inc. in this update because it did not involve a private equity buyer.
(go back)
[2] For purposes of our Deal Study, we characterize a deal as involving a “pre-signing market check” if the “background of the merger” discussion in the applicable proxy statement or Schedule 14D-9 disclosed that (i) the target solicited interest from at least 25 possible bidders pursuant to an active process prior to execution of the applicable merger agreement; (ii) the target was in discussion with 5 or more possible bidders without engaging in a broader solicitation of interest; or (iii) the target issued a public announcement to the effect that it was exploring “strategic alternatives.”
(go back)
[3] The one exception in 1H 2012 was Gores Group/Pep Boys, which did not include language on specific performance. We note that this deal ultimately did not close as Gores Group claimed a material adverse effect had occurred and the parties terminated their deal by mutual agreement. We believe it would be reasonable to characterize the Gores Group/Pep Boys deal as having a limited specific performance remedy, in which case 100% of the 1H 2012 deals we surveyed would be viewed as having such a remedy.
(go back)
[4] For purposes of our analysis of the break-up fees in the 2011 transactions, we excluded the Macquarie/WCA Waste Corporation transaction. In that transaction, the two-tiered break-up fees were unusually high as a percentage of equity value (7% and 10.7%), due to the significant difference between the enterprise and equity values of the target ($526 million vs. $154 million, respectively).
(go back)
[5] All dollar amounts are in millions. For two-tiered fees, the first number is the lower tier and the second number is the higher tier.
(go back)
One Trackback
[…] full article via Private Equity/Public Target Deals: Mid-Year Update — The Harvard Law School Forum on Corporate Go…. Share OptionsPrintEmailMoreFacebookLinkedInStumbleUponTwitterPinterestRedditDiggTumblrLike […]