 Print
PrintThe following post comes to us from Dr. Renzo Comolli and Svetlana Starykh, Senior Consultants at NERA Economic Consulting, and is based on portions of a NERA publication. The complete publication, including analysis of motions, trends in resolutions and settlements, and footnotes, is available here.
Legal developments have dominated the news about federal securities class actions in 2013. Last February, the Supreme Court decision in Amgen resolved certain questions about materiality but focused the debate on Basic and the presumption of reliance, which are now back to the Supreme Court after certiorari was granted for the second time in Halliburton.
Against this legal backdrop, 2013 saw a small increase in the number of complaints filed for securities class actions in general and for class actions alleging violation of Rule 10b-5 in particular. Filings in the 5th Circuit doubled, while filings in the 9th Circuit bounced back after having dipped in 2012.
Settlement activity continued to proceed at a very slow pace after the 2012 record low. But the 2013 settlements include some large ones. Nine settlements passed the $100 million mark, driving average settlement amounts to record highs never seen before. On the other hand, the median settlement dropped substantially compared to 2012. In summary, 2013 was a year in which large settlements got larger and small settlements got smaller.
Trends in Filings
Number of Cases Filed
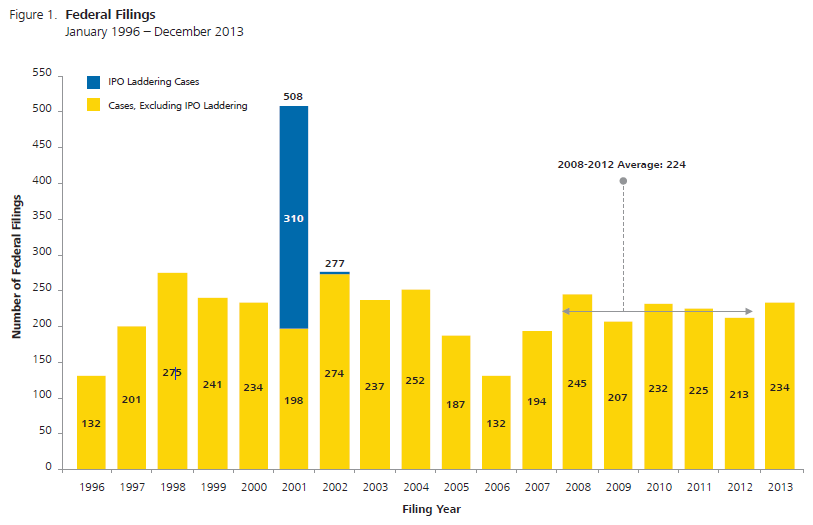
In 2013, 234 securities class action were filed in federal court. That level represents a 10% increase over 2012, and a slight increase compared to the average number of filings in the period 2008-2012. See Figure 1.
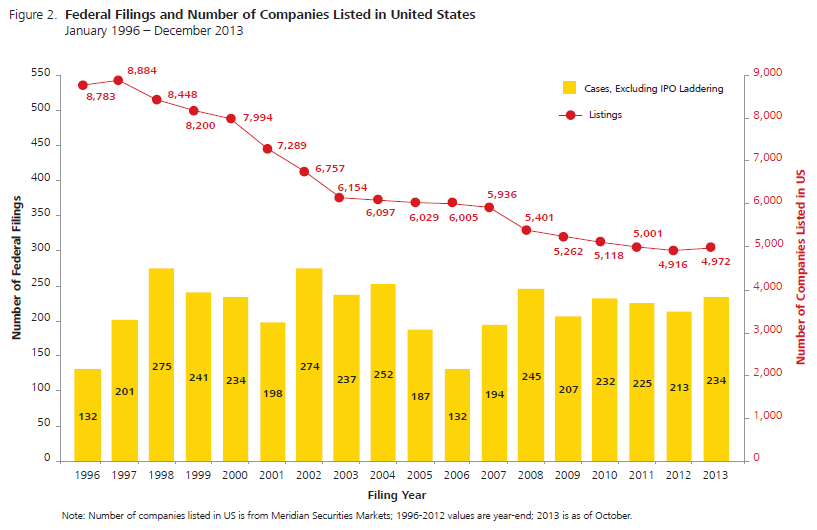
Over the 1996-2013 period, the number of publicly listed companies in the US decreased substantially. In 2013, 4,972 companies were listed in the US, 43% fewer than in 1996. Combined with the filing data, the implication of this decline is that an average company listed in the US was 83% more likely to be the target of a securities class action in 2013 than in the first five years after the passage of the PSLRA. See Figure 2.
Filings by Type
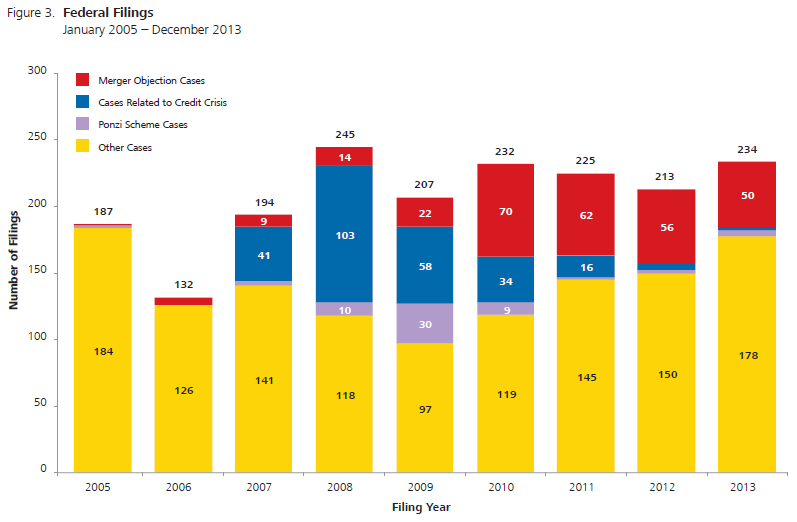
The number of merger objection cases filed in federal court continued diminishing compared to its peak in 2010. In 2013, 50 such cases were filed; this figure includes merger objections alleging breach of fiduciary duty but not a violation of a securities law. In spite of their diminishing number, merger objections represented the largest distinct group of filings among those depicted here. Many more merger objection cases have been filed at state level: we don’t include state cases in our counts.
There were hardly any new filings related to the credit crisis in 2013, which was also the case in 2012. Filings related to Ponzi schemes were also very few: just four. See Figure 3.
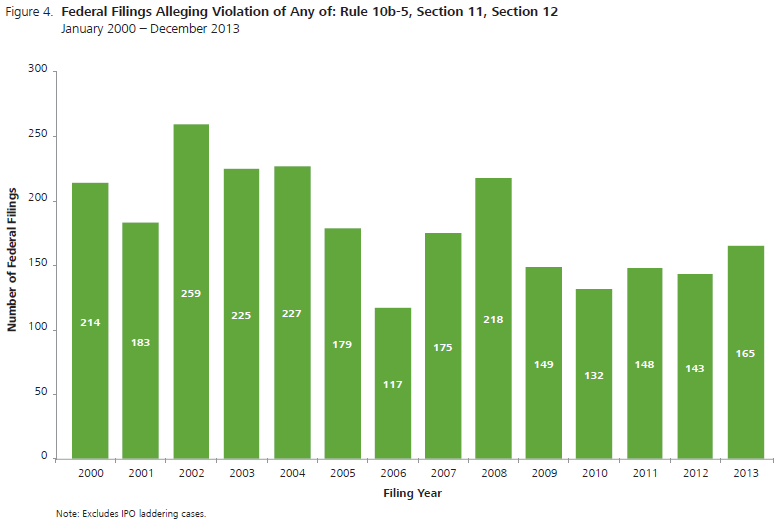
A different way of classifying filings is based on whether they allege violations of Rule 10b-5, Section 11, and/or Section 12. These filings are often regarded as “standard” securities class actions and are depicted in Figure 4. In 2013, 165 “standard” cases were filed, a 15% increase over 2012 and more than any year in the 2009-2012 period. This figure, however, is still much lower than the 218 “standard” cases filed in 2008 during the filing peak associated with the credit crisis.
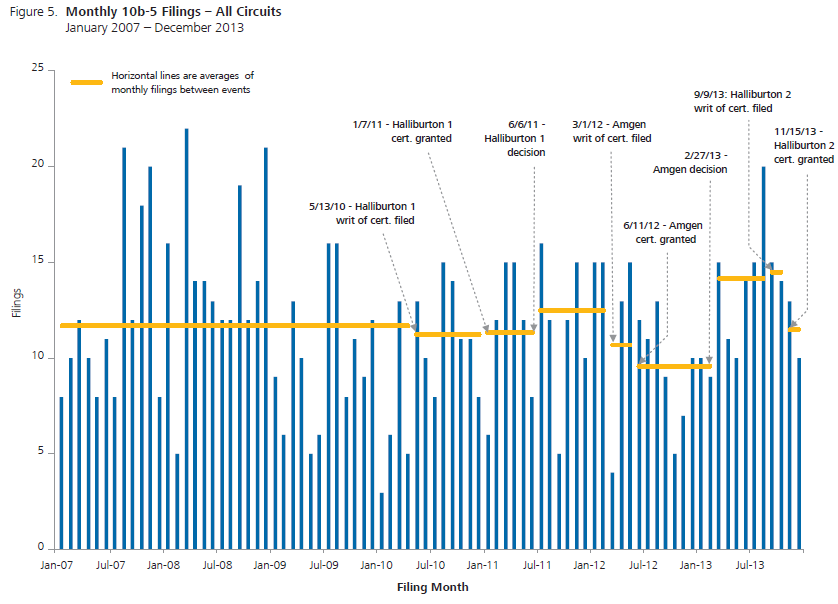
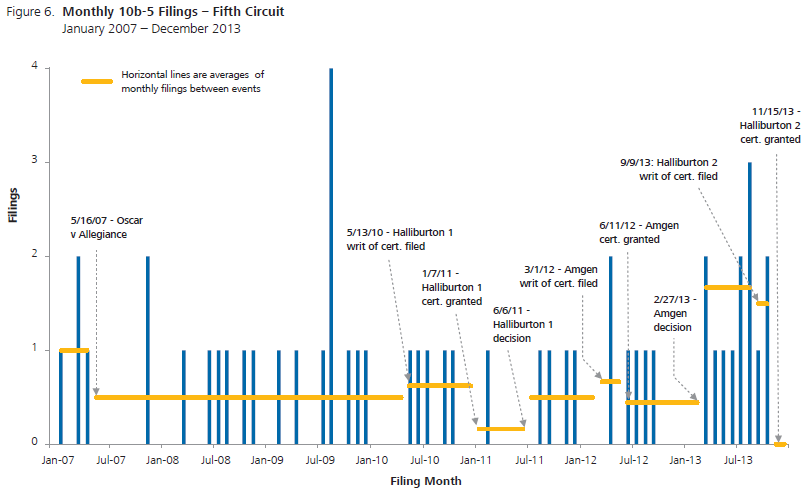
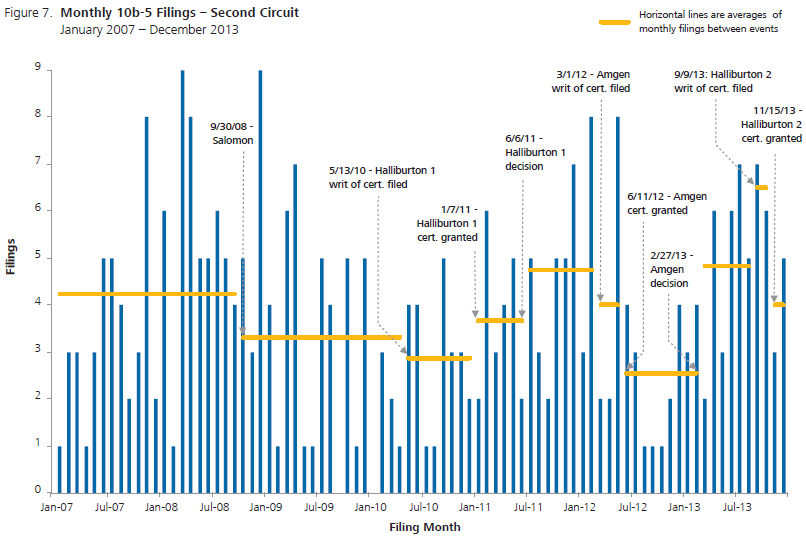
The Supreme Court’s second grant of certiorari in Halliburton is commanding attention because of the possible impact it might have on securities class action litigation. The Supreme Court recently issued two other decisions about securities class actions alleging violation of Rule 10b-5: the first Halliburton decision and the Amgen decision. Figure 5 shows the number of 10b-5 class action monthly filings in the periods surrounding these decisions. Figures 6 and 7 are equivalent figures for the 2nd and the 5th Circuit, respectively. In the figure about the 2nd Circuit, we add the 2nd Circuit decision in Solomon; while in the chart about the 5th Circuit, we add the 5th Circuit decision Oscar v Allegiance. In the 5th Circuit, 13 10b-5 class actions were filed in 2013 (all of them after the Amgen decision) compared to 6 filed in 2012 and 5 filed in 2011. Of course, we are not suggesting how much, if any, of the change in the filing activity is due to these decisions as, in these years, the litigation environment was influenced by many other factors but we do note a 48% increase in average monthly filings from the period Amgen certiorari—Amgen decision to the period Amgen decision—Halliburton second writ.
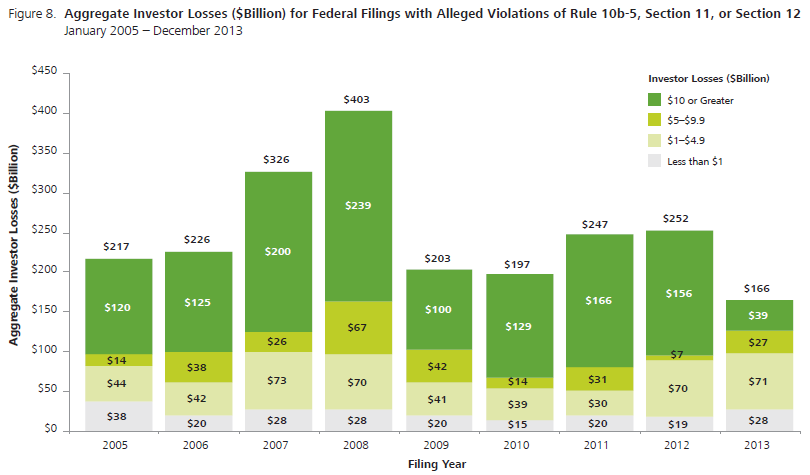
In addition to the number of filings, we also analyze the size of the cases that they represent using a measure we label “investor losses.” Aggregate investor losses as shown in Figure 8 are simply the sum of total investor losses across all cases for which investor losses can be computed.
In 2013 aggregate investor losses were noticeably smaller than in any other year since 2005. The reduction was driven by the scarcity of filings associated with investor losses larger than $10 billion; only one such case was filed in 2013. Cases associated with investor losses in that range are very few in a given year, but because of their size, even just a couple of them can have a sizeable impact on the aggregate.
NERA’s investor losses variable is a proxy for the aggregate amount that investors lost from buying the defendant’s stock rather than investing in the broader market during the alleged class period. Note that the investor losses variable is not a measure of damages, since any stock that underperforms the S&P 500 would have “investor losses” over the period of underperformance; rather, it is a rough proxy for the relative size of investors’ potential claims. Historically, “investor losses” have been a powerful predictor of settlement size. Investor losses can explain more than half of the variance in the settlement values in our database.
We do not compute investor losses for all cases included in this publication. For instance, class actions in which only bonds and not common stock are alleged to have been damaged are not included. The largest excluded groups are the IPO laddering cases and the merger objection cases. NERA reports on securities class actions published before 2012 did not include investor losses for cases with only Section 11 allegations, but such cases are included here. The calculation for these cases is somewhat different than for cases with 10b-5 claims.
Technically, the investor losses variable explains more than half of the variance in the logarithm of settlement size. Investor losses over the class period are measured relative to the S&P 500, using a proportional decay trading model to estimate the number of affected shares of common stock. We measure investor losses only if the proposed class period is at least two days.
Filings by Issuers’ Country of Domicile
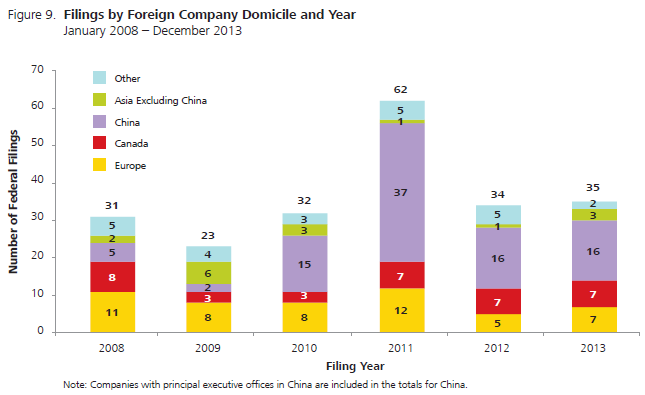
In 2011, a record number of cases were filed against foreign issuers, with a total of 62. More than half of those cases reflected a surge of filings against companies domiciled or with principal executive offices in China. Filings against Chinese companies dropped significantly in 2012 and remained constant in 2013, with only 16 suits filed. See Figure 6. The total number of filings against all foreign-domiciled companies followed a similar pattern. See Figure 9.
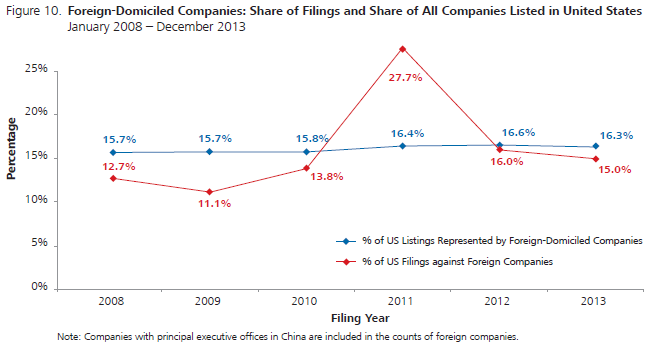
Figure 10 shows that in 2011 foreign-domiciled companies were disproportionally targeted by securities class actions. That is, securities class actions against foreign-domiciled companies represented a larger proportion of total securities class actions compared with the proportion that listings of foreign-domiciled companies represented of total listed companies. In 2012 and 2013 foreign-domiciled companies have not been disproportionally targeted.
Filings by Circuit
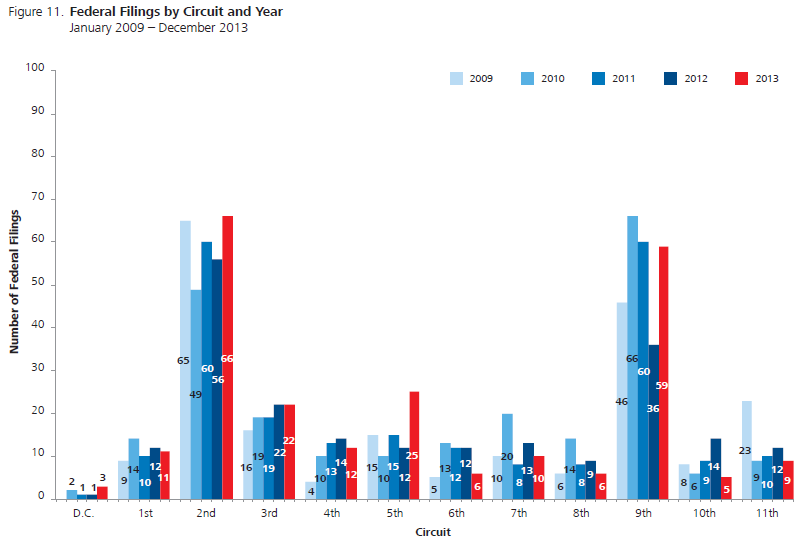
Historically, filings have been concentrated in two US circuits, and 2013 was no exception: the 2nd and the 9th Circuits, which respectively include New York and California, together accounted for 53% of the 2013 filings. Filings in the 9th Circuit rebounded markedly from the low in 2012: 59 cases were filed there in 2013, a 64% increase from the previous year and close to the 2009-2011 average. The 2nd Circuit exhibited a comparatively smaller increase: 66 cases were filed there in 2013, an increase of 18% compared to the previous year. See Figure 11.
In the 5th Circuit, more than twice as many securities class actions were filed in 2013 as in 2012. With 25 cases filed, the 5th Circuit, which includes Texas, still represented only 11% of the US cases. However, the 2013 level was exceptional for the 5th Circuit: it was the highest level since 2000. This increase is related to the increase in 10b-5 class action filings discussed in Figure 6.
Filings by Sector
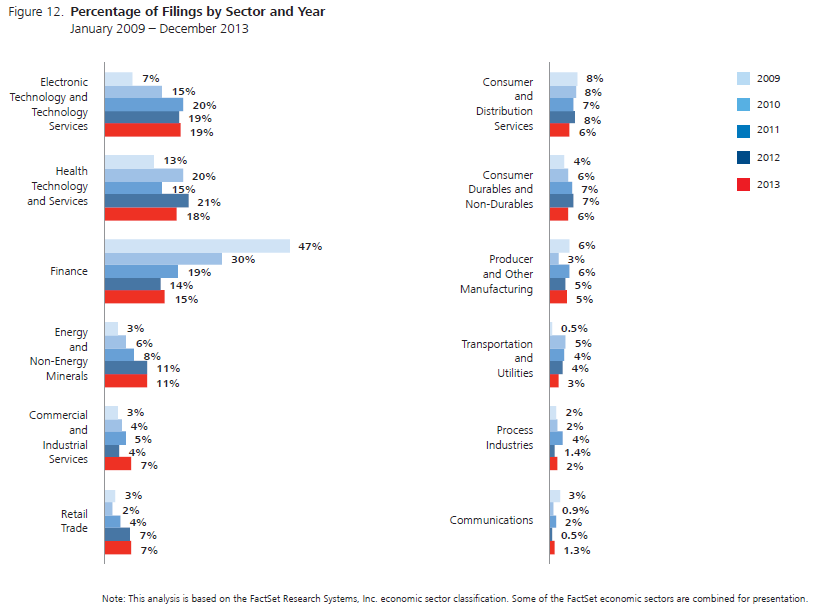
The electronic technology and services, health technology and services, and finance sectors taken together continued to account for more than half of the primary defendants. In 2013, these sectors represented, respectively, 19%, 18%, and 15% of the filings’ targets. See Figure 12. In 2008, due to the credit crisis, filings against primary defendants in the financial sector accounted for 49% of filings (not shown). From that 2008 peak, the share of filings accounted for by the financial sector declined to 14% in 2012, with a barely perceptible rebound in 2013 to 15%.
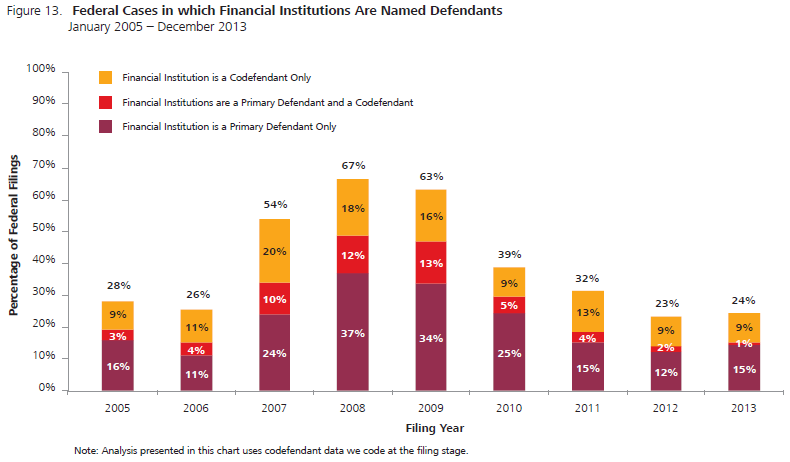
Companies in the financial sector are often also targeted as codefendants.
Figure 13 shows that 9% of filings in 2013 involved a financial institution as a codefendant, but not a primary defendant. The overall pattern of filings against financial institutions as a share of total filings is similar whether financial codefendants are included in the calculation or not: the share peaked with the credit crisis and has been declining since, with a barely perceptible rebound in 2013 to 24%.
Accounting codefendants
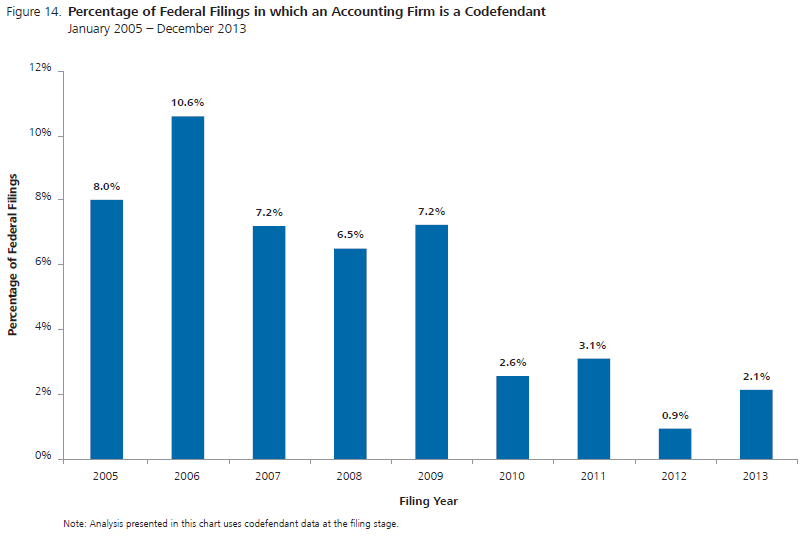
Only 2.1% of federal securities class actions filed in 2013 included an accounting codefendant in the initial filing. This level represented a slight uptick from the previous year but it was still a much lower level than the one experienced in the 2005-2009 period, when on average 7.7% of cases named accounting codefendants. See Figure 14.
As noted in prior publications, this trend might be the result of changes in the legal environment. The Supreme Court’s Janus decision in 2011 restricted the ability of plaintiffs to sue parties not directly responsible for misstatements, and, as a result, auditors may only be liable for statements made in their audit opinion. This decision, along with the Court’s Stoneridge decision in 2008 that limited scheme liability, may have made accounting firms unappealing targets for securities class action litigation.
Allegations
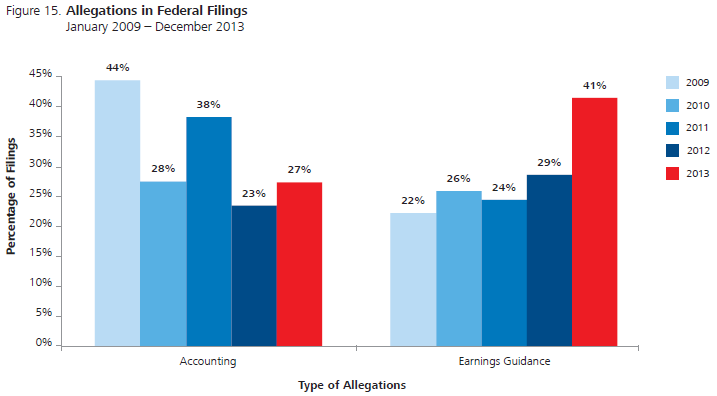
Allegations involving misleading earnings guidance were up sharply in 2013, representing 41% of complaints, compared to 29% in 2012. More than a quarter of filings included accounting allegations—more than in the previous year, but less than the 44% observed in 2009. See Figure 15. The decline in accounting allegations may be related to the reduction in cases with accounting codefendants.
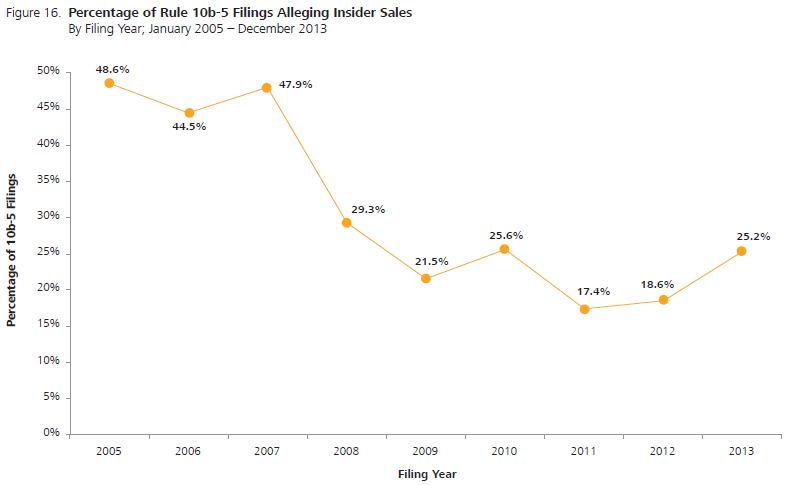
The percentage of class actions with Rule 10b-5 allegations that also alleged insider sales had been on a sharply decreasing trend between 2005 and 2011, dropping from 48.6% to 17.4%. This trend started to reverse in 2012, and in 2013 insider sales allegations were included in a quarter of all 10b-5 class actions. See Figure 16.
Time to File
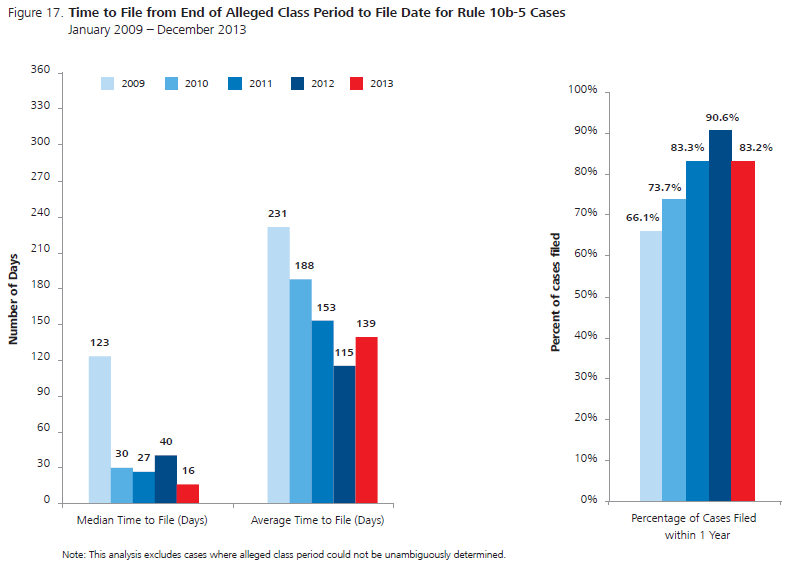
Half of the class actions filed in 2013 were filed within 16 days from the end of the alleged class period, a marked acceleration compared to the 40 days it took to file half of the class actions in 2012. This acceleration, though, did not involve all filings: the mean time to file increased to 139 days from 115. In other words, fast class actions got faster and slow class actions got slower. See Figure 17.
The complete publication, including analysis of motions, trends in resolutions and settlements, and footnotes, is available here.