 Print
PrintRohit Kulkarni is Managing Director of the Private Investment Research Group at SharesPost, Inc. This post is based on a SharesPost publication by Mr. Kulkarni and Jennifer Phillips.
Though everyone in the venture community is cognizant of the growth in the number and size of mega-private financings (i.e., $100MM+), we wanted to present our clients with a much clearer understanding of the trend and how it is impacting the capital markets for emerging growth technology companies.
To do that, we analyzed literally thousands of venture financings since the Great Recession (i.e., 2007-2008). In this post, we explore answers to a range of questions related to the private tech funding landscape, including: 1) How have VC investment dollar allocations trended across early-stage, mid-stage and late-stage private tech companies since the Great Recession? 2) How have the number of investments and pre-money valuations trended across early-stage, mid-stage, and late-stage private tech companies? 3) Which indicators suggest a change in sentiment among private tech investors? 4) Which early indicators presage the shape and direction of private tech investments over the next 12-24 months? Key highlights of our findings include:
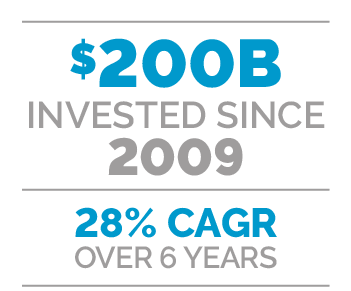
Roughly $200B invested in U.S. private tech companies since 2009.
There has been a remarkable increase in the number of investments as well as the dollar amount invested in Private Tech companies, both in U.S. and overseas. Based on Pitchbook data, we estimate that U.S.-based Private Tech companies have raised roughly $200B in past 6.5 years, growing from $10B per year in 2009 to $50B in the past 12 months. This translates to a robust 28%, six-year CAGR in the amount of (inflation unadjusted) capital invested in private tech companies since the Great Recession. 2015 and 2014 ranked No. 3 and No. 4 in past 20 years as far as dollars invested in US-based private tech companies (followed by 2000 at #1 and 1999 at No. 2). And, 1H:16 trends indicate that 2016 could very well end up grabbing the silver medal, exceeding 1999 levels.
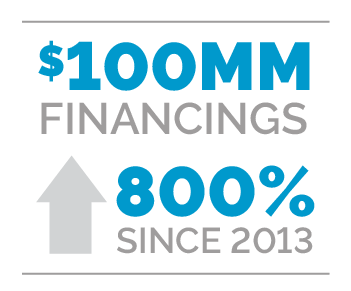
Late-stage mega deals captured more than 70% of incremental VC dollars invested since 2013.
We noticed two distinct, three-year private tech investment paradigms since the end of the Great Recession. From 2009-12, VC dollars invested in US-based private tech companies roughly doubled from $10-12B per year to $20-25B per year. Companies across all stages experienced a post-recession tailwind leading to a “reversion to mean” funding levels. Since 2013, VC dollars invested in US-based private tech companies have doubled again. That was driven by 8x increase in the dollars raised via late-stage mega deals (more than $100MM per financing), effectively growing from 12% of dollars in 2013 to 44% of VC dollars invested in trailing twelve months. Or, roughly $19.5B out of $27.5B in incremental investments (i.e. the delta between $23B in total VC spend in 2013 and $50.5B TTM) have been invested in $100MM-plus mega deals, representing to more than 70% of incremental dollars invested in this burgeoning asset class.
Late-stage mega deals continue to grow, as giga-deals emerge.
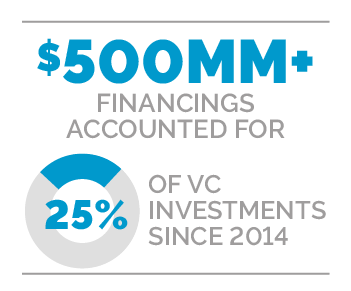
Over the past 10 quarters, there have been at least ten $100MM mega private tech deals every quarter. However, the mega-deal velocity appears to have peaked around Q3:15, and the quarterly run-rate of such mega deals has declined steadily in 1H:16. Coincidentally, we have witnessed the emergence of the $500MM round. There have been 18 such mega $500MM+ financing rounds worth $21.5B since late 2014, accounting for 25% of capital invested in US-based private tech companies. Clearly, there is a growing focus on and investor/capital concentration around a select group of mature, very late-stage private tech companies.

Overall investment slowing and concentrating in the winners.
Recent trends indicate that private tech investors are taking a page out of public tech investors’ playbook: They are doubling down on a smaller group of likely category winners. Private tech capital appears to concentrate among large/mature private tech companies as investors seem to follow a “winners take most” paradigm. Excluding mega deals to mega-cap private tech players, we estimate that gross dollars raised by U.S.-based private tech companies have declined 10% in 1H:16 on a year-on-year basis. Trends in late-stage investing, excluding such mega deals, seem to mimic the trends observed in early-stage investing in early 2014, when deal volume slowed and subsequently lead to declining dollars. We’d expect the ongoing normalization in private tech investment activity to continue as the investor sentiment pendulum continues to swing from “Fear Of Missing Out” (FOMO) to “Fear Of Jumping In” (FOJI) across all stages/deal sizes. We’d characterize such an imminent decline in invested capital as a healthy return to a more balanced state of demand and supply. Nonetheless, as we highlight in our upcoming deep-dive into VC fundraising trends, we think a significant amount of money is sitting on the sidelines seeking growth investment opportunities!
$200B+ invested in U.S. private tech growth asset class since 2009
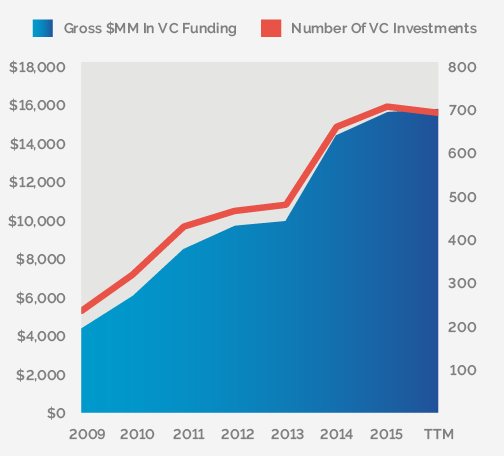
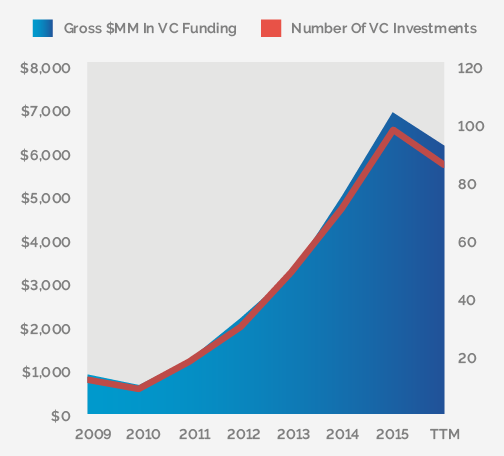
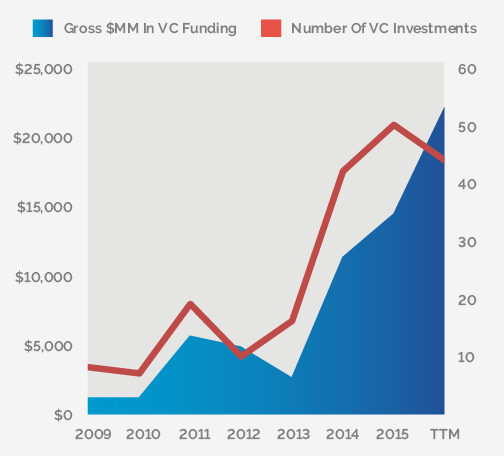
Since early 2009, there has been a steady and consistent increase in the number of investments and aggregate dollars invested in private tech companies. We analyzed Pitchbook data of VC-backed “Information Technology” companies segmented by size of a deal, and then sliced this data to create a time series over the past 30 quarters. The general trend has been fairly linear, with early signs of slower deal velocity emerging around late 2014 to mid-2015 across deal sizes. As illustrated in the chart below, the number of investments completed by VCs in the tech sector increased quite consistently on a Y/Y basis from 2009 thru 2014. However, the number of investments has declined Y/Y over the past couple of years. For context, we estimate there were roughly 1,600 investments done in US-based private tech companies in 2009, or roughly 400 per quarter. This deal velocity increased to roughly 3,200 deals during 2011, and it peaked at almost 6,400 deals during 2014. Since the beginning of 2015, the number of investments completed by private tech investors in US-based companies has steadily declined sequentially.
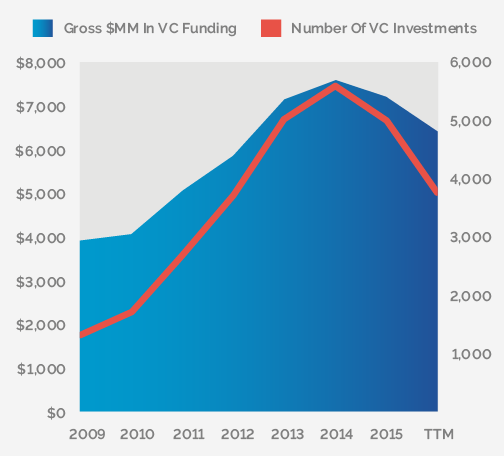
While the number of deals seems to be following a cycle, the gross amount of dollars invested in private tech companies has continued to rise quite consistently. Arguably, invested capital reached a positive inflection point in 2013-14, and it has continued to rise at an accelerated pace over the past 24-36 months. For context, based on Pitchbook data, we estimate that US-based private tech companies raised $10.3B in 2009 from VC investors. And, this amount has steadily increased at the rate of 25-30% Y/Y over the past 6 years. All in, US-based private tech companies have raised more than $200B since the end of the Great Recession, leading to more than $500B in market capitalization (as highlighted in our recent report titled, “Zero to One Billion: Demystifying Unicorns”).
Exhibit 1: VC Funding Trends—Number Of Investments and Gross $MM Invested Per Year
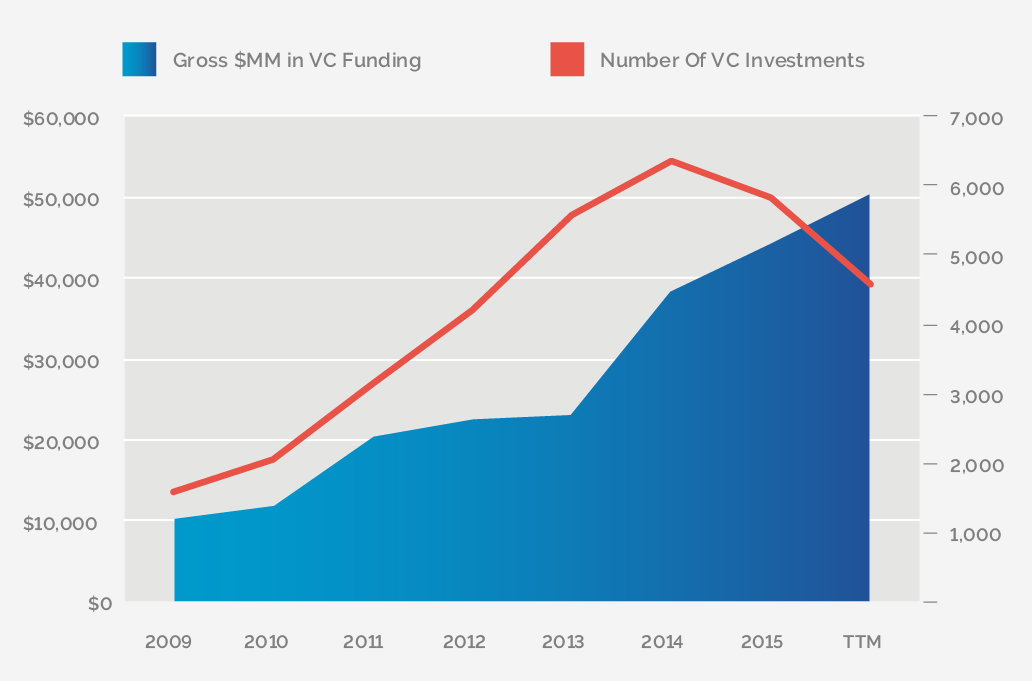
Source: NVCA, Pitchbook, SharesPost Research; $ in millions
Overall VC deals declining, but VC dollars remain near record highs
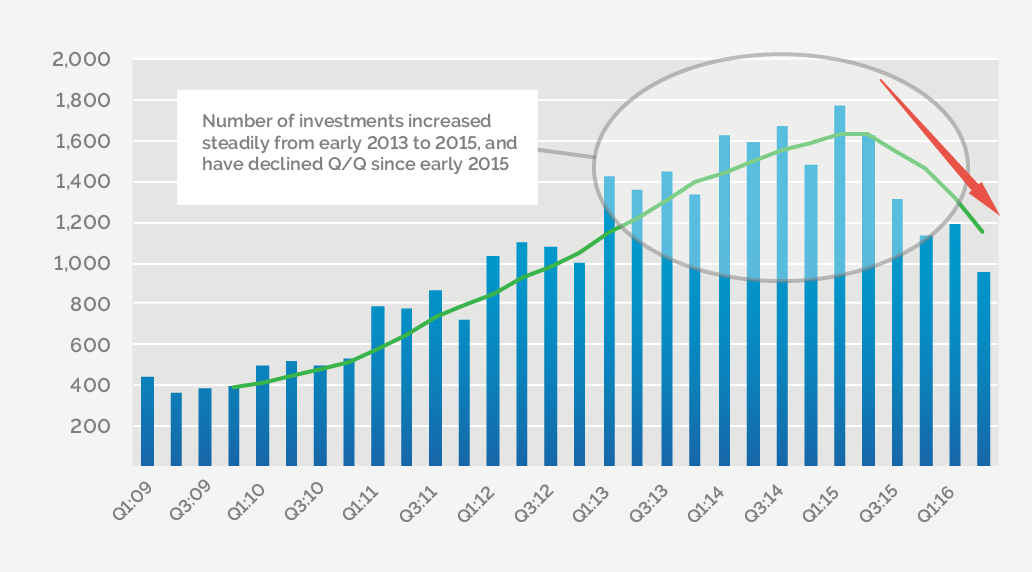
When observed at a more granular level (quarterly basis), as illustrated in the chart below, the number of investments increased from a sub-500 quarterly run-rate during 2009-2010 to a range of 500 to 1,000 during 2012-2013. This deal velocity peaked at roughly 1,800 deals per quarter in Q1 ’15. And, since early 2015, the number of investments has declined on a Q/Q basis. On a YTD basis, VCs have completed approximately 2,100 investments. This implies a gradual decline vs. 2,400 investments in 2H:15, 3,400 in 1H:15, and 3,200 in 2H:14. In other words, recent trends in deal velocity indicate a steady and sequential decline over the past 5-6 quarters.
Exhibit 2: VC Funding Trends—Number of Investments Per Quarter In U.S.
 Source: NVCA, Pitchbook, SharesPost Research; $ in millions
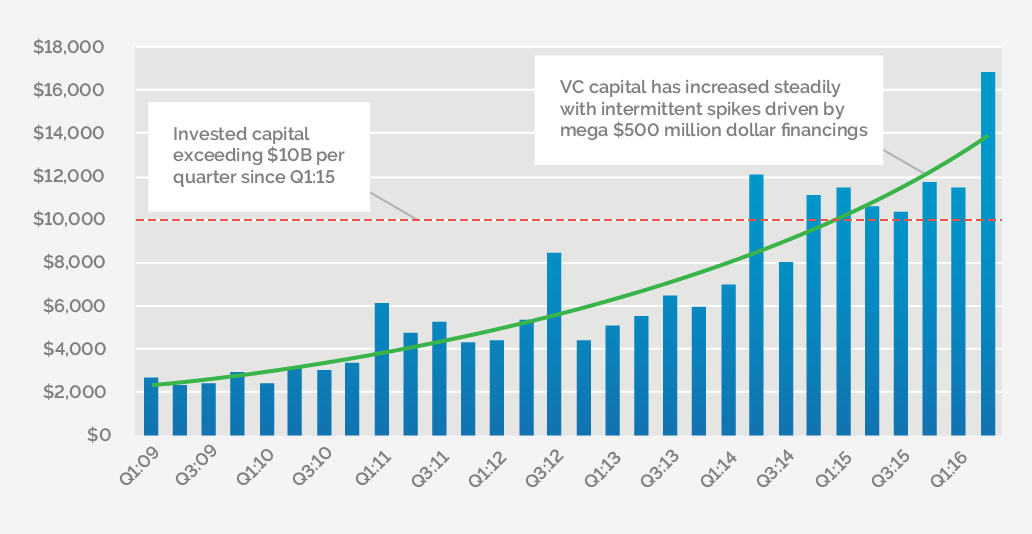
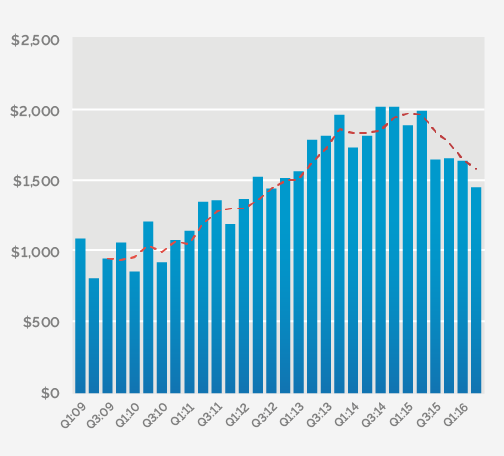
While the number of VC deals competed per quarter has slowed down over the past 18 months, the gross amount of dollars invested on a quarterly basis has stayed at a fairly high water mark. We illustrate a quarterly trend from the beginning of 2009 in the chart below. Key observations include:
- Quarterly run-rate of VC invested capital has increased roughly 4-5x over the past 5-6 years. For context, VCs invested about $2-3B per quarter in 2009-10 and about $5B in 2011-12. Over the past 18-24 months, the quarterly run-rate has increased to roughly $10-12B, with a new record high set in the most recent quarter, Q2:16, at roughly $16.9B. We’d highlight that Pitchbook’s Q2 data includes Uber’s recent $5.8B funding round, which accounted for more than 35% of Q2’s $16.9B invested capital. We think this most recent Uber funding round was raised in multiple tranches, starting Q4:15. To plot a more accurate trend, we’d normalize this amount by distributing it across the past three quarters. Nonetheless, TTM data included in exhibit 1 accounts for such quarterly discrepancies.
- It appears there is a little bit of seasonality in VC investments as 2H investment dollars have exceeded 1H investment dollars during six out of the past seven years. VCs tend to invest more in 2H of a given fiscal year, likely playing catch-up to meet capital thresholds or completing due diligence on existing deals. And, drawing this out further, we’d expect the gross capital invested by private tech investors in 2016 to exceed $50B, given the $25B+ invested in 1H:16.
Exhibit 3: VC Funding Trends—Gross Capital Invested Per Quarter In U.S.
Source: NVCA, Pitchbook, SharesPost Research; $ in millions
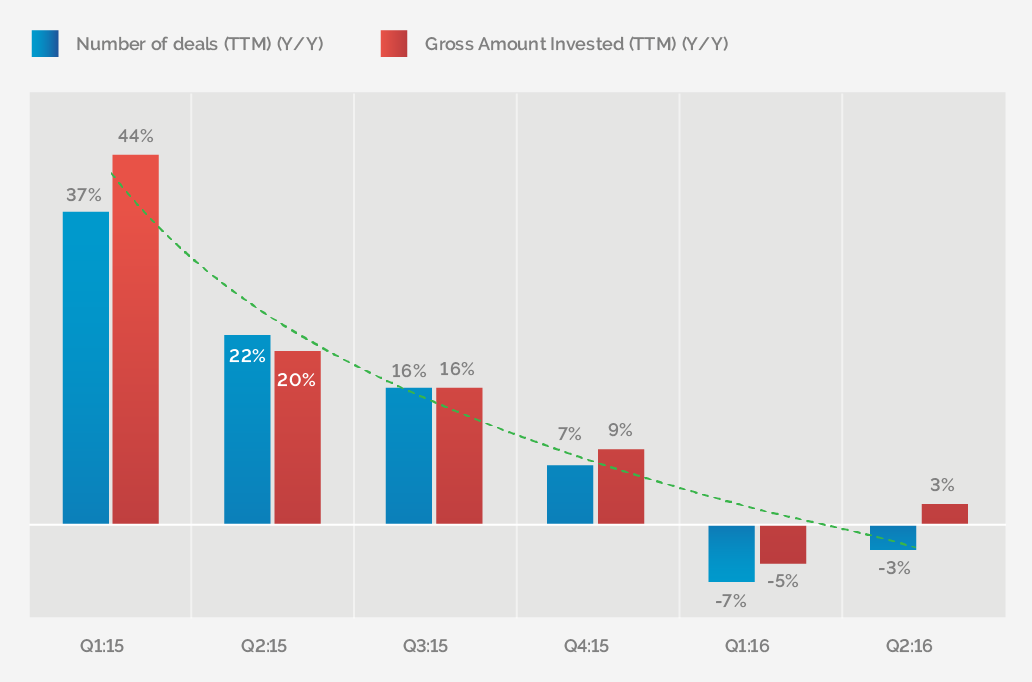
However, we’d also highlight that the overall velocity of investments and gross dollar amount has been steadily decelerating over the past 4-6 quarters. To account for seasonality in investments, we calculated year-on-year growth trends based on the trailing twelve months’ cumulative number of investments and gross capital invested. As illustrated in the chart below, the number of investments in the private tech sector has steadily declined from a growth rate in the mid-to-high 40% range in early 2014 down to 20% range year-on-year growth rates in 1H:2016. On the other hand, there have been greater swings in the year-on-year growth rate of gross capital invested. This has been largely driven by mega $500 million deals that have accounted for as much as 40% of gross capital invested in couple of quarters in the past few years. Regardless of such volatility in the year-on-year growth rate, the overall trend over the past 18 months has been steady deceleration in the amount of capital invested as well.
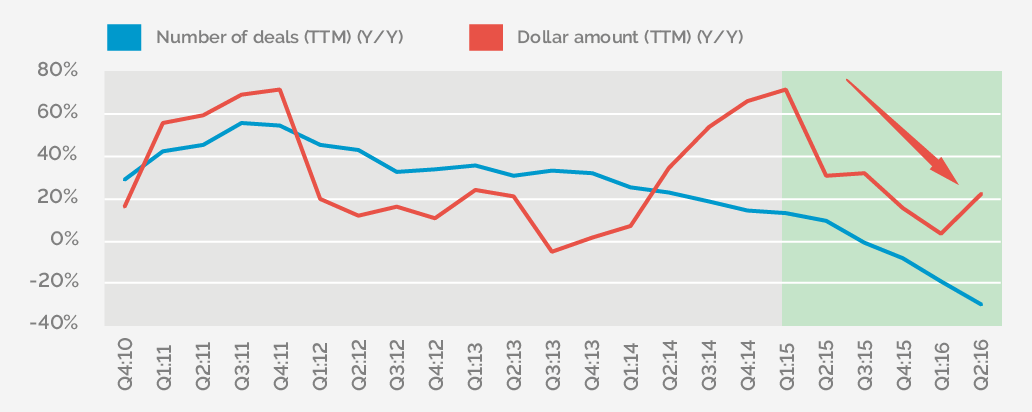
Source: NVCA, Pitchbook, SharesPost Research
Late-stage mega deals contributed 70% of incremental VC dollars since 2013
Second, we looked under the hood to determine key factors leading up to the growth in dollars invested in US-based private tech companies. Over the past 20 years, VC investments in private tech companies have ranged between $10-20B, except five years when it has exceeded $30B (Those years were 2000 at $91B; 1999 at $45B; 2015 at $44B; 2014 at $38B; and 2001 at roughly $31B.)
To provide a better frame of reference for the recent growth in VC dollars, we illustrate below a long-term trend in dollars invested by VCs in tech and peripheral sectors. We’d note that the chart below is based primarily on NVCA data and is filtered by the following industry classifications: Business Products and Services, Computers and Peripherals, Consumer Products and Services, Electronics/Instrumentation, IT Services, Telecommunications, Software, Networking and Equipment, Semiconductors and Media and Entertainment. And, we have NOT included VC dollars invested in following industries: Biotechnology, Financial Services, Healthcare Services, Industrial/Energy, and Medical Devices and Equipment.
Exhibit 5: VC Funding Trends—Gross $MM Invested Per Year In Tech and Peripheral Sectors
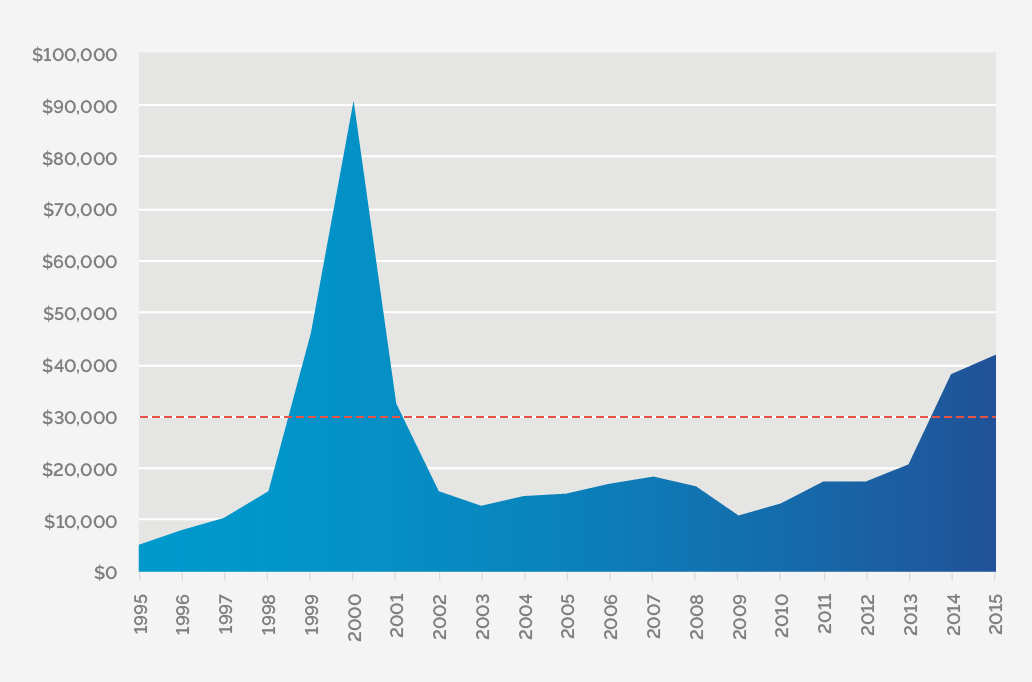
Source: PwC/NVCA MoneyTree™ Report, Data: Thomson Reuters; SharesPost Research; $ in millions
Peeling back the onion, we looked at the amount of VC dollars invested by stage of the company, or by the size of the deal. For purposes of this post, we divided private tech deals in to four segments—below $10MM, between $10-50MM, between $50-100MM, and above $100MM. Our hypothesis is that there is a growing bifurcation in private tech funding across early-stage companies and late-stage private tech companies. While it seems to be a particularly difficult time for early stage companies to raise capital, we believe that the overall slowdown in VC funding hasn’t yet impacted late-stage, VC-backed companies.
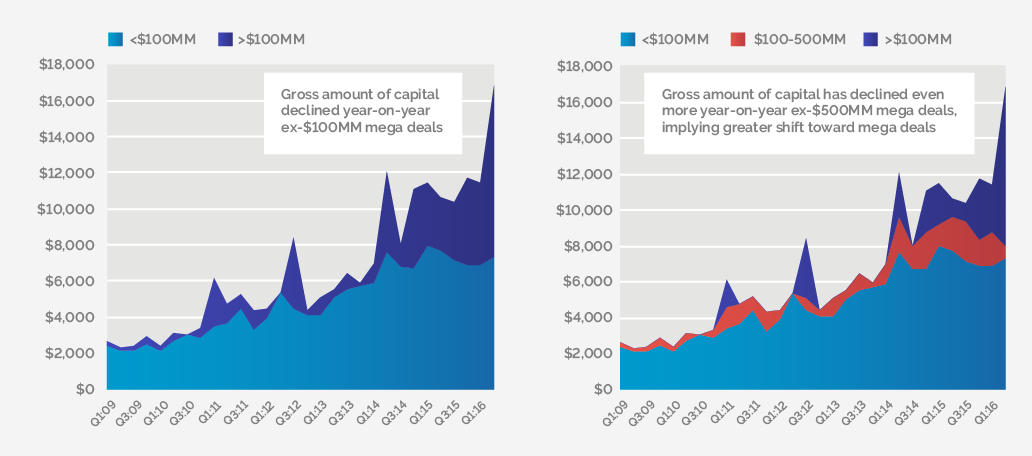
We illustrate the trends in the gross amount of capital invested, segmented by deal size in these four categories in charts below. The headline takeaways from these trends are as follows:
Deal sizes below $10MM:
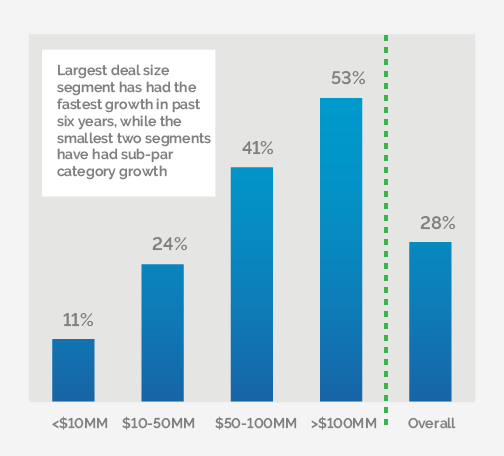
During 2009-10, roughly $4B of capital raised by US-based private tech companies came via small deal sizes—those below $10MM. This translated to 38% of all VC invested capital in private US-based tech companies. Over the past five years, this has grown to roughly $7B invested via sub-$10MM deals per year, translating to 11% six-year CAGR, which is below the overall VC industry growth rate at 25-30% per year. Effectively, the proportion of VC capital invested via early stage deals has dropped from 38% of VC invested dollars to 16%, while the overall VC investment market has grown at more than 25% per year over the past six years.
Deal sizes between $10-50MM:
In 2010, approx. $4.3B of capital raised by US-based private tech companies came from deals ranging between $10MM and $50MM. We’d characterize these deals as largely around Series A, Series B or Series C investments in private tech companies. During 2009-10, about 5-6 years ago, such deals accounted for 40-42% of all VC invested capital in private US-based tech companies. Over the past twelve months, roughly $15.7B in capital was raised for such mid-stage deals, translating to 24%, six-year CAGR. This is slightly below the 28% growth observed in overall VC dollars invested. Effectively, the proportion of VC capital invested via mid-stage stage deals has edged lower from a range of 40-42% in 2009-10 to 30-35% in the past 12 months.
Deal sizes between $50-100MM:
Traditionally, VC deals from $50MM to $100MM were regarded as late-stage growth equity investments. However, given the ongoing changes in the private tech landscape, we’d characterize deals with ticket sizes of $50-100MM as “small-ticket, late-stage” deals. During, 2009-2010, US-based private tech companies raised roughly $700-900MM per year via such deals. This translated to roughly 6-9% of overall VC dollars. Over the past five years, capital invested via $50-100MM deals has increased 7-8x to $7B in 2015, translating to a 41%, six-year CAGR. All in, the proportion of VC’s invested capital allocated to such small-ticket, late-stage deals has edged higher from 6-9% in 2009-10 to 13-15% over the past 12 months.
Deal sizes above $100MM:
From 2009 thru 2011, there were roughly 1-2 deals per quarter with deal sizes exceeding $100MM. The deal frequency in this category has jumped to more than ten deals per quarter during past eight quarters. Effectively, the amount of capital raised by private tech companies via such deals has increased 15x from less than $1.5B per year during 2009 and 2010 to more than $22B in the most recent trailing twelve months. And, the proportion of private tech investment capital being deployed in such mega-deals has increased from <1% in 2009-2010 to more than 40% in the past twelve months (from Q3’15 to Q2’16).
Exhibit 6: VC Funding Trends—Gross $MM Invested Per Year

Source: NVCA, Pitchbook, SharesPost Research; $ in millions
Exhibit 7: VC Capital Invested By Size Of Deals—Majority of Growth Coming From Larger Deals
Source: NVCA, Pitchbook, SharesPost Research; $ in millions
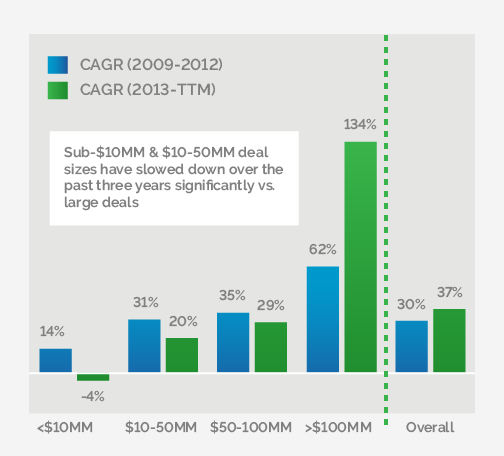
While there has been a consistent, and remarkable increase in the dollars invested in private tech companies since the Great Recession, we noticed two distinct, three-year private tech investment paradigms since the end of the Great Recession. From 2009-12, VC dollars invested in US-based private tech companies roughly doubled from $10-12B per year to $20-25B per year, as companies across all stages experienced a post-recession tailwind leading to a “reversion to mean” funding levels. Since 2013, VC dollars invested in US-based private tech companies have doubled again. This is driven by 8x increase in the dollars raised via late-stage mega deals (more than $100MM per financing), effectively, growing from 12% of dollars in 2013 to 44% of VC dollars invested in the trailing twelve months. And, as highlighted above, the growth rate segmented by deal sizes has varied significantly, too. For instance, early stage deals increased at mid-teens, year-on-year growth immediately following the end of Great Recession (2009 to 2012). But, over the past three years, dollars invested via early stage deals have started to decline, translating into to a low single digits year-on-year growth rate. On the other hand, dollars raised by private tech companies via mega $100MM deals have continued to grow at a remarkable rate at or above 50% every year since 2009. Effectively, the amount of dollars in this deal size segment increased 5x from 2009 through 2012 and 8x from 2013 to TTM.
Exhibit 8: Comparing six-year CAGR In Capital Invested By Deal Size (2009 to TTM)
Source: NVCA, Pitchbook, SharesPost Research; $ in millions
Exhibit 9: Comparing three-year CAGR In Capital Invested By Deal Size (2009 to 2012 & 2013 to TTM)
Source: NVCA, Pitchbook, SharesPost Research; $ in millions
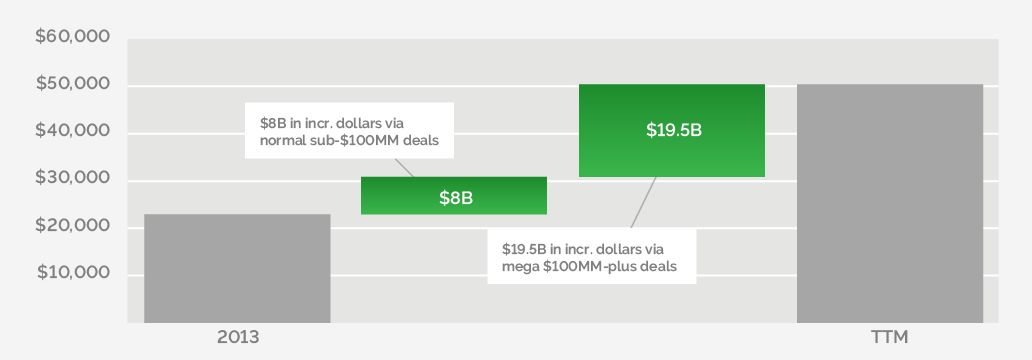
All in, as illustrated in the chart below, VC dollars invested have doubled from $23B in 2013 to roughly $50B in past twelve months. Put another way, roughly $27B incremental VC dollars have been invested over the past 3.5 years. And, roughly $19.5B of these incremental $27.5B investments have come via $100MM mega deals. More than 70% of incremental VC dollars since 2013 have come via mega $100MM deals.
Exhibit 10: Mega $100MM deals represent 70% of incremental VC dollars since 2013
Source: NVCA, Pitchbook, SharesPost Research; $ in millions
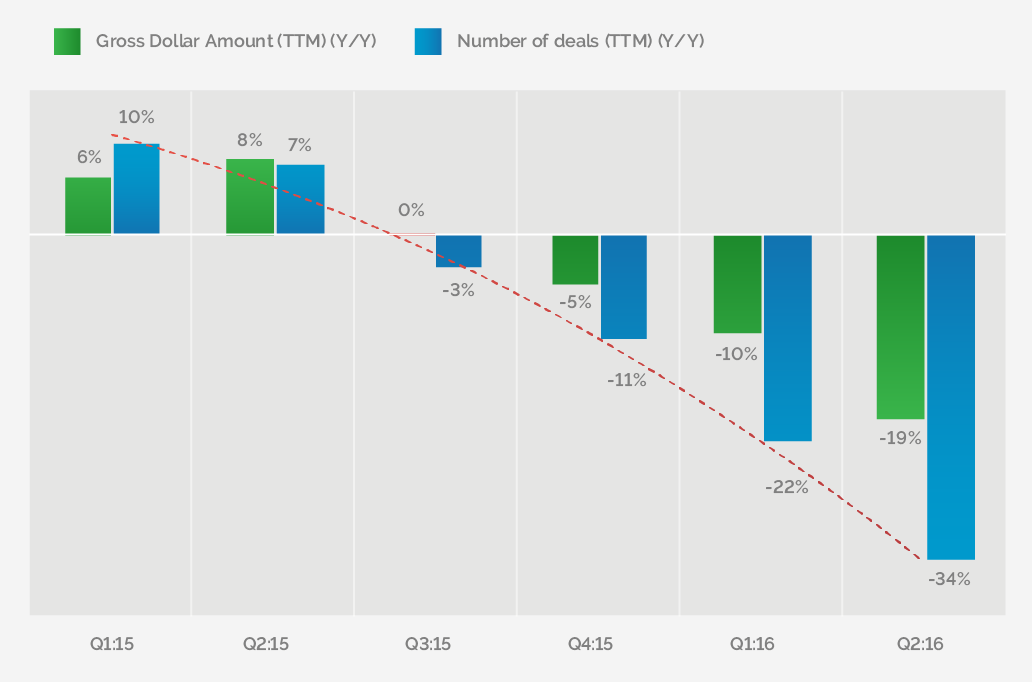
Small VC investments (<$10MM)—From Fomo to Foji with accelerating declines
The headline here is that early-stage investors appear to be going from FOMO to FOJI as both the gross dollar amount and number of deals under $10MM ticket size have been declining over the past four quarters. And, Y/Y declines in 1H:16 have gotten “more worse,” implying a clear and accelerating reversal in investor sentiment. Small VC Investments (with median deal size of roughly $1.5MM and median pre-money valuation below $10MM) account for approximately 80-85% of VC deals and 10-15% of invested dollars.
We illustrate the year-on-year growth trends of gross dollars invested and number of deals done on a trailing twelve months basis. The takeaway here is that the downward trend has accelerate as the year on year declines in both key metrics have gotten larger. If the current trends continue, we estimate early stage investments in 2016 to come in clearly below the prior three years.
Exhibit 11: Gross Capital Invested and Number Of Deals (TTM)
Source: NVCA, Pitchbook, SharesPost Research
Other key highlights from past six year trends include:
Dollars are up since Great Recession, but declining recently.
During 2009-10, roughly $4B of capital raised by US-based private tech companies came via small deal sizes—those below $10MM. Small deal sizes translated to 38% of all VC invested capital in private US-based tech companies. Over the past five years, this has grown to roughly $7B invested via sub-$10MM deals per year, translating to 11%, six-year CAGR, which is below the overall VC industry growth rate of 25-30% per year. Effectively, the proportion of VC capital invested via early stage deals has dropped from 38% of VC invested dollars to 16% of total dollars invested as the overall VC investment market has grown at more than 25% per year over the past six years. For context, according to NVCA data, first-time financing (companies receiving venture capital for the first time) dollars decreased 31% in Q1 and 8% in Q2. And, dollars invested in Seed stage companies declined 10% in Q1 and 5% in Q2 whereas early-stage investment declined 18% in Q1 and 14% in Q2 (measured in terms of invested dollars).
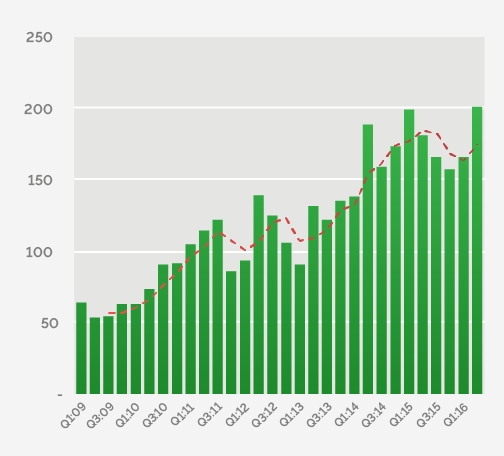
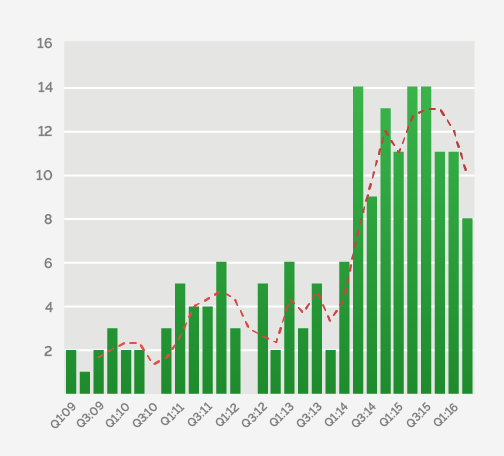
Number of deals peaked in Q1:15; double-digit percentage declines since then.
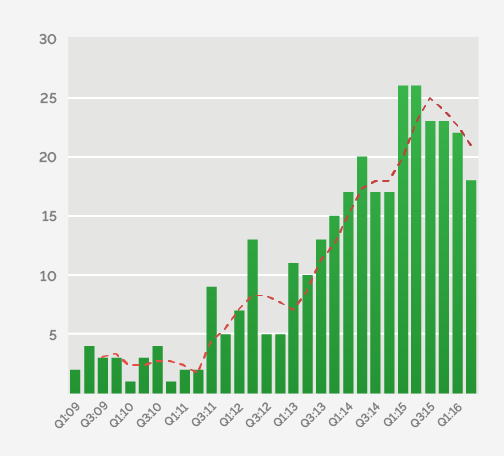
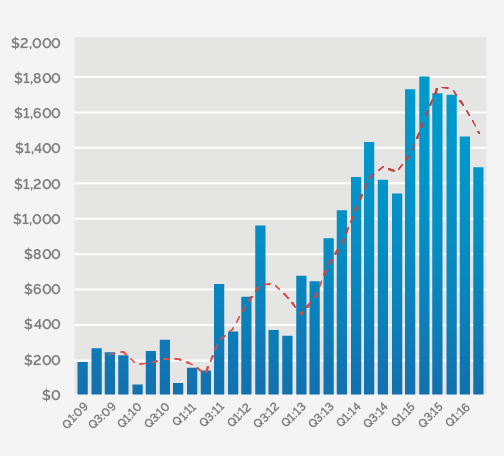
According to Pitchbook, roughly 1,300 deals with capital raised below $10MM were completed during 2009. This accounted for roughly 84% of all private tech investments in 2009. Over the past five years or so, the number of such early-stage deals in US-based private tech companies has increased steadily at 25% per year. And, over the past 12 months, approximately 3,800 deals have been completed. The number of early-stage deals has steadily declined over the past 12 months from its peak of roughly 5,500 deals completed during 2015.
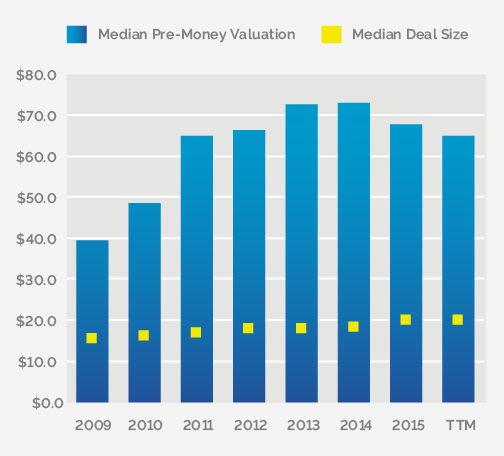
Median pre-money valuation staying between $7-9MM.
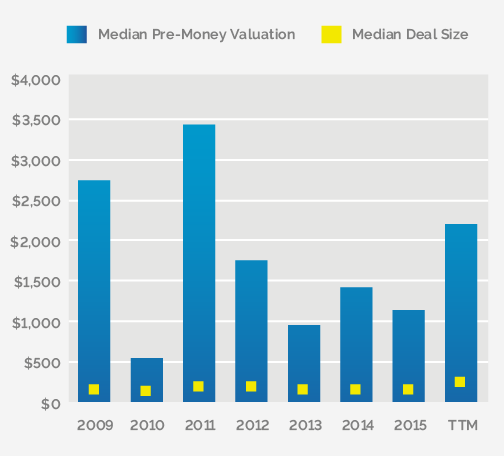
As highlighted in the chart below, median pre-money valuation for deals below $10MM has stayed largely flattish between $7MM and $9MM. And, deal sizes have hovered around $1MM and have stayed largely within a tight range around $1MM. While median pre-money valuation seems to have tweaked towards the high-end of the range in 2015, we’d highlight that 2016 YTD trends indicate that pre-money valuation levels for Seed/Series A investments have started to soften vs. 2014-15 levels.
Exhibit 12: Annual Trends For $0-10MM Rounds—Gross $MM Invested and No. Of Inhvestments
Source: NVCA, Pitchbook, SharesPost Research; $ in millions
Exhibit 13: Annual Trends For $0-10MM Rounds—Median Pre-Money Valuation and Deal Size
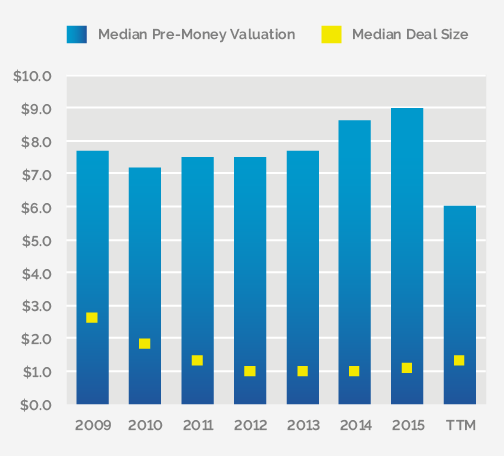
Source: NVCA, Pitchbook, SharesPost Research; $ in millions
Exhibit 14: Early Stage (<$10MM)—Number of Investments slowing down past 18 months
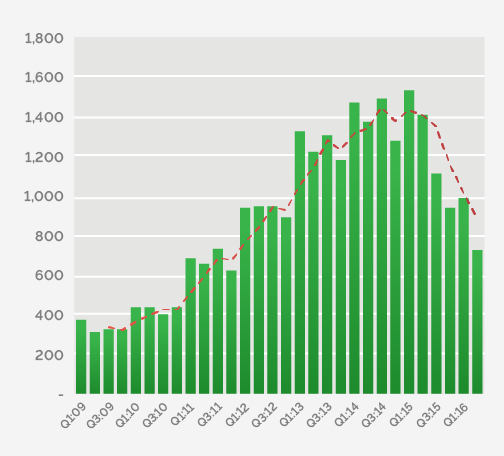
Source: NVCA, Pitchbook, SharesPost Research
Exhibit 15: Early Stage (<$10MM)—Gross Capital Invested Staying Around $1.5B Per Quarter
Source: NVCA, Pitchbook, SharesPost Research; $ in millions
Medium VC deals ($10-50MM). Deals and dollars staying high but softening
The headline there is that late-stage investors appear to be in a wait-and-watch mode, although early signs indicate that mid-stage deals are gradually following the trends seen in early-stage VC activity. Overall dollar amount continues to grow, albeit at a slower pace, whereas the number of deals has decelerated consistently and declined in 1H:16.
Exhibit 16: Gross Capital Invested and Number Of Deals (TTM)
Source: NVCA, Pitchbook, SharesPost Research
Other key highlights from trends over the past six years include:
Mid-stage dollars growing but decelerating.
In 2010, approximately $4.3B of capital raised by US-based private tech companies came via deal sizes ranging between $10MM and $50MM. We’d characterize these deals as largely around Series A, Series B, or Series C investments in private tech companies. About 5-6 years ago, such deals accounted for 40-42% of all VC invested capital in private US-based tech companies. Over the past twelve months, roughly $15.7B in capital was raised via such mid-stage deals, translating to 24%, six-year CAGR, which is slightly below the 28% growth in overall VC dollars invested. Effectively, the proportion of VC capital invested via mid-stage stage deals has trended lower from a range of 40-42% in 2009-10 to 30-35% in the past 12 months. On a YTD basis, roughly $8.4B in capital has been invested via mid-stage deals, which is largely in line with 1H:15 levels. However, we’d highlight that this stage of investing experienced incremental weakness in 2H:15, leading to lower valuations later this year. In other words, 2H:16 trends might return to accelerating growth in capital invested via this stage of investment. This may mask the underlying weakness in a long-term declining trend.
Number of deals declining in 1H:16.
Mid-stage deals have accounted for roughly 10-15% of all private tech investments over the past six years. This proportion has stayed relatively flat within this range, although we’d note that the proportion of deals that were mid-sized gradually declined from 15-16% of the total in 2009 to 10-11% in 2013. And, over the past few years, this proportion has gradually increased back to a range of 14-15%. All in, the number of mid-sized deals has gradually increased from roughly 300-400 deals per year in 2010-11 to 700-ish in 2015, translating to 20%, six-year CAGR. On a YTD basis, there have been more than 350 deals in this mid-stage segment, which is roughly in line with the prior 4-6 quarters.
Median pre-money valuation staying between $65-75MM.
As highlighted in the chart below, median pre-money valuation for deals between $10-50MM has staying largely flat between $65MM and $75MM since 2014. And, deal sizes tend to hover around $15-20MM and have stayed largely within a tight range. We’d note that median, pre-money valuation seems to have ticked lower over the past couple of years, while deal sizes have trended toward the high-end of their historic range.
We’d acknowledge that a recent presentation by Andreessen Horowitz’s Scott Kupor assumed a $40MM threshold for true “late-stage” companies. We decided to stick with a $50MM threshold largely for two reasons: First, it is a nice round number. Second, we came across a fairly large number of VC deals in the range of $25-45MM deal size. In addition, we were simply trying to make a distinction between typical Angel/Series A deals, Series B/C/D deals, and subsequent Series E/F/G deals for private tech companies. We observed that majority of angel deals were under $2MM in deal size, Series A were in the range of $2-10MM, and so on and so forth.
Exhibit 17: Annual Trends In Gross $MM Invested and No. Of Investments
Source: NVCA, Pitchbook, SharesPost Research; $ in millions
Exhibit 18: Annual Trends In Median Pre-Money Valuation and Deal Size
Source: NVCA, Pitchbook, SharesPost Research; $ in millions
Exhibit 19: Mid-Stage ($10-50MM)—Number of Investments—Mix-Shift Continues Toward Mid-Stage
Source: NVCA, Pitchbook, SharesPost Research
Exhibit 20: Mid-Stage ($10-50MM)—Gross Capital Invested Rising Above $4B Per Quarter
Source: NVCA, Pitchbook, SharesPost Research; $ in millions
Large VC Deals ($50-100MM)—Remains high with early hints of slowdown
The headline here is that traditional late-stage deals with ticket sizes between $50-100MM remain the smallest segment (in terms of dollar amount), with roughly $5.5-6B in annual dollar investments—10-15% of total gross dollars invested. But, such small-ticket, late-stage deals have had a fairly consistent 30% plus growth rate during the past six years, both in number of deals as well as gross dollars invested. This is likely benefiting from both mid-stage and very late-stage investors.
Growth in aggregate dollars and market share.
Traditionally, VC deals from $50MM to $100MM were regarded as late-stage growth equity investments. However, given the ongoing changes in the private tech investment landscape, we’d characterize deals with ticket sizes of $50-100MM as “small-ticket, late-stage” deals. During, 2009-2010, US-based private tech companies raised roughly $700-900MM per year via such deals. This translated to roughly 6-9% of overall VC investment. Over the past five years, the amount of capital invested via $50-100MM has increased 7-8x to $7B in 2015. This translates to a 41%, six-year CAGR. All in, the proportion of VC’s invested capital allocated to such small-ticket, late-stage deals rose from 6-9% in 2009-10 to 13-15% over the past 12 months.
Number of deals rising but hints of slowdown in 1H:16.
Traditionally, VC deals from $50MM to $100MM were regarded as late-stage growth equity investments. During, 2009-2010, US-based private tech companies completed 10-12 deals per year. In other words, fewer than 1% of all VC deals were in this range. Over the past few years, the deal velocity for such $50-100MM tickets has increased 7-8x to almost 100 deals completed during 2015. While such deals account for less than 1.6% of all VC funding, the absolute number of deals completed in this segment has grown at more than 40% per year (on a six-year CAGR)—among the fastest and most consistent growth in deal volume across all deal size segments.
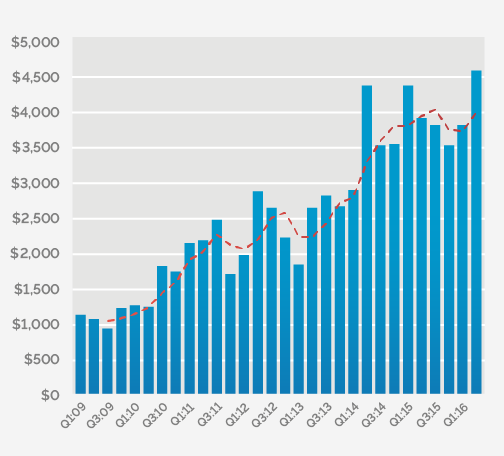
Exhibit 21: Gross $MM Invested and No. Of Investments Via $50-100MM Rounds
Source: NVCA, Pitchbook, SharesPost Research; $ in millions
Exhibit 22: Median Pre-Money Valuation and Deal Size For $50-100MM Rounds
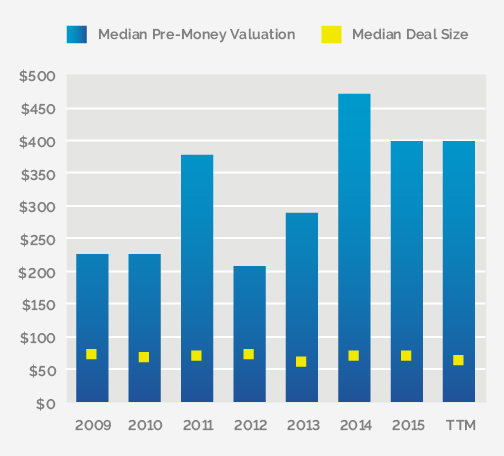
Source: NVCA, Pitchbook, SharesPost Research; $ in millions
Exhibit 23: Number of Investments—Slowing Down But Still High at 15-20 Per Quarter
Source: NVCA, Pitchbook, SharesPost Research
Exhibit 24: Gross Dollar Amount Invested—Between $1-2B Per Quarter
Source: NVCA, Pitchbook, SharesPost Research; $ in millions
Mega VC Deals $100MM+—Private IPOs rising as giga $500MM deals emerge
The headline here is that late-stage mega deals exceeding $100MM (a.k.a. Private IPOs) emerged during 2013-2014. They continue to grow in both the number of deals and dollars invested. Private IPO deal velocity peaked around 15 per quarter during Q3:15, and since then, has gradually tweaked lower YTD. Coincidentally, we have witnessed the emergence of the $500MM giga-round, accounting for 25% of dollar amount invested in past 18 months.
While the overall landscape of VC-backed private tech companies continues to evolve non-stop, we believe the most remarkable changes has been the emergence of mega-deals. Among the key trends we identified:
Private IPOs peaked for 18-months from June 2014 thru Oct 2015.
From 2009 through 2011, there were roughly 1-2 deals per quarter with deal sizes exceeding $100MM. This deal frequency has jumped to more than 10 deals per quarter during past eight quarters. Looking at the trend over the past 8-10 quarters, several of paradigm shifts have taken place. There appears to be a clear acceleration in deal velocity starting 1H:14, and this late-stage deal velocity peaked during Q3:15 (versus early stage around Q2:14 and mid-stage around Q2:15). During the 18-month period from Q2:14 to Q3:15, there were roughly 75 deals completed of more than $100MM. However, since Q3:15, the number of deals per quarter has slowed on a Q/Q basis. Nonetheless, we’d highlight that 2016 YTD annualized run rate of approximately 16 late-stage mega deals is still significantly above the levels in 2010 through 2013. While VCs seem to have gotten increasingly cautious about allocating dry powder to early stage companies, we believe late-stage investments continue to hum along with few hiccups.
Gross dollars invested have increased 15x vs. 2009 levels.
Capital raised by private tech companies via such mega deals has increased from less than $1.5B per year during 2009 and 2010 to more than $22B in the most recent trailing twelve months, translating to a 15x growth. And, the proportion of private tech capital being invested via such mega deals has increased from less than 12% in 2009-10 to more than 40% in the past twelve months (from Q3 2015 to Q2 2016). What’s more interesting is that mega VC deals have accounted for more than 70% of growth in the amount of dollars invested in private tech companies over the past three years. In other words, if we exclude $100MM-plus deals, VC dollars would have increased at a 14% CAGR since 2013. On the other hand, dollars invested via $100MM deals have increased at a 130% year-on-year CAGR.
Exhibit 25: $100MM-Plus Rounds—Gross Dollar Capital Invested and No. Of Investments
Source: NVCA, Pitchbook, SharesPost Research; $ in millions
Exhibit 26: Median Pre-Money Valuation and Deal Sizes for $100MM-plus deals
Source: NVCA, Pitchbook, SharesPost Research; $ in millions
Exhibit 27: Late-Stage (>$50MM)—Number of Investments Slowing Down But Still High
Source: NVCA, Pitchbook, SharesPost Research
Exhibit 28: Gross Dollar Amount Invested In $100MM+ Private IPOs
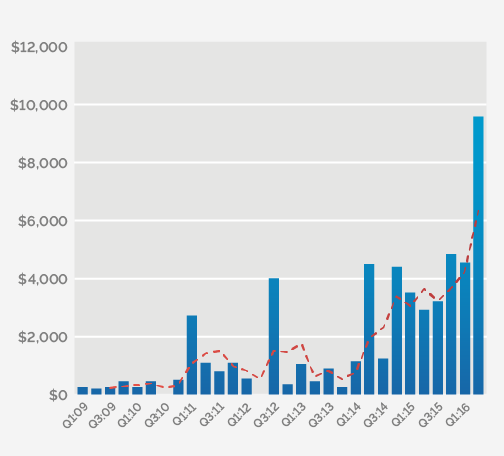
Source: NVCA, Pitchbook, SharesPost Research; $ in millions
Giga $500MM deals already account for 25% of dollars since Q4:14.
Recall that Benchmark’s Bill Gurley famously blogged about “FOMO among investors driving Private IPOs.” (Investors Beware: Today’s $100M+ Late-Stage Private Rounds Are Very Different from an IPO). Coincidentally, we have witnessed the emergence of the $500MM round. This new phenomenon implies greater focus on and investor/capital concentration to mature, very late-stage private tech companies. This is largely similar to recent performance of large cap public tech companies viz. big getting bigger, winners take “most.” We’d note that there have been 18 such mega $500MM+ financing rounds worth $21.5B since late 2014, accounting for 25% of capital invested in US-based private tech companies.
Excluding mega deals to mega-cap private tech companies, we estimate gross dollars raised by U.S.-based private tech companies have declined 10% in 1H:16 on a year-on-year basis. We think recent trends in late-stage VC investing mimic the trends observed in early-stage investing starting early 2014. This asset class may well likely experience another “reversion to mean” period over the next couple of years. We’d expect the ongoing reconciliation to continue as VC sentiment pendulum continues to swing from “Fear Of Missing Out” (FOMO) to “Fear Of Jumping In” (FOJI) across all stages/deal sizes. We’d characterize such an imminent decline in invested capital as a healthy return to a balance in demand and supply. Nonetheless, as we highlight in our upcoming deep-dive into VC fundraising trends, we think a significant amount of money is sitting on the sidelines seeking growth investment opportunities!
Exhibit 29: $500MM-Plus Rounds Accounted For Almost All Growth in Dollars Since Sep 2014
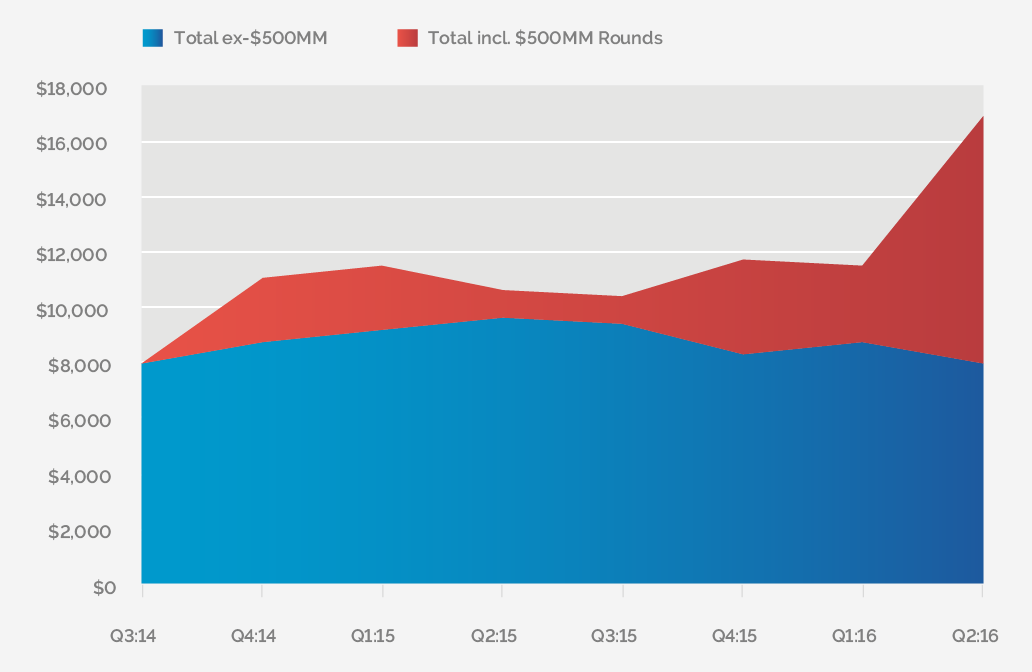
Source: NVCA, Pitchbook, SharesPost Research; $ in millions
Quick note about data sources, assumptions, and caveats
While analyzing macro-level data for VC industry with specific focus on technology companies, we relied on data available from a variety of sources. This included PitchBook, as well as publicly available datasets prepared by the National Venture Capital Associations (NVCA), and Jay Ritter’s blog on IPO trends. To analyze and draw conclusions from data, we made several simplifying assumptions:
We noticed that several recent, late-stage private tech deals were not categorized as “venture capital” investments by public databases. However, we added such deals into our analysis.
In this post, we have assumed certain thresholds of funding or fundraises to indicate certain stage of company development or investment focus of a VC fund. We acknowledge that lines blur around these thresholds, and hence we haven’t relied on precise numbers within a range or basket to draw conclusions.
While analyzing macro-level data for the VC industry with specific focus on technology companies, we relied on data available on a variety of sources. This included PitchBook, Preqin as well as publicly available datasets prepared by Crunchbase, NVCA/Thomson Reuters, Dow Jones Venture Source, and Jay Ritter’s blog on IPO trends. In order to analyze and draw conclusions from data, we made several simplifying assumptions and tradeoffs. Below we have attempted to provide a list of caveats and assumptions in our analysis. While we have fairly high level of confidence in the big picture conclusions in this post, we’d highlight that relying on specific period or category data may not lead to accurate conclusions.
We gathered data for software, media and entertainment, telco, IT services, etc. According to NVCA, VC investors have done about 2,000 to 3,000 new investments in these sectors every year in U.S. Noteworthy outliers have been about 2000, when there were more than 5,000 net new investments, and 2009, with fewer than 1,500 tech or related investments. Over the past few years, the run rate has clearly ticked higher to about 3,000 investments per year.
Per Preqin, approx. 8,000 to 10,000 VC deals are completed globally across all sectors every year. Roughly 60-70% of these deals are categorized as Internet, Software, and other related IT companies. And, roughly 30-40% of VC investments are completed in U.S., and rest in Europe and APAC. This proportion has been slowly declining over the past 5-7 years.
We observed that there is a fundamental difference in the way industry data providers define or count “deals” or “investments” in tech sectors within venture capital. For instance, NVCA tracks roughly 4,400 investments per year in U.S. across all sectors, Preqin reported approx. 10,000 deals globally, whereas Pitchbook tracked approx. 8,000. We ended up making simplifying assumptions to gross up the number of VC investments globally from Thomson Reuters data (NVCA), by assuming a general shift toward international markets over the past 6-7 years.