 Print
PrintCagatay Koç is a principal and Joseph T. Breedlove is a manager at Cornerstone Research. This post is based on a Cornerstone publication authored by Mr. Koç and Mr. Breedlove.
This post is based on the second in a series of annual Cornerstone Research reports describing merger investigations and enforcement activity at the Bureau of Competition at the Federal Trade Commission (FTC) and the Antitrust Division of the Department of Justice (DOJ). The analysis is based on data provided in the last 10 joint FTC/DOJ annual reports to Congress pursuant to the Hart-Scott-Rodino (HSR) Antitrust Improvements Act of 1976 (HSR Reports) for fiscal years 2006 through 2015. [1]
This post provides a context for evaluating possible outcomes of individual cases as they proceed through the regulatory process.
This post looks at the current activity levels and the historical trends at all stages of merger investigations—filings, clearances, second requests, and challenges. In addition, it includes analyses of merger enforcement by size, industry, and agency.
To provide further insight into industry trends, the Enforcement Focus Indicator (EFI) reports the share of second requests in an industry sector relative to its share of transactions.
Executive Summary
Transactions, Clearances, and Second Requests
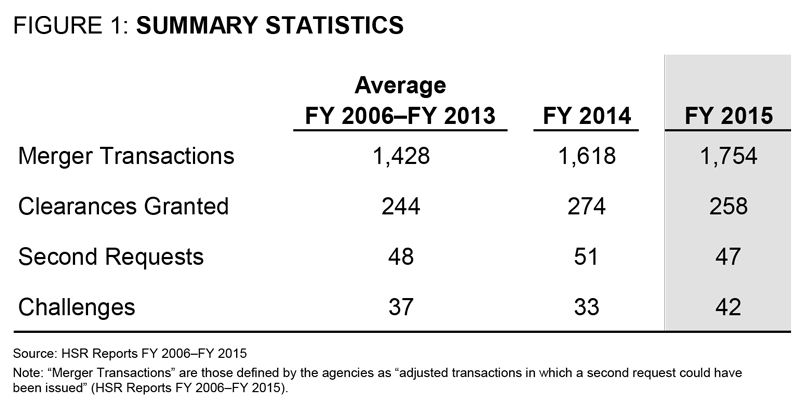
- The number of transactions submitted for review in FY 2015 continued the increase seen in recent years. The 1,754 reported transactions represent the highest total since FY 2007. [2]
- The number of reported transactions for which the agencies received clearance to conduct a preliminary investigation (clearances) decreased in FY 2015.
- The number of second requests declined from 51 in FY 2014 to 47 in FY 2015. As a percentage of cleared transactions, second requests remained stable, declining only slightly from 18.6 percent to 18.2 percent.
- Large mergers dominated second requests in FY 2015. Transactions exceeding $1 billion accounted for 66 percent of all second requests, compared to 49 percent in the previous fiscal year.
Enforcement Focus by Industry
- The Transportation, Retail Trade, and Pharmaceuticals industries were a focus of second requests. Mergers in these industries had the largest shares of second requests relative to their shares of reported transactions in FY 2015 (Enforcement Focus Indicator—EFI).
- Health Services, Pharmaceuticals, and Wholesale Trade had the largest shares of clearances relative to their shares of reported transactions in FY 2015 (early stage EFI).
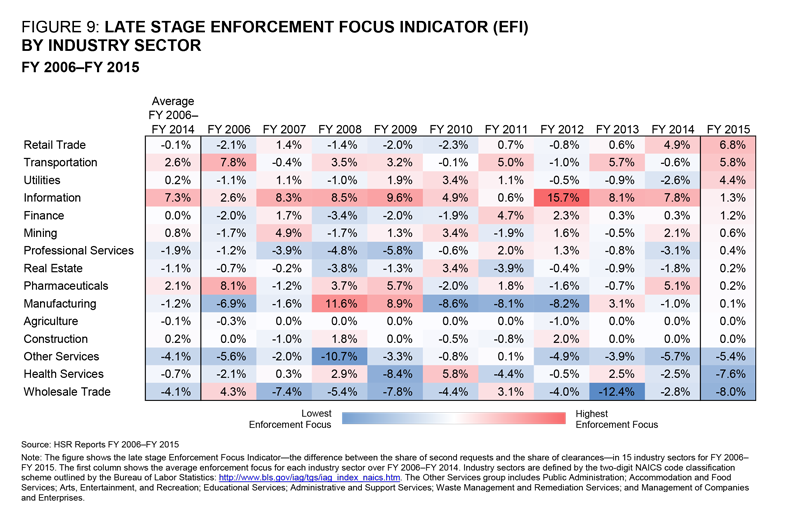
- Retail Trade, Transportation, and Utilities had the largest shares of second requests relative to their shares of clearances in FY 2015 (late stage EFI).
Challenges
- The agencies challenged 42 mergers in FY 2015.
- Most of the challenges (60 percent) were resolved by consent orders/decrees. The parties abandoned or restructured their transactions in 33 percent of the challenges, and court proceedings were initiated in 7 percent.
- Consistent with historical averages over the previous nine fiscal years, the FTC received more clearances for investigation in FY 2015 than the DOJ, but the DOJ was more likely to issue second requests and to challenge mergers.
Key Trends
- Although the number of reported transactions has fluctuated over time, the last three fiscal years have seen a steady increase from 1,286 in FY 2013 to 1,754 in FY 2015.
- The share of reported transactions cleared in FY 2015 was one of the three lowest in the past 10 fiscal years.
- Large transactions (more than $1 billion) have received the highest share of second requests in each of the last five fiscal years.
- Retail Trade, Pharmaceuticals, Manufacturing, and Health Services each continued to be a focus of enforcement in FY 2015. All of these sectors except Retail Trade have had a positive average enforcement focus over the previous nine fiscal years. Pharmaceuticals is the only sector that has had a positive enforcement focus in each of the last 10 fiscal years.
- While the Information sector has had a positive enforcement focus over the last three fiscal years, the sector had a negative enforcement focus in FY 2015.
- The Utilities sector had the fourth-largest enforcement focus across all industries in FY 2015, a change from its negative enforcement focus over the previous three fiscal years.
Reported Transactions, Clearances, and Second Requests
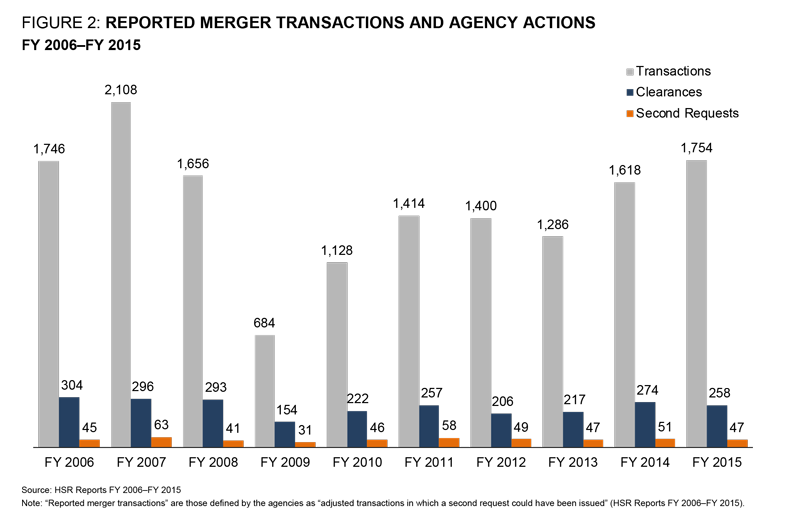
- There were 1,754 transactions reported in FY 2015, an increase of approximately 8 percent from the previous fiscal year.
- Since FY 2009, the number of reported transactions has generally increased. FY 2015 recorded the second highest number of transactions since FY 2007.
- Despite the rise in reported transactions in FY 2015, the number of clearances declined. In FY 2015, 258 transactions were cleared to the FTC or DOJ for further investigation, compared to 274 in FY 2014. [3]
- The number of second requests also declined. In FY 2015, 47 transactions received second requests, compared to 51 in FY 2014.
- Clearances and second requests have generally fluctuated with the number of transactions.
Likelihood of Clearance And Second Request [4]
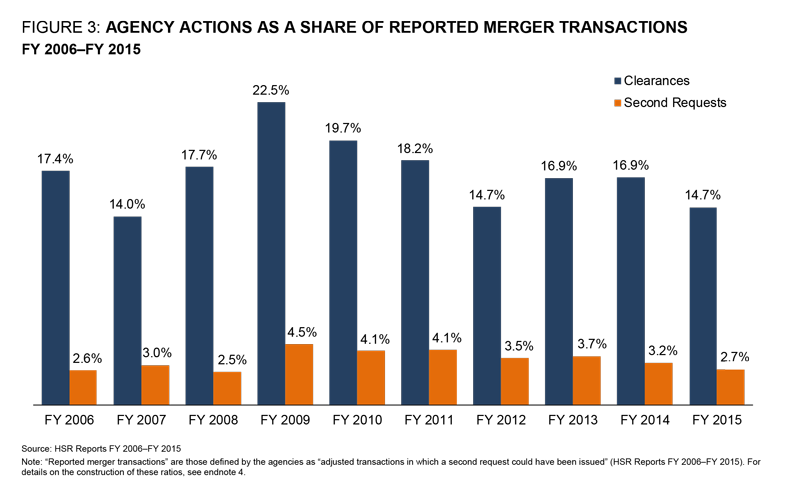
- In FY 2015, 14.7 percent of reported transactions received clearance for investigation. This is one of the three lowest clearance percentages since FY 2006.
- Since FY 2006, on average, 17.3 percent of all reported transactions have been cleared to one of the antitrust agencies for further investigation.
- The share of reported transactions receiving second requests in FY 2015 was 2.7 percent, down from 3.2 percent in FY 2014.
- Over the period FY 2006 through FY 2015, approximately 3.4 percent of all reported transactions have been issued second requests.
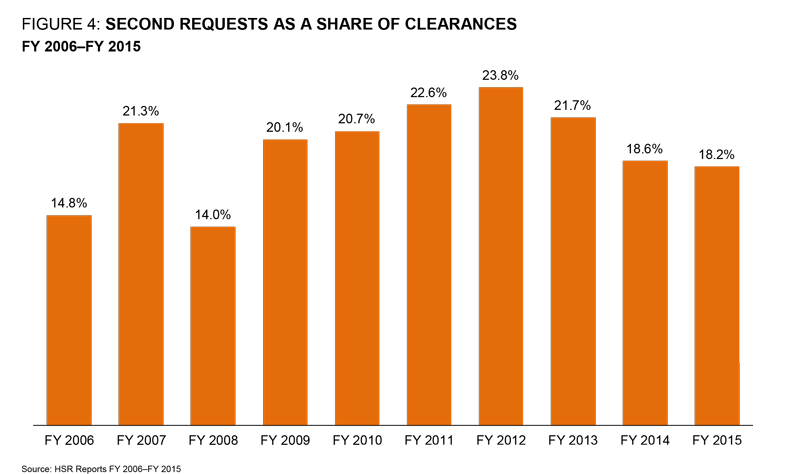
- In FY 2015, 18.2 percent of cleared transactions received second requests, slightly lower than the 18.6 percent in FY 2014.
- In the past 10 fiscal years, on average, 19.6 percent of clearances received second requests.
- In both FY 2015 and FY 2014, the percentage of second requests relative to clearances was below the historical average over the period FY 2006 through FY 2013.
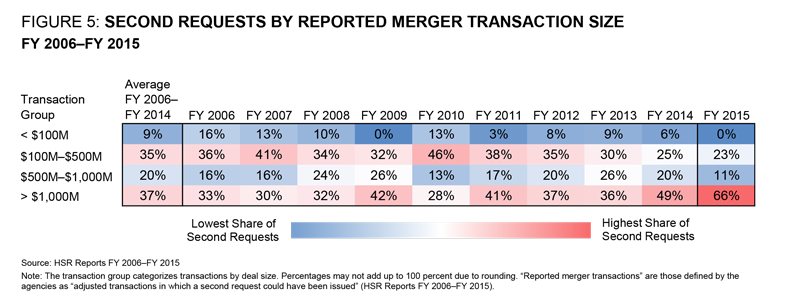
Second Requests by Transaction Size
- Second requests were skewed toward very large transactions in FY 2015, more so than any other year in the analysis:
- Transactions valued at less than $100 million had no second requests in FY 2015. This has happened only one other time in the last 10 fiscal years, in 2009.
- Transactions between $100 million and $500 million represented 23 percent of second requests.
- Transactions between $500 million and $1 billion accounted for 11 percent of second requests
- Transactions valued at more than $1 billion represented 66 percent of all second requests.
- The percentage of second requests for transactions between $100 million and $1 billion was at the lowest level in the last 10 fiscal years.
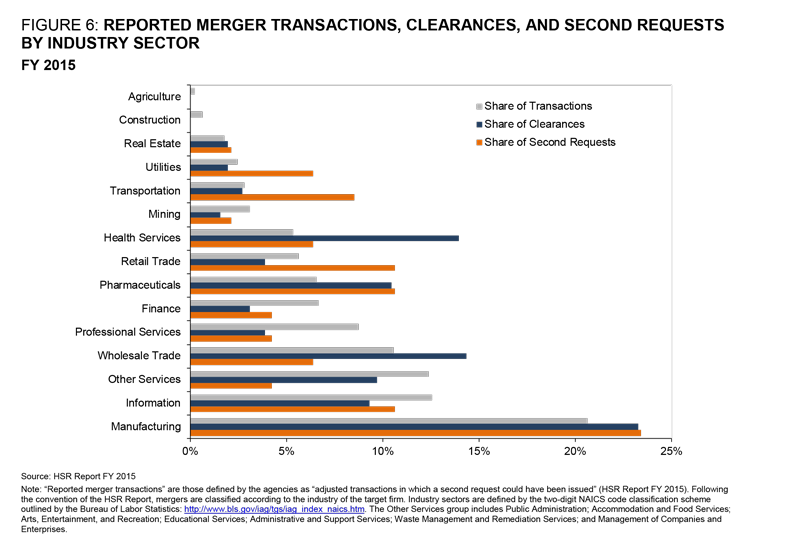
Transactions and Second Requests by Industry Sector
- In FY 2015, Manufacturing accounted for the largest share of reported transactions (20.6 percent) and second requests (23.4 percent). Manufacturing has had the largest average annual share of both transactions and second requests over the previous nine fiscal years.
- In FY 2015, the Information sector accounted for the second-largest share of transactions (12.5 percent) and was tied for the second-largest share of second requests (10.6 percent). Information has ranked third in average annual share of transactions over the previous nine fiscal years.
- In FY 2015, Other Services [5] had the third-largest share of transactions (12.4 percent) and accounted for 4.3 percent of all second requests. Other Services has had the second-largest average annual share of transactions over the previous nine fiscal years.
Enforcement Focus by Industry Sector
The Enforcement Focus Indicator (EFI) is the percentage of second requests in the sector minus the percentage of transactions in the sector.
A positive EFI indicates that the industry is overrepresented among second requests; a negative EFI indicates that the industry is underrepresented among second requests. [6]
In addition, this post measures:
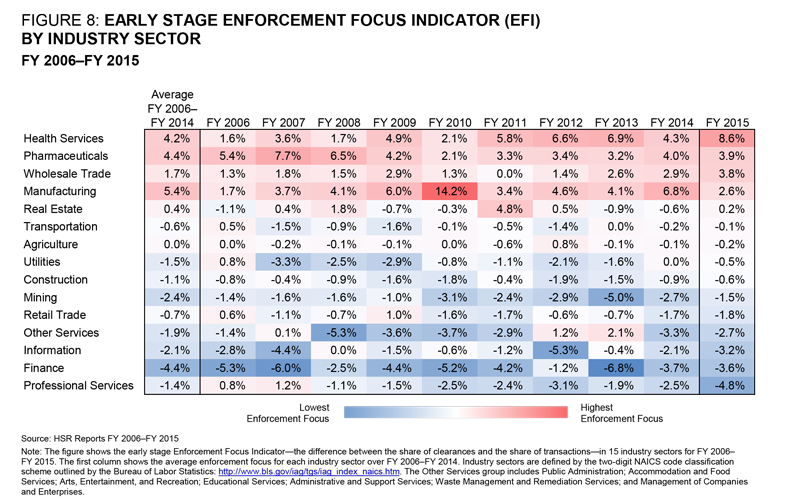
- Early stage EFI, the percentage of clearances in the sector minus the percentage of transactions in the sector.
- Late stage EFI, the percentage of second requests in the sector minus the percentage of clearances in the sector.
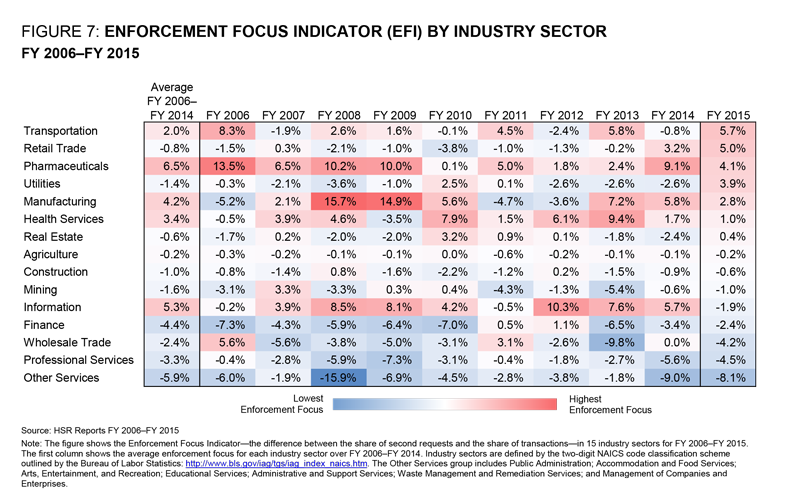
- In FY 2015, the Transportation sector had the largest EFI, accounting for 2.8 percent of all transactions but more than 8.5 percent of all second requests.
- Retail Trade had the second-largest EFI in FY 2015, continuing the increase seen in the previous fiscal year. This sector made up 5.6 percent of all transactions but received 10.6 percent of all second requests.
- The sector with the highest EFI in FY 2014, Pharmaceuticals, had the third-largest enforcement focus in FY 2015. This sector has been receiving disproportionately higher shares of second requests in the last 10 fiscal years.
- Utilities, a sector with negative EFIs in the last three fiscal years, had the fourth-largest EFI in FY 2015.
- The industry sectors most underrepresented among second requests in FY 2015 were Other Services, Professional Services, Wholesale Trade, and Finance. Each had a negative EFI and has been underrepresented, on average, over the period FY 2006 through FY 2014.
Early Stage Enforcement Focus by Industry Sector
- In FY 2015, Health Services had its highest early stage EFI. This sector accounted for 5.4 percent of all transactions but 14 percent of all clearances.
- Pharmaceuticals had the second-largest early stage EFI. This industry sector has received more than its proportionate share of clearances in each of the last 10 fiscal years.
- The Wholesale Trade sector had the third-largest early stage EFI. This sector has also been receiving disproportionately higher shares of clearances over the last 10 fiscal years.
- The industry sectors most underrepresented among clearances in FY 2015 were Professional Services, Finance, and Information. Finance, Construction, and Mining are the only sectors that have had a negative early stage EFI in every year.
Late Stage Enforcement Focus by Industry Sector
- In FY 2015, the Retail Trade sector had the largest late stage EFI. This sector accounted for 10.6 percent of all second requests but 3.9 percent of clearances.
- The Transportation sector had the second-largest late stage EFI in FY 2015.
- In FY 2015, Utilities had the third-largest late stage EFI—the highest late stage EFI in this sector in the last 10 fiscal years.
- Consistent with its historical average over the period FY 2006 through FY 2014, the Information sector was disproportionately more likely to receive a second request among cleared transactions in FY 2015. This industry has led late stage EFI for five of the past 10 fiscal years.
- The most underrepresented industry sectors in FY 2015 were Wholesale Trade, Health Services, and Other Services.
Merger Challenges
- The agencies challenged 42 mergers in FY 2015 compared to 33 in FY 2014; however, the percentage of challenges was the same as the historical average of 2.2 percent from FY 2006 through FY 2014.
- Of the 42 challenges in FY 2015, 25 were resolved by consent orders/decrees, 14 were resolved by the parties abandoning or restructuring their transactions, and court proceedings were initiated for three of the challenges (Electrolux/GE, Sysco/USF Holding, and Steris/Synergy Health). [7]
- Between FY 2006 and FY 2015, the number of challenges has fluctuated between 31 and 44, with an annual average of 37.
- The percentage of challenges resulting in consent orders/decrees exceeded 70 percent in FY 2008 and FY 2010 but has remained at relatively lower levels since FY 2011.
- The fraction of challenges resulting in court proceedings has varied over the last 10 fiscal years—from 0 percent in FY 2006 to 18 percent in FY 2013.

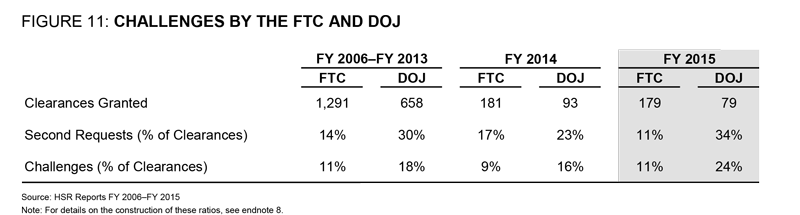
Merger Challenges by Agency
- In FY 2015, the FTC received approximately twice as many clearances as the DOJ (179 versus 79), consistent with the historical average over the period FY 2006 through FY 2014.
- The FTC converted 11 percent of FY 2015 clearances into second requests while the DOJ converted 34 percent.
- In FY 2015, the FTC challenged 11 percent of its clearances.
- The DOJ continued to challenge a larger number of mergers it investigates. In FY 2015, it challenged 24 percent of those it was cleared to pursue—more than twice as many as the FTC. [8]
- Although the DOJ has received fewer clearances over the period FY 2006 through FY 2015 than the FTC, the DOJ has been converting larger percentages into second requests and challenges.
Appendix: Merger Review Overview
Filing
The parties to a proposed merger transaction must file specified information about the transaction with the antitrust agencies for any transaction with a value in excess of the thresholds defined in the Hart-Scott-Rodino Antitrust Improvements Act of 1976. The antitrust agencies then have an initial 30 days (15 days for cash tenders or bankruptcies) to investigate whether the transaction might harm competition. The merging parties may not consummate the transaction during this waiting period.
Clearance
Staff from both the FTC and DOJ conduct a preliminary review of the transaction. If either agency believes the transaction warrants additional investigation, a clearance process is followed to determine which agency will conduct it. Which agency is granted clearance to proceed with the review is determined based on the industry of the merging firms and historical experience.
Second Request
By the end of the initial 30-day waiting period, the investigating agency must decide whether to issue a second request to the parties asking them to provide additional documents and information. The request may require substantial disclosure of company data and documents. If a second request is issued, the merging parties take the time they need to comply with it. The merger cannot be consummated before the parties are in substantial compliance with the second request. If no second request is issued, the parties are free to consummate the merger at the end of the initial 30-day period.
Challenges
Once the parties have complied with the second request, the investigating agency has 30 days (10 days for cash tenders or bankruptcies) to decide whether to challenge the transaction. A challenged merger might proceed if the parties and the agency can agree on a modification to the proposed transaction that would remedy the competitive issue perceived by the agency; the merger may result in litigation if they cannot. If no action is taken by the agency, the parties are free to consummate the merger after the post-compliance waiting period expires.
Endnotes
1The HSR Reports are released to the public with a significant lag. The FY 2015 HSR Report was published on August 1, 2016. The federal government’s fiscal year runs from October 1 of the prior year through September 30 of the current year.(go back)
2Throughout this post, the term “reported merger transactions” or, simply, “transactions,” refers to what the HSR Reports describe as “adjusted transactions in which a second request could have been issued.” In addition to adjusted transactions, the HSR Reports also include information on filings that could be different from transactions for a number of technical reasons, including that filings could be withdrawn before any agency action. Because this post focuses on how the number of agency actions compares to the number of transactions on which the agencies could have acted, “adjusted transactions” are more relevant than filings.(go back)
3Whether to request clearance or not for any particular proposed transaction is at the discretion of the antitrust agencies. A reduction in clearances relative to transactions could reflect a change in case mix, that is, fewer mergers being proposed that require additional investigation beyond an initial review of public information and the merger filing. This could be because the two companies proposing to merge are not competitors or that the transaction would not lead to competitive harm. A reduction in clearances relative to transactions could also reflect a change in the resources available to the agencies to investigate transactions. However, previous research has found no significant relationship between workload and enforcement activity at the FTC in the period 1996 through 2003. See Malcolm B. Coate and Shawn W. Ulrick, “Transparency at the Federal Trade Commission: The Horizontal Merger Review Process 1996–2003,” Antitrust Law Journal 73, no. 2 (2006): 531–570.(go back)
4Clearances and second requests follow transaction filings with a delay. As a result, a transaction filing toward the end of a fiscal year could be cleared or issued a second request in the next fiscal year. The government’s HSR Reports tabulate transactions, clearances, and second requests in the fiscal year in which they occur. Therefore, the “share” of transactions cleared or receiving a second request could be artificially increased by recording a clearance or second request for a transaction reported toward the end of the prior year, and could be artificially decreased by missing a clearance or second request for a transaction reported toward the end of the current year. There is no reason to believe that one of these biases systematically dominates the other.(go back)
5The following industry groups are aggregated into the Other Services group since these sectors have a relatively small number of second requests: Public Administration; Accommodation and Food Services; Arts, Entertainment, and Recreation; Educational Services; Administrative and Support Services; Waste Management and Remediation Services; and Management of Companies and Enterprises.(go back)
6Two industries with similar enforcement focus indicators may have different reasons for that focus. An industry with a disproportionate share of mega-deals, that is, transactions with values exceeding $1 billion, may have its enforcement focus driven by transaction size. In contrast, an industry with mergers spread uniformly across a range of transaction sizes may have its enforcement focus driven by industry factors. The HSR Reports do not break out second requests by transaction size and industry so the factor driving the enforcement focus for a particular industry is unable to be explained. However, anecdotal evidence suggests that industries such as the pharmaceuticals industry, which has a growing number of mega-deals, may have transaction size as the driving force behind the enforcement focus it receives. For example, according to Bloomberg BNA, the pharmaceutical industry has experienced a “trend of growing through mega-mergers” and that “pharma deals see more frequent challenges than other kinds of deals.” See Eleanor Tyler, “Pharma Deals Under a Microscope at FTC,” Bloomberg BNA, June 7, 2016.(go back)
7In the Steris/Synergy matter, the court denied a preliminary injunction; the FTC then dismissed its complaint. In Sysco/USF Holding, the court granted a preliminary injunction; the parties then abandoned the transaction. In Electrolux/GE, the parties abandoned the transaction after the trial had begun but before a decision had been reached.(go back)
8For any given time period, the percentage of challenges to clearances, although very informative, needs to be interpreted with caution. Some transactions receiving challenges in the current fiscal year may have been cleared in the previous fiscal year. In addition, some of the clearances from the current fiscal year could be challenged in the next fiscal year. In the calculation of challenges as a percentage of clearances, transactions that were consummated prior to the decision to challenge the transaction or transactions whose statuses (i.e., proposed or consummated) were not reported are excluded.(go back)