Print
PrintSubodh Mishra is Managing Director at Institutional Shareholder Services, Inc, G. Kevin Spellman is a Senior Advisor, and Anthony Campagna is Global Director of Fundamental Research at ISS EVA. This post is based on their ISS memorandum. Related research from the Program on Corporate Governance includes Socially Responsible Firms by Alan Ferrell, Hao Liang, and Luc Renneboog (discussed on the Forum here); Social Responsibility Resolutions by Scott Hirst (discussed on the Forum here); and Reconciling Fiduciary Duty and Social Conscience: The Law and Economics of ESG Investing by a Trustee, by Max M. Schanzenbach and Robert H. Sitkoff (discussed on the Forum here).
Summary
- High/favorable ISS ESG Corporate Rating performance is Generally Positively Related to Valuation and Profitability and Negatively Correlated with Volatility
- High/favorable ISS ESG Corporate Rating firms are Good Allocators of Capital
- High/favorable ISS ESG Corporate Rating Performance / High-EVA Margin Stocks tend to Outperform
- High/favorable ISS ESG Corporate Rating Firms Tend to be Less Cyclical and are More Likely to be in the Technology, Health Care, and Consumer Non-Durables Sectors
There appears to be a link between ESG—Environment, Social, and Governance—and financial performance (figure 1). While one can argue that the relationship between ESG and financial performance is perhaps due to the fact that more profitable firms have the resources to invest in areas that positively influence ESG, it could also be that profitability rises as a result of a company better managing its material ESG risks, or it could be a little bit of both. If it is a little bit of both, then this means that good-ESG initiatives drive up financial performance, which then provides the monetary resources to invest to be an even better-ESG firm, which then drives up performance again, and so on.
People may choose not to invest in a firm that has poor ESG, thereby limiting its access to capital and raising its cost of capital. Firms that get in trouble on the environment may be distracted by the regulatory headache (higher costs) and customers may avoid the firm (lowering revenue). If one does not treat employees right, this could lower morale, increase turnover, and therefore lower productivity.

Interest in ESG is growing rapidly and has gained traction amongst corporations, individuals, investors, and institutions.
Corporations
In March 2019, the Global Reporting Initiative noted that two decades ago when it launched its guidelines only a handful of companies disclosed their environmental performance, while now 93% of the world’s largest companies by revenue report ESG information. In Q3 2019, FactSet reported 31 S&P 500 companies citing “ESG” on earnings calls. This is up from 24 in Q2 and 12 in Q1. In Q2 2017, there were only two citations. Interestingly, nine of the firms mentioning ESG in Q3 2019 were from the financial sector, which according to ISS’s ESG ratings, earns lower ESG Performance. Maybe the companies are recognizing the need to change?
Individuals
In a recent survey by Allianz of a nationally representative sample of 1,000 people 18 years or older, it was found that only 15% of Americans recognize the term ESG. While this is low, the majority (79%) like the idea of investing in a company that cares about the issues. While the young generation leads the push to ESG (64% are more likely to make investment decisions on issues they care about), even the older generation (boomers at 42%) are getting on-board. While some may just like the idea that good-ESG companies do good for the world, millennials are more likely to believe that companies that care about social issues have better long-term success.
Data and Other Important Comments
ESG Performance is from Institutional Shareholder Services’ (ISS) ESG Corporate Rating data, EVA metrics are from ISS EVA Investor Express, and return data and other non-EVA financial data are from FactSet. Companies are in the US.
The ESG data is the end of 2013 through March 2019 and return date is through September 2019. US companies less than $250 million in market cap were excluded. The start date is the end of 2013 since we have a good dataset of 534 securities and ISS ESG rating methodology was consistent post 2013. Over time, ISS has been increasing the number of rated securities and by March 2019 the dataset for this study covered 1,196 US securities.
Unless otherwise stated, securities are sorted across the entire universe of ESG rated companies to compute various statistics.
This paper specifically shows that ESG appears to be related with profitability, size, value, volatility and other factors that are correlated with returns. Thus, the paper does not divide returns attributed to each variable (ESG, size, value, volatility, profitability, etc.) on purpose. Since ESG may be the cause of the other characteristics, they may be intrinsically connected, so it does not make sense to separate them into different drivers of returns. Although, for some added information, the paper does review the results of two- and five-way fractiling of ESG Performance and EVA Margin.
ISS ESG Corporate Rating data for ESG Performance (ranges from 0 to 100) includes over 800 indicators of which approximately 100 are applied to each company rating, with approximately 90% industry-specific. Weights for E, S, and G pillars are dependent on the industry. For each industry, five key issues, representing more than 50% of the overall rating, are identified.

Investors and Institutions
If good ESG has cost and revenue advantages as suggested earlier, then this should positively impact investment performance. Perhaps this, along with the younger generation’s push to consider social issues, is driving ESG investing.
- Harvard Business Review reports that in 2006, when the UN-backed Principles for Responsible Investment (PRI) was launched, only 63 investment companies with $6.5 trillion in assets had signed a commitment to incorporate ESG issues into investment decisions. By April 2018, the number was 1,715 and represented $81.7 trillion in assets.
- In an October 2018 Financial Times article, Larry Fink, chairman and CEO of BlackRock, stated “‘We are only at the early stages.‘” Fink estimates that assets in ESG ETFs will grow from $25 billion to $400 billion in a decade.
- The CFA Institute’s position statement on ESG integration includes “The CFA Program curriculum currently teaches that ESG information can often be material or otherwise useful in the investment decision-making process. Understanding ESG information can lead to a better understanding of a company’s complete story (a tile in the whole mosaic). The curriculum does not say that charterholders must consider ESG. However, if an ESG issue is material, it should be considered in the investment process.”
- A host of additional regulatory and voluntary reporting obligations and reporting standards on ESG include, but are not limited to, the Task Force on Climate-related Financial Disclosures (TCFD)—supported by the PRI, Sustainability Accounting Standards Board (SASB), EU Sustainable Finance Initiative, sustainable finance regulation in Canada, Article 173 in France, etc.
ESG investing can be used in a number of ways such as (1) investing in areas to make an impact, (2) excluding companies that do not align with goals, and (3) incorporating ESG into how one looks at each investment. This paper shows that ESG may matter for corporate and investment results. There appears to be a positive relationship between ESG and financial performance and investment returns, so ESG can be used to screen for companies with good financial and investment performance. Thus, it may be material for returns, which if so, according to the CFA Institute’s position, means that it should be considered in the investment process.
Higher ESG Associated with Higher Profitability and Lower Volatility
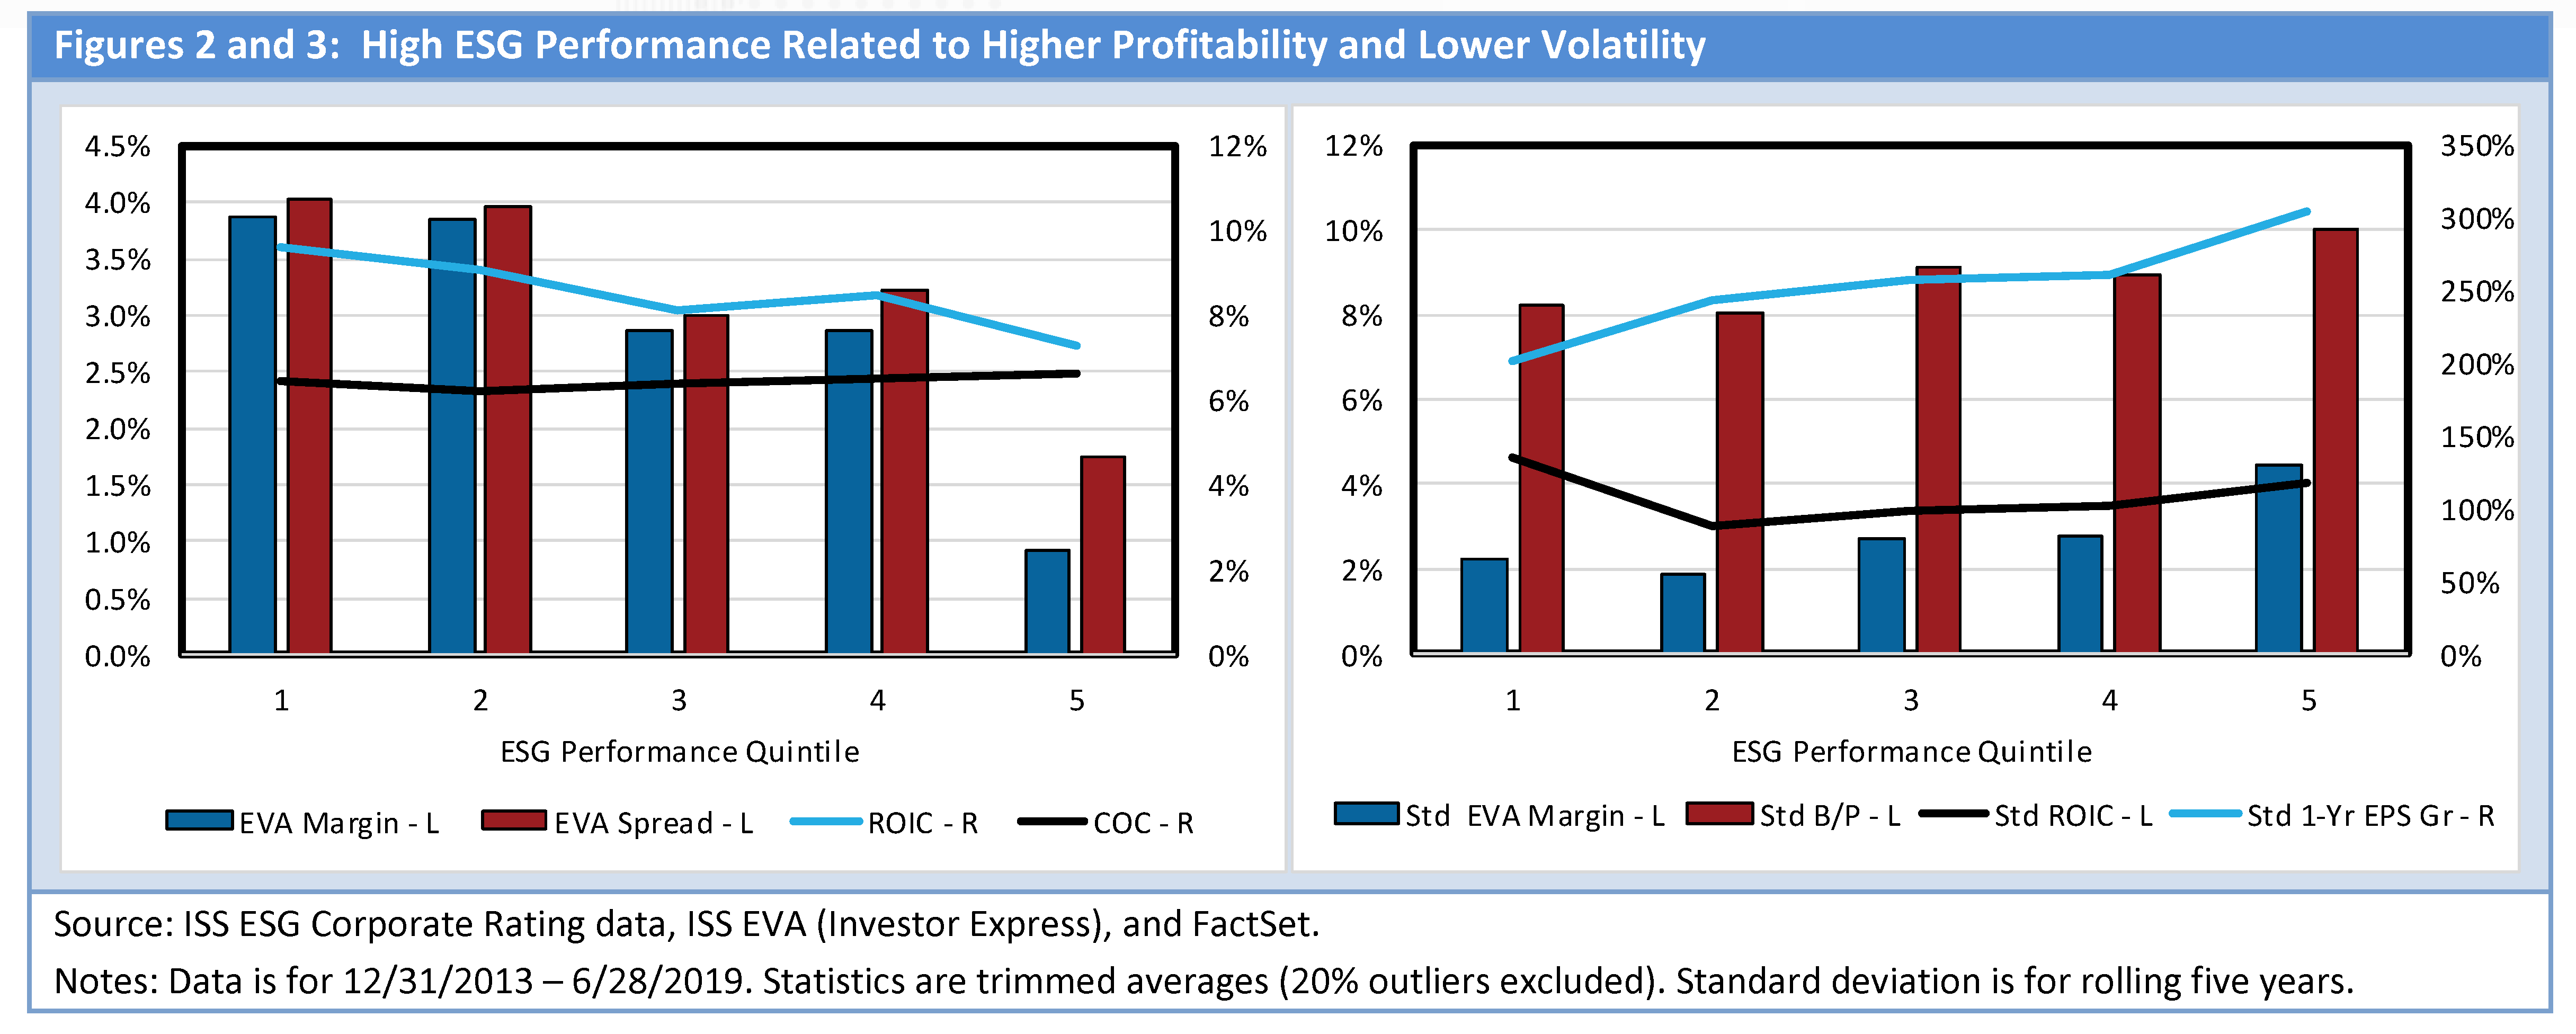
ESG Performance is related to higher EVA Margin, EVA Spread, and ROIC. Figure 2 shows that as the quintile of ESG Performance gets better (1s are best), EVA Margin, EVA Spread, and ROIC rise. ROIC measures what a firm earns on capital invested. If owners are good stewards of capital, they will view it as scarce, which drives up ROIC since the denominator of ROIC is capital. If employees are productive, revenue will be high, and if costs are low, then earnings will also be high. EVA Margin rises as ROIC grows versus cost of capital. If a firm earns more on its capital (ROIC) than its cost of capital, it is creating Economic Value Added (EVA). EVA Margin is EVA in dollars divided by sales, and EVA Spread is EVA in dollars divided by capital. Thus, high ESG companies are associated with firms that create economic value.
Not only is ESG correlated with profitability, but it is also correlated with volatility. However, the relationship is opposite. Higher volatility is associated with lower ESG Performance. Figure 3 shows that volatility rises for EVA Margin, valuation (B/P, or the reciprocal of P/B), ROIC, and EPS growth as ESG Performance declines.
The preceding measures for EVA are based on the total capital of a firm and the cost of capital is the weighted average for all capital of the firm. EVA can also be calculated based on ROE less the cost of equity capital. Figure 4 shows that ROE also rises for higher-ESG performing companies. This is primarily driven by being better stewards of capital, as asset turnover (sales/assets) declines with ESG Performance. Low-ESG companies are not as efficient using their assets to generate sales. On the other hand, net profit margin (earnings/sales) is higher for lower ESG Performance. Still, as shown earlier in figure 2, a better margin that considers capital charges (EVA Margin) indicates that good ESG companies have higher margins.
EVA Definitions
EVA Margin and EVA Spread
EVA = (return on capital minus WACC) times the amount of capital. This is equivalent to net operating profit after taxes less the amount of profit required by investors on their invested capital (WACC times IC0) and is also the same as sales minus operating costs minus capital costs. To scale EVA for comparisons, EVA is divided by sales to create EVA Margin. EVA divided by invested capital is EVA Spread.
MVA Margin and MVA Spread
The MVA Margin, (V0 minus IC0) divided by S0, is the amount the company is worth (or priced in the market) above the book value of capital as a percent of sales. MVA Margin is directly related to how much is earned on capital above its cost of capital (EVA) as a percent of sales, or EVA Margin. Similarly, MVA Spread is (V0 minus IC0) divided by IC0 and is related to EVA Spread.
See “How EVA Can Enhance DCF and P/E Analysis: A Case Study“ for a review of how the discounted free cash flow model produces the same results as EVA valuation method, and how the EVA methodology sheds additional insights. See “Profitability Drives Value“ for a review of how EVA Margin is empirically tied to MVA Margin and returns and how disconnects between EVA Margin (profitability) and MVA Margin (value) create investment opportunities.
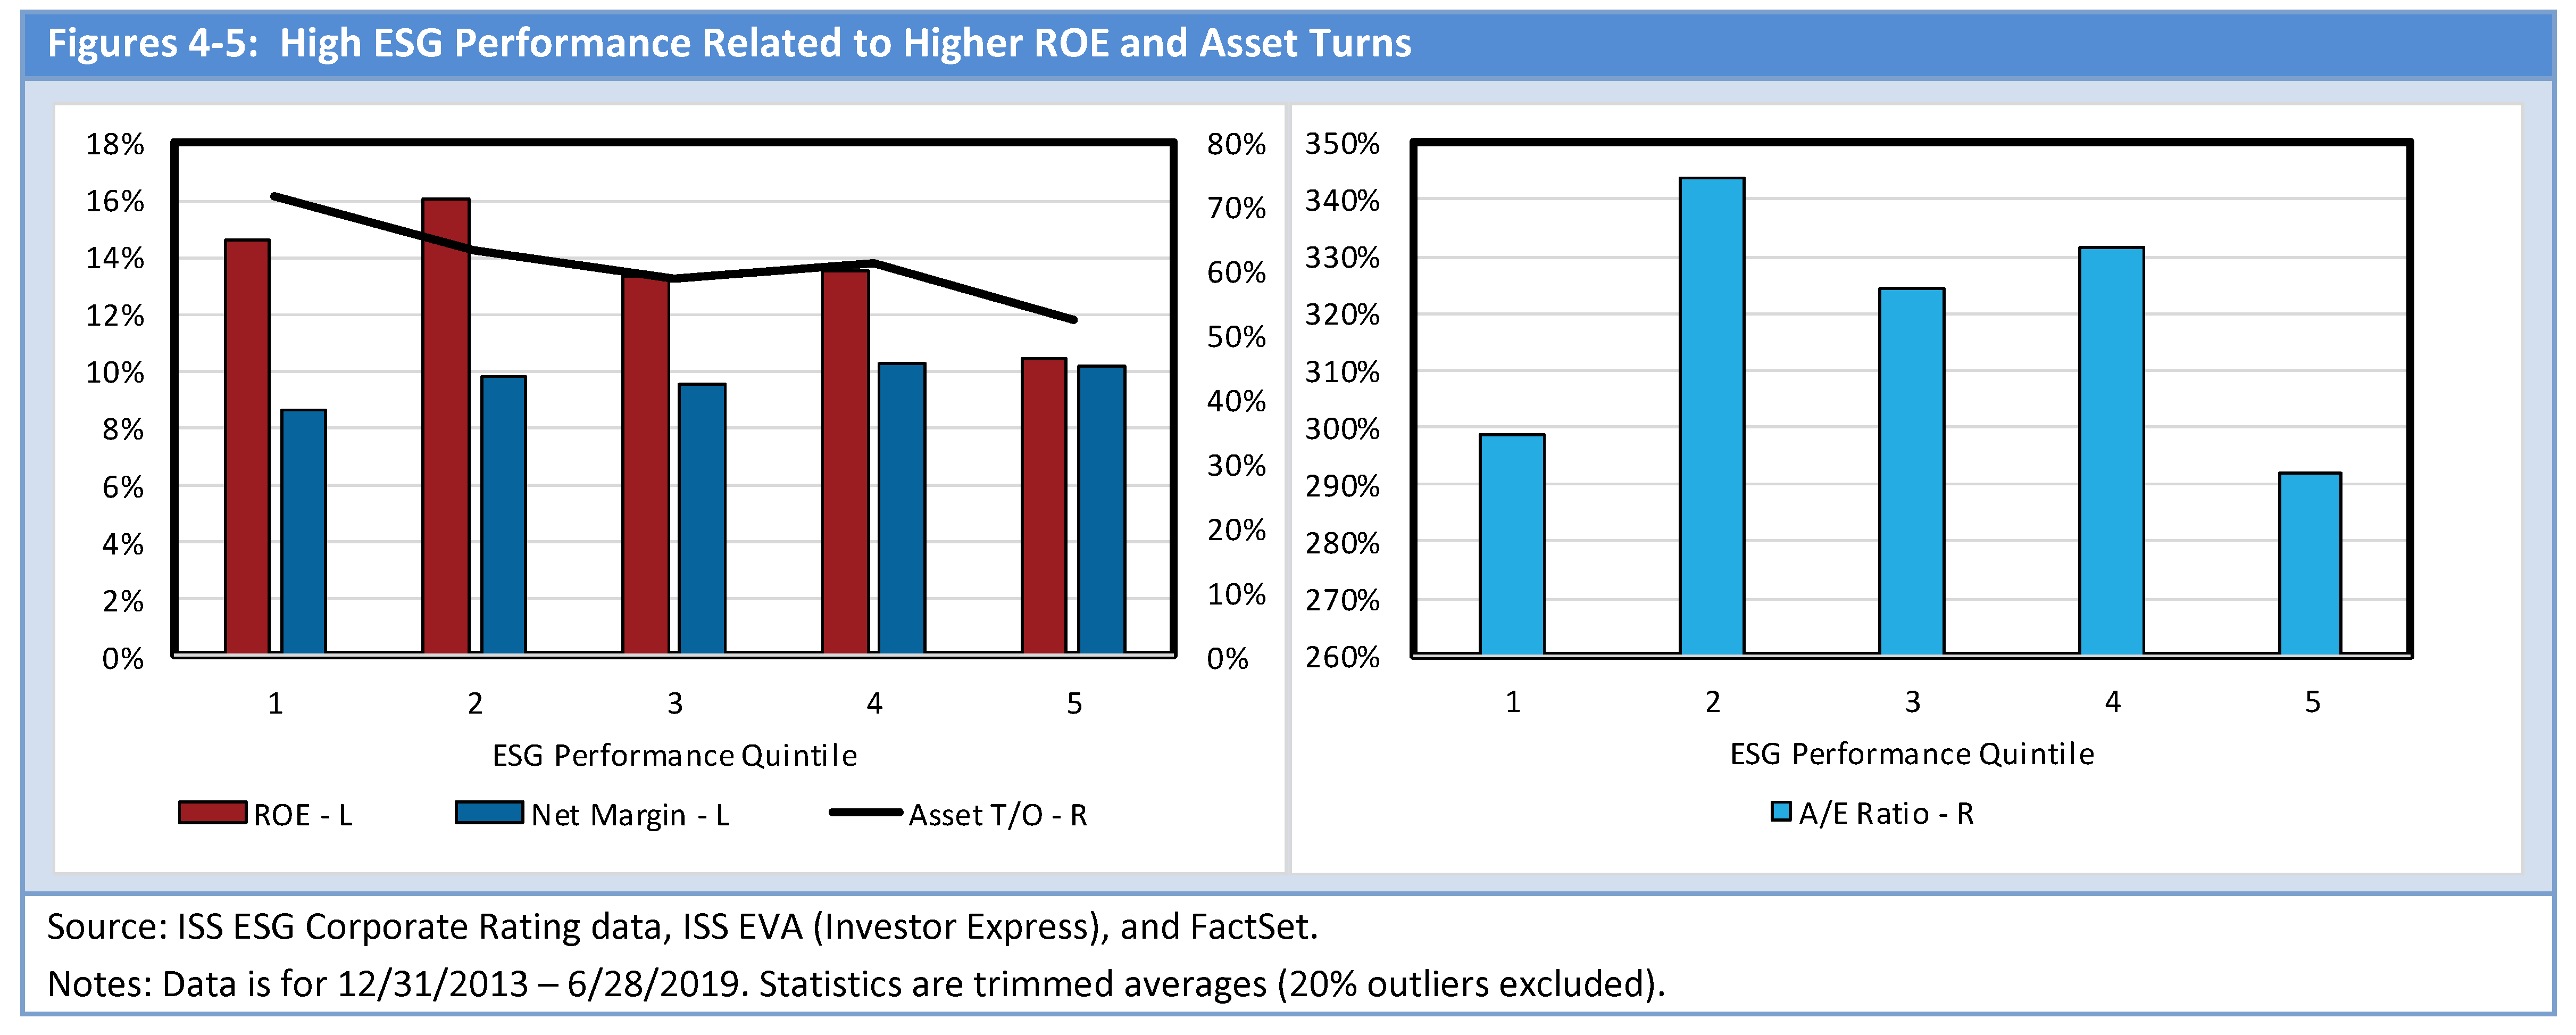
Figure 5 shows that leverage, as measured by assets/equity, is about the same for low and high ESG Performance. This means that the high ROE for high-ESG Performance firms is not due to leverage. Although, since these companies are less volatile (figure 3), maybe they could justify more leverage. Low-ESG companies may have problems (i.e., they have lower EVA Margin, higher volatility, and lower asset turns, and later, I will show that they tend to be more cyclical), which means they perhaps cannot afford to be as levered.
High-ESG Performance Companies are Good Allocators of Capital
Free cash flow (FCF) can be used to pay a dividend, buy shares, pay down debt, and build up cash and marketable securities. High EVA may be associated with high FCF. Here is why.
- Higher ROIC, without a commensurate rise in the cost of capital, will drive up EVA.
- Since ROIC is profits divided by capital, this means that a high-ROIC firm (i.e., high-EVA firm) has high profits relative to its capital.
- FCF is profits minus new investments in capital, so as long as ROIC is high and stable, free cash flow should also be high.
Oftentimes, firms are too confident and overinvest in capital when FCF is high (and EVA and ROIC are high) (see figure 10 of The Expectations Clock: A Model for Cycles and Sentiment). EVA and ROIC are driven down if the new investments do not yield the same level of profits as earnings on existing capital. Because of this, firms that are good stewards of capital should consider all options for uses of profits, not just capital investments.
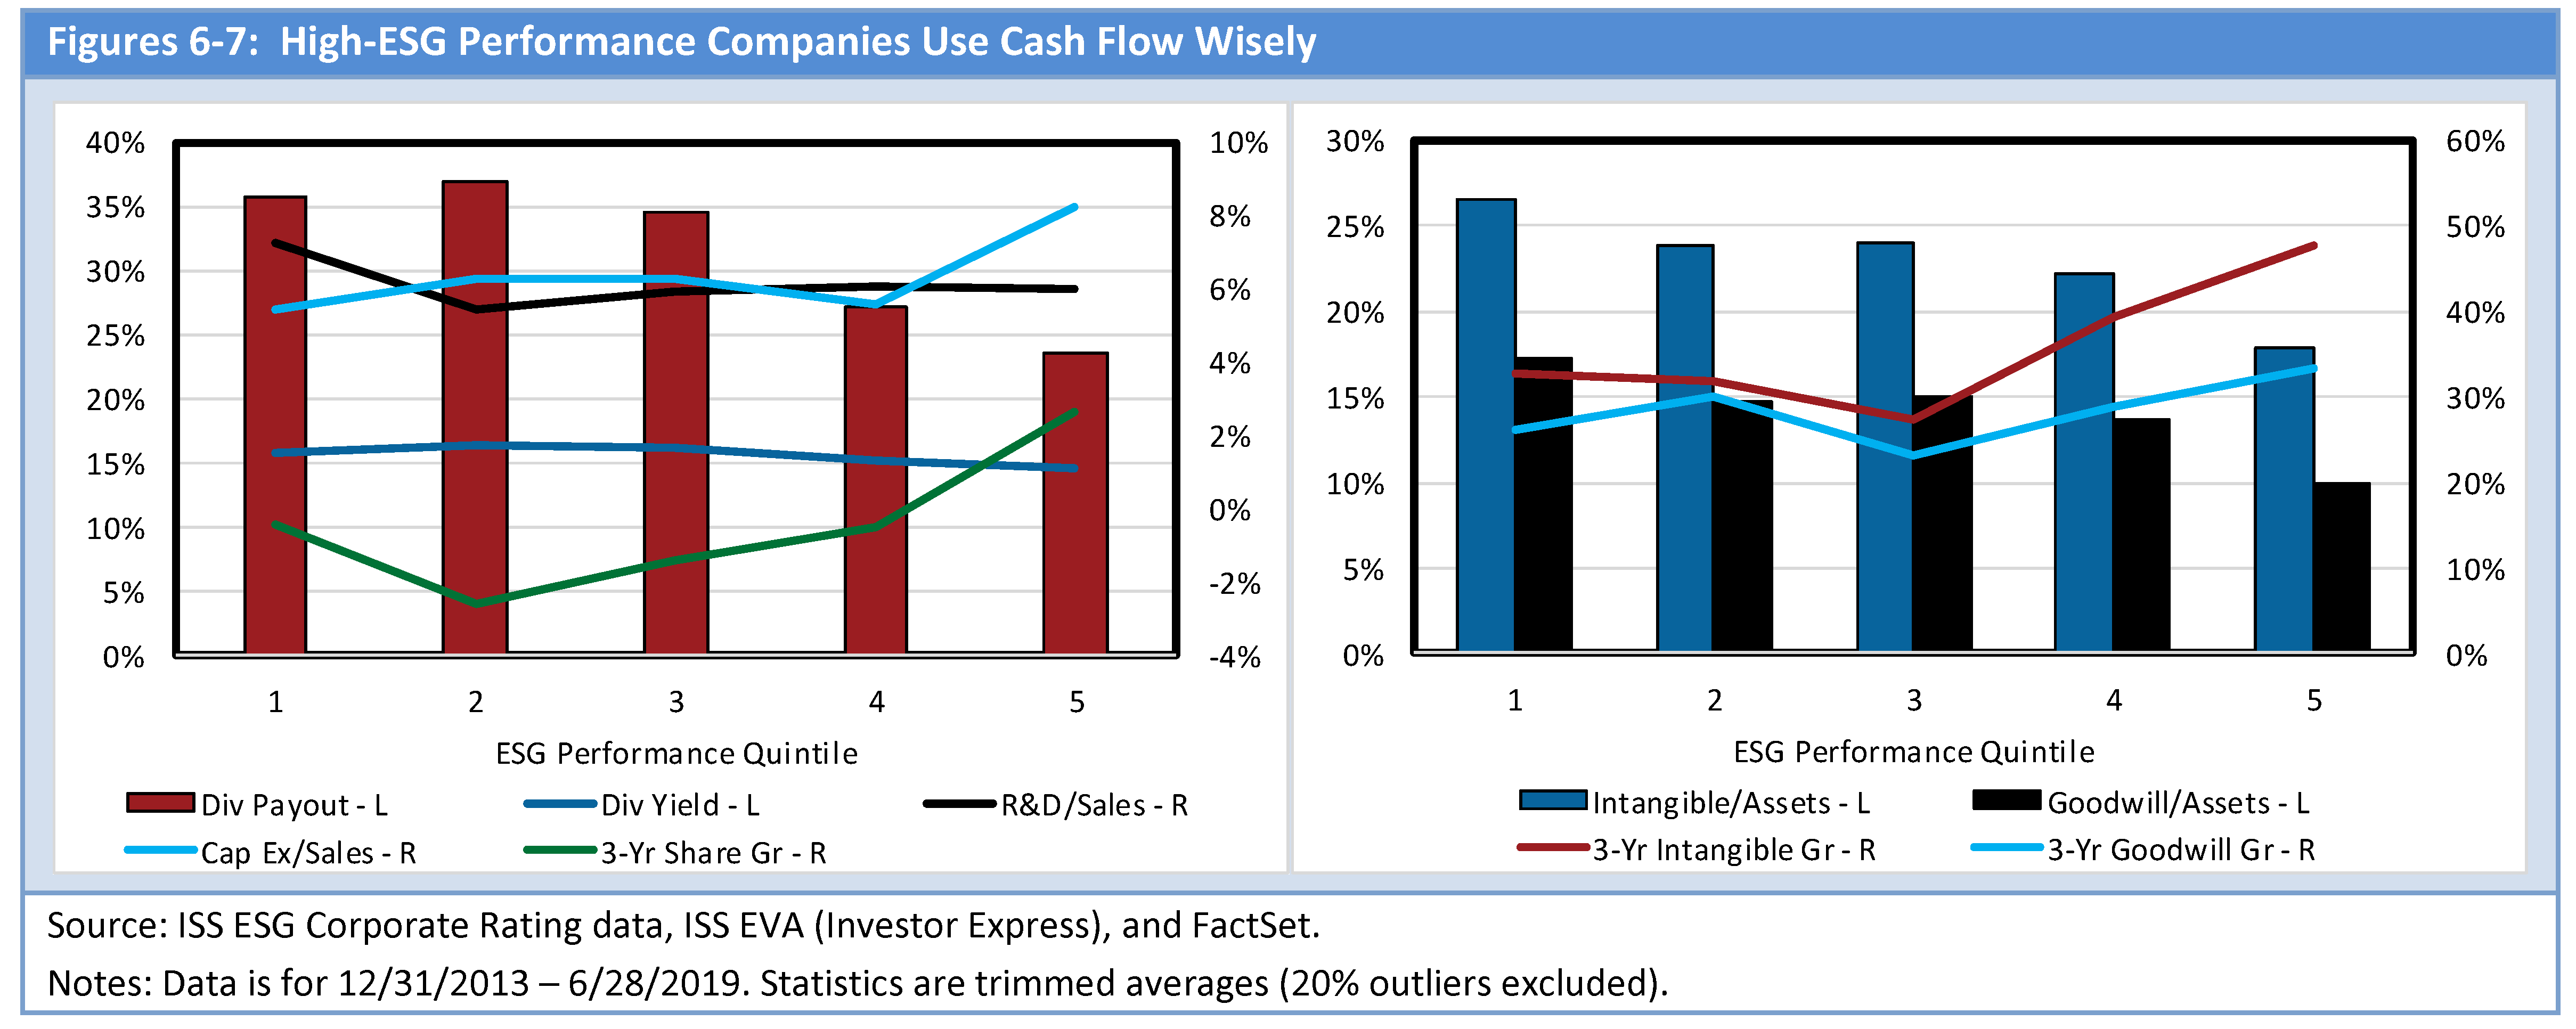
See figure 6. The higher the ESG Performance the higher the dividend payout ratio and dividend yield. Furthermore, high ESG Performance is associated with higher share buy-backs. Thus, good ESG is correlated with returning capital to shareholders. High-ESG firms also have modest debt (figure 5). This does not mean that high-ESG companies don’t invest for the future. They tend to have higher levels of R&D (figure 6), which may lead to their higher level of intangibles (figure 7). However, high-ESG performing companies tend to invest less in capital expenditures. Remember (figure 4), high-ESG companies tend to have higher asset turns. R&D is generically for new and better things, whereas cap ex may be to make more of the same, so perhaps high-ESG companies are more likely to be at the cutting edge?
Good-ESG Companies Generally Have Higher Valuations, EVA Growth, Size, and Returns
Figure 8 shows that at least several valuation multiples (P/E, P/FCF, and P/B) tend to be positively correlated with ESG Performance. Investors are rewarding higher profitability and being a good steward of capital. Good-ESG companies also tend to be larger (figure 9), but in general the entire universe that is ESG rated is large. This could explain their lower levels of volatility (figure 3)—they are perhaps more diversified. Larger companies may be more profitable (figure 2) due to operating leverage; fixed costs are spread over more units so average cost per unit is lower.
An exception to valuation multiples generally being higher for high-ESG Performance is MVA Margin, or the amount the firm is valued above invested capital (Market Value Added, or MVA) as a percent of sales. MVA Margin for the high- and low-ESG Performance companies is about the same. Perhaps MVA Margin for the high-ESG Performance companies, despite their higher levels of profitability, is reflecting their lower EPS, sales, and asset growth (figure 10)? Although, the more important EVA Momentum (growth in EVA) variable tends to rise with higher ESG Performance. Dividends per share growth is also modestly higher for the top-ESG Performance companies versus the bottom quintile. Furthermore, maybe the reason MVA Margin is not lower for low-ESG Performance companies is because investors are betting on EVA turnarounds or focusing on the higher sales, EPS, and asset growth for these stocks.
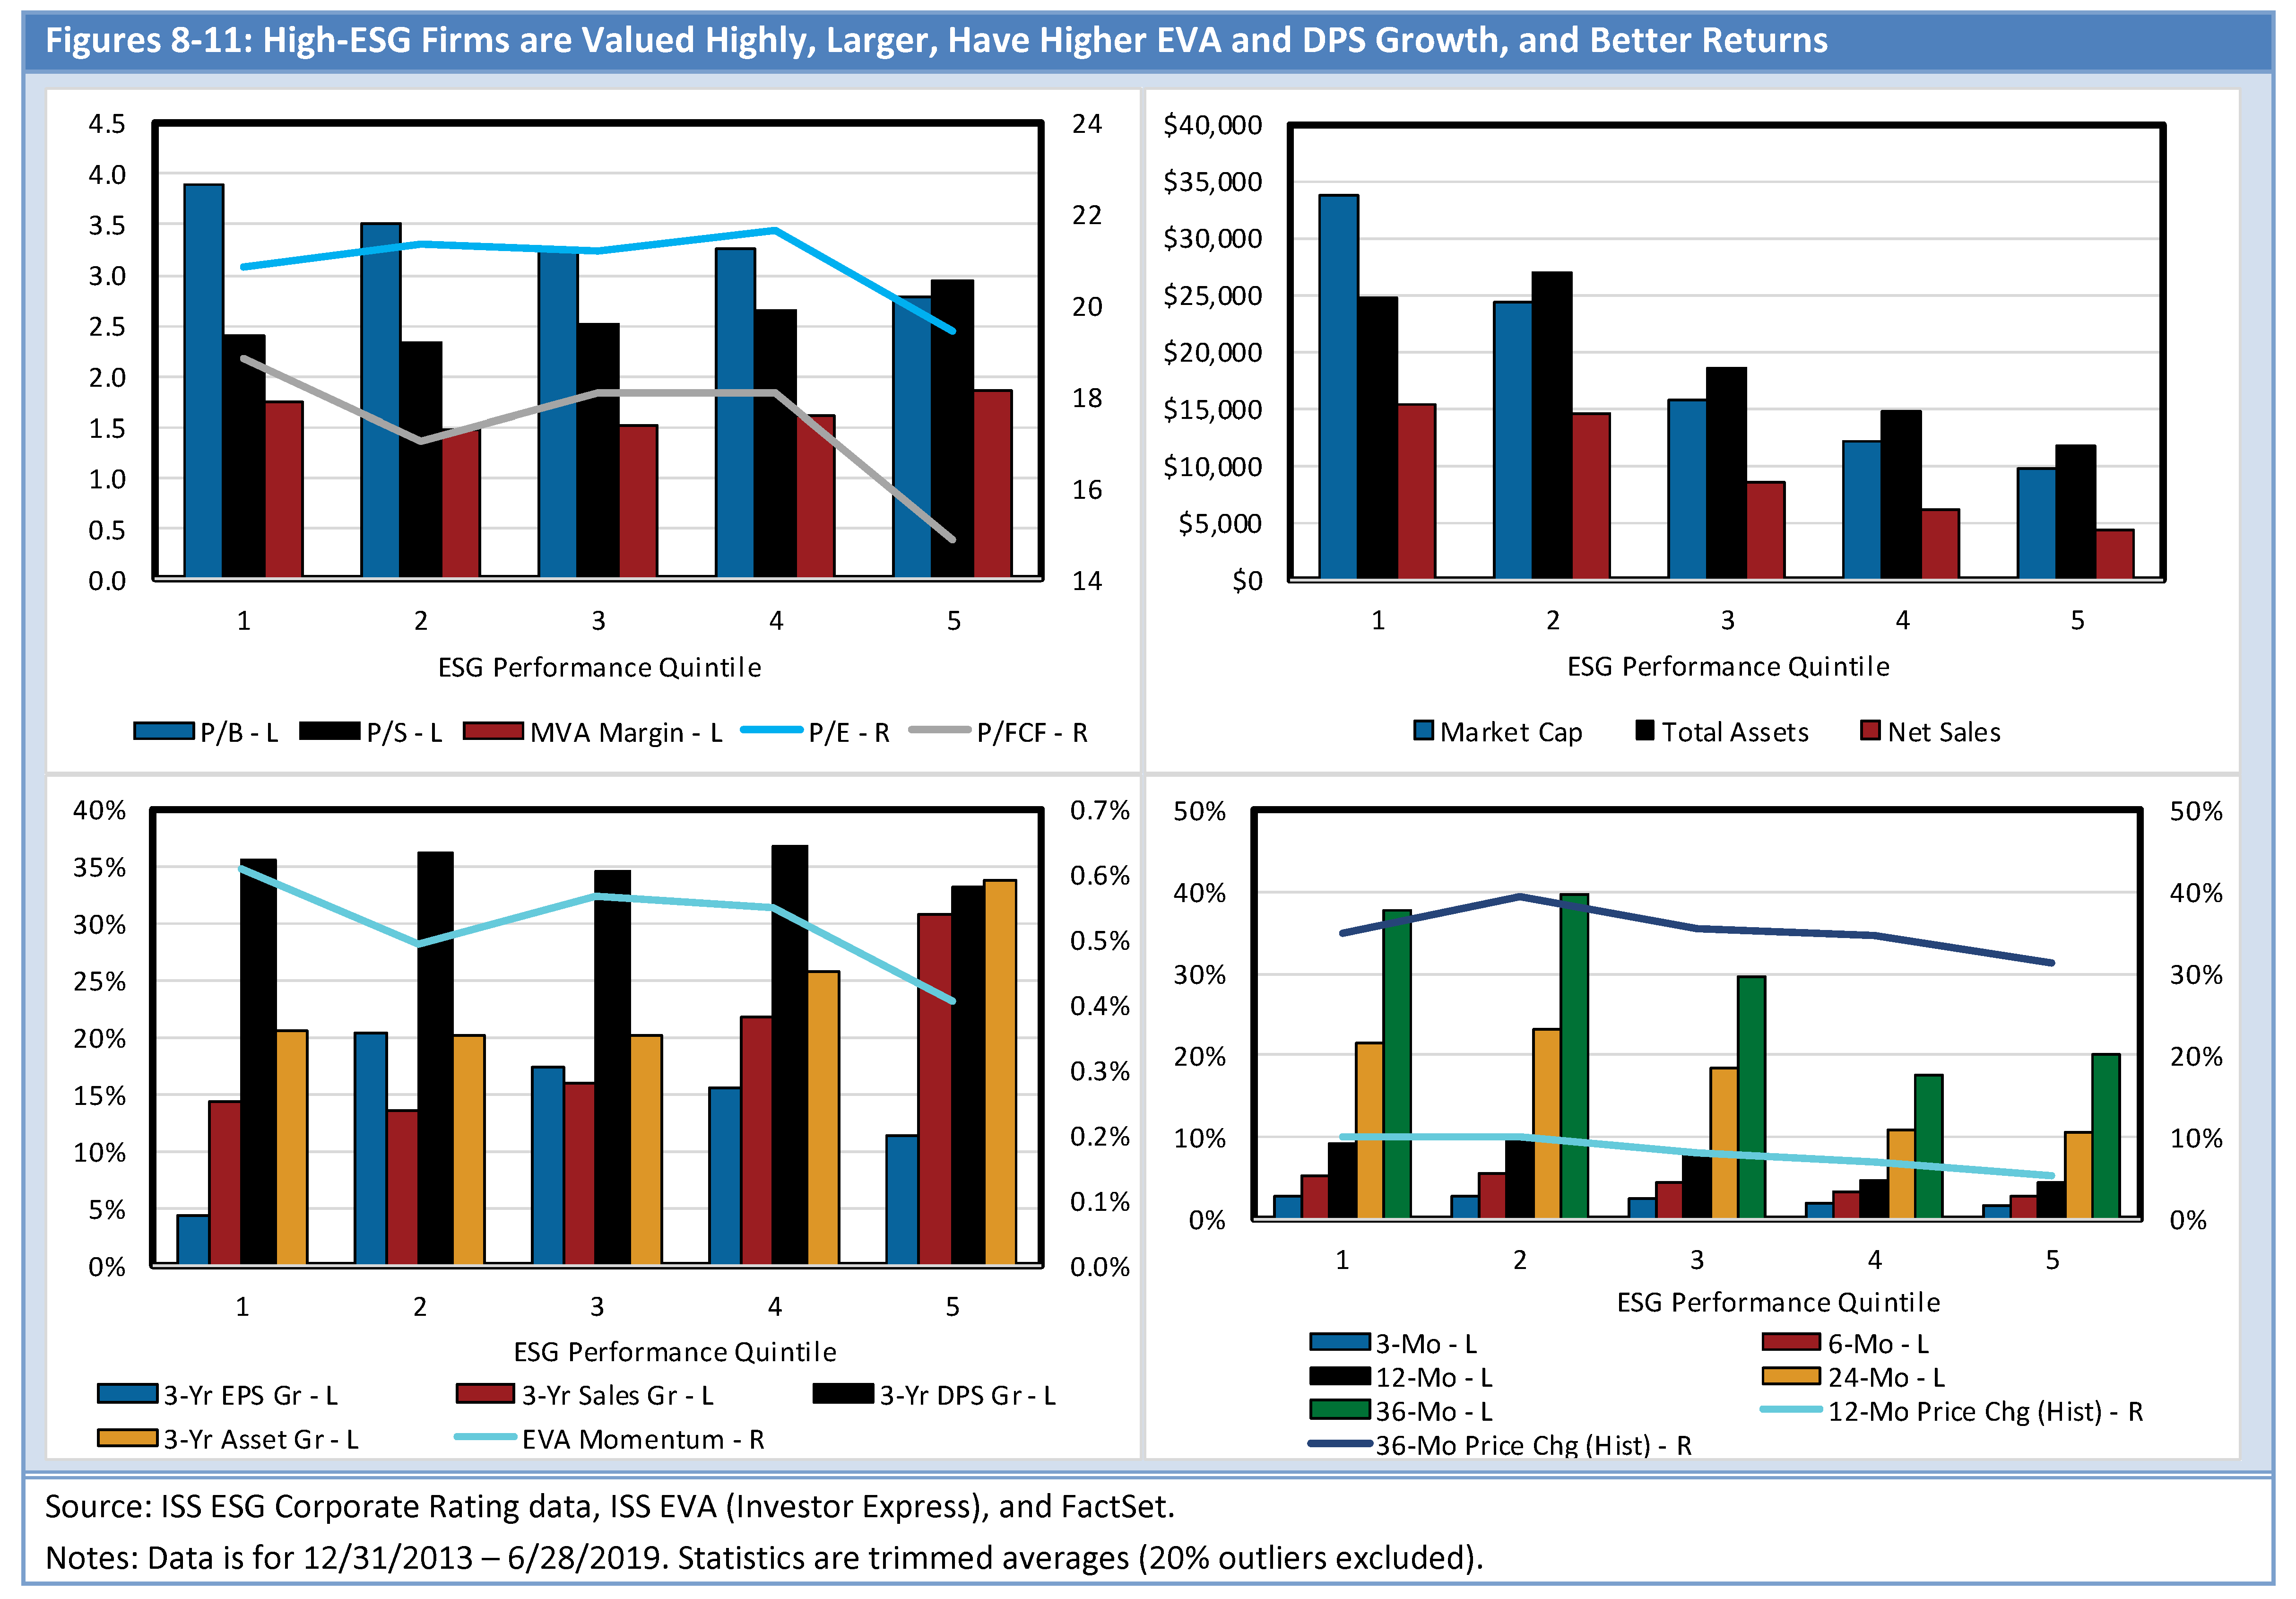
Another exception to higher valuation for high-ESG Performance companies is P/S. P/S is higher for low ESG Performance. This is explained by higher net profit margins for low-ESG Performance companies (figure 4). One is willing to pay a higher price for sales (P/S) for firms that earn more on their sales (net profit margin).
Overall, high ESG Performance is associated with good past and future returns (figure 11). Perhaps if these companies were too highly valued (MVA Margin too high), returns would be lower. So, while higher valuation may be preferable from a company’s perspective, it could also mean lower returns which is not. Finally, valuation multiples may rise if growing interest in ESG creates more demand for high-ESG Performance stocks and drives up their stock prices.
Higher-ESG Performance and Profitable Firms Have Higher Returns with Lower Risk
ESG measures how a firm is taking care of society (E and S) and shareholders (G), and EVA measures a firm’s true profitability. While high-ESG stocks outperform (figure 12) and so do high-EVA firms (see Profitability Drives Value), combining ESG with EVA is even better.
Figures 12-14 show returns based on several different sorts of ESG with EVA. Figure 12 shows cumulative returns for a simple sort of stocks in the top and bottom halves of ESG Performance. Figure 13 illustrates the returns of combining ESG with EVA Margin. 1-1s are high-ESG Performance and high-EVA Margin stocks, 1-2s are high-ESG Performance and low-EVA Margin securities, 2-1 stocks have low ESG Performance and high EVA Margin, and 2-2s are low-ESG Performance and low-EVA Margin companies. Figure 14, a table, shows the annual returns and other statistics of a 5X5 fractiling.
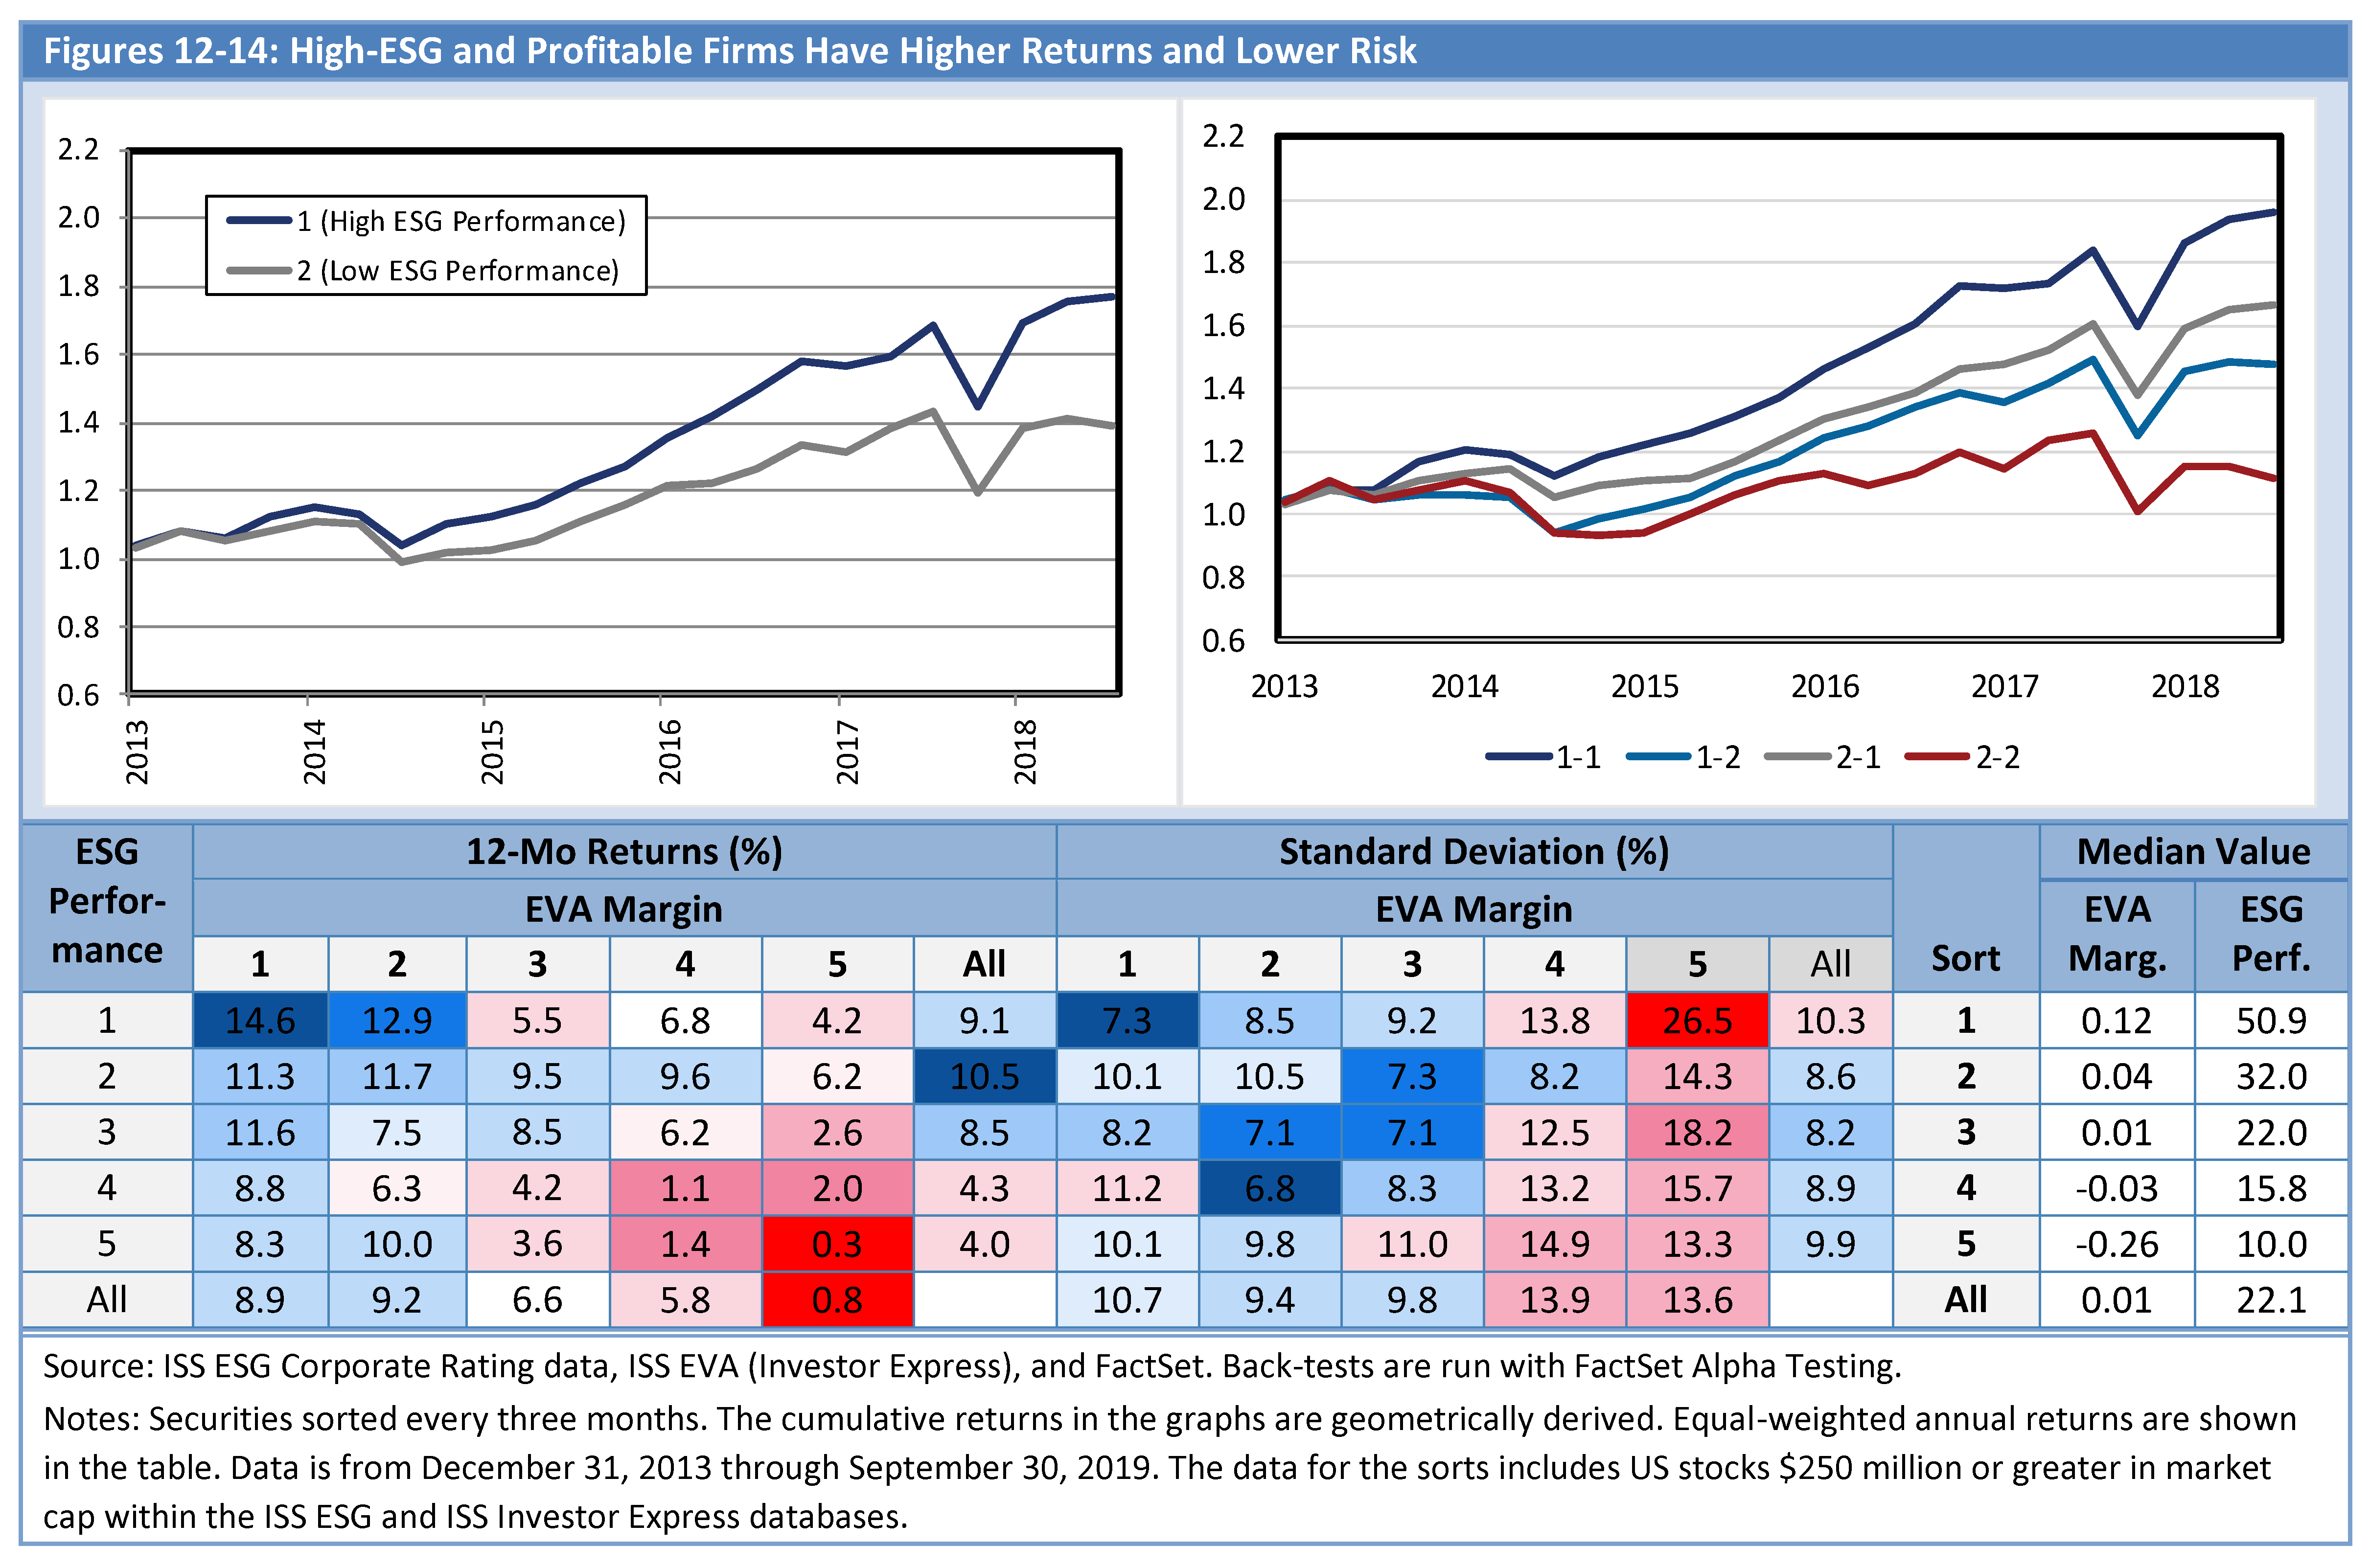
High-ESG firms outperform low-ESG companies and combining ESG with profitability is even better. The 1-1s rose 96% from the end of 2013 through 3Q 2019 versus the 2-2s that were up 11%. The highest forward 12-month return for the five-way sort is 14.6% for the highest-ESG Performance / highest-EVA Margin companies, and the lowest return, 0.3% is for the lowest-ESG Performance / lowest-EVA Margin stocks.
Furthermore, the higher returns tend to not be associated with higher risk. The fourth lowest risk, based on standard deviation of returns, in the 5-way sort is from the highest-ESG Performance / highest-EVA Margin good-performing stocks.
It Works Across Most Sectors and Over Time
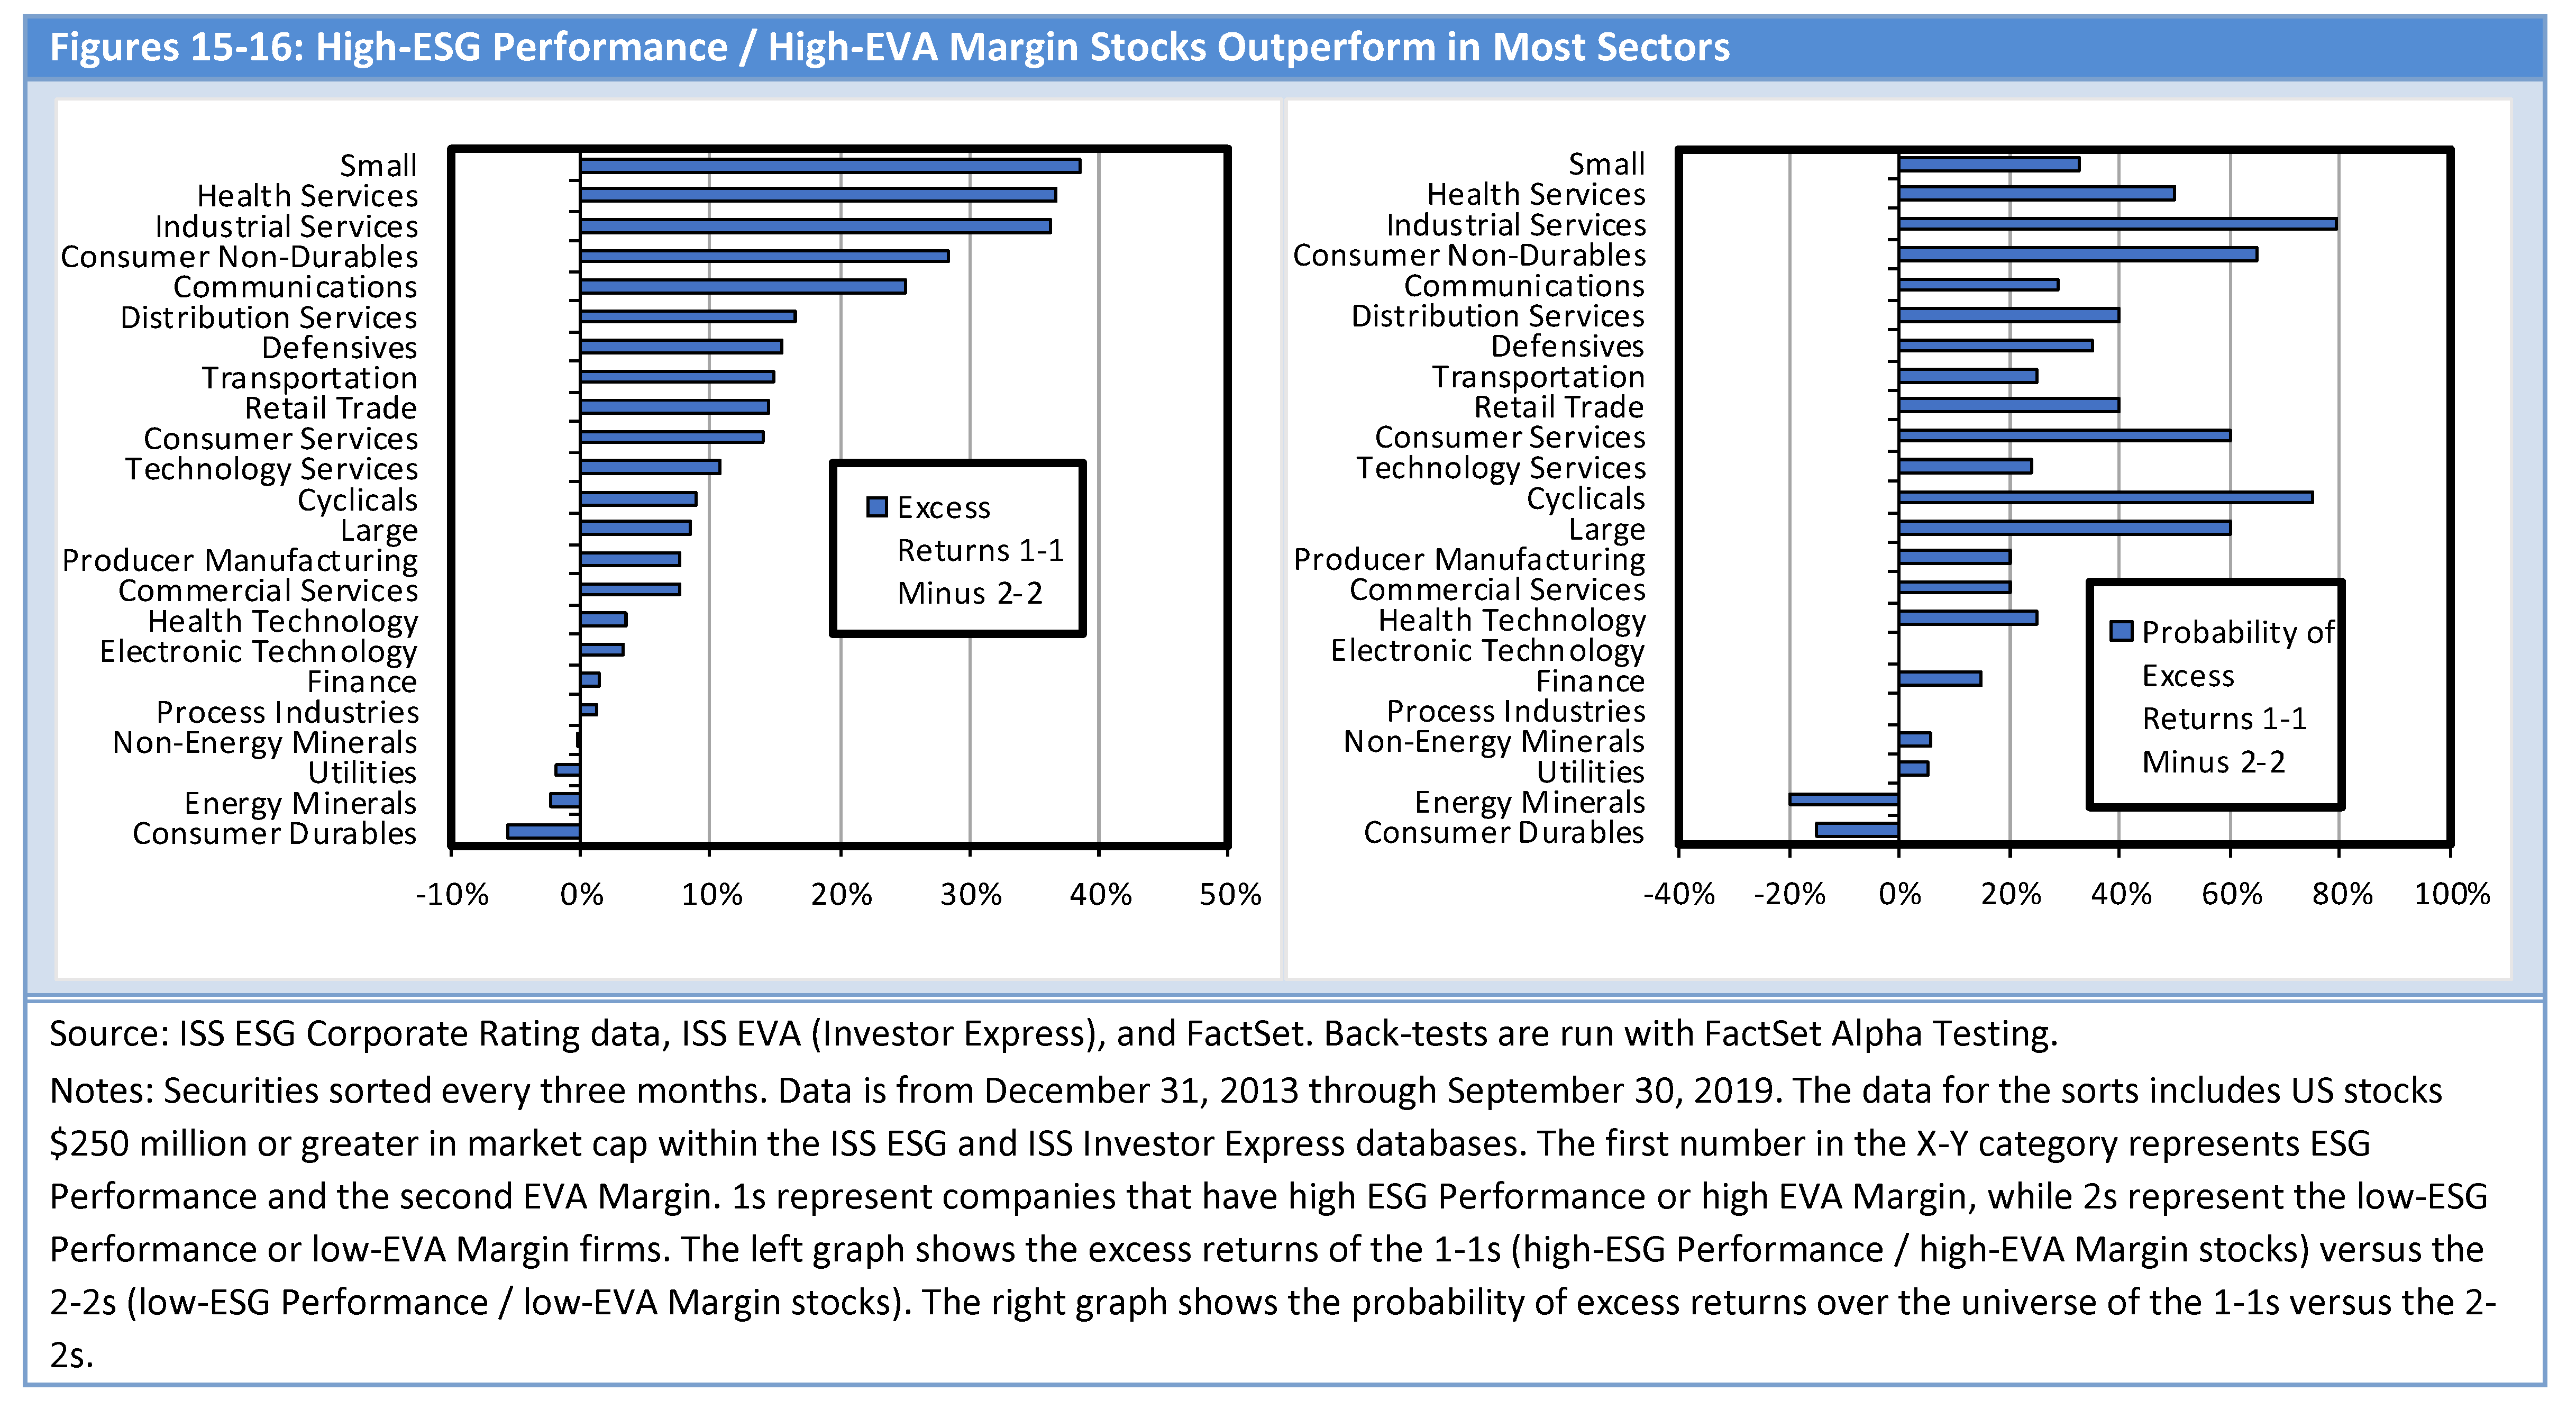
Figure 15 shows that outperformance is not limited to a few sectors. The 1-1s tend to outperform the 2-2s in most sectors. Also, 1-1s perform better than the median sector return in every sector (not shown). This result is not limited to certain time periods. Figure 16 shows that the probability of excess returns is higher for the 1-1s than 2-2s in almost every sector.
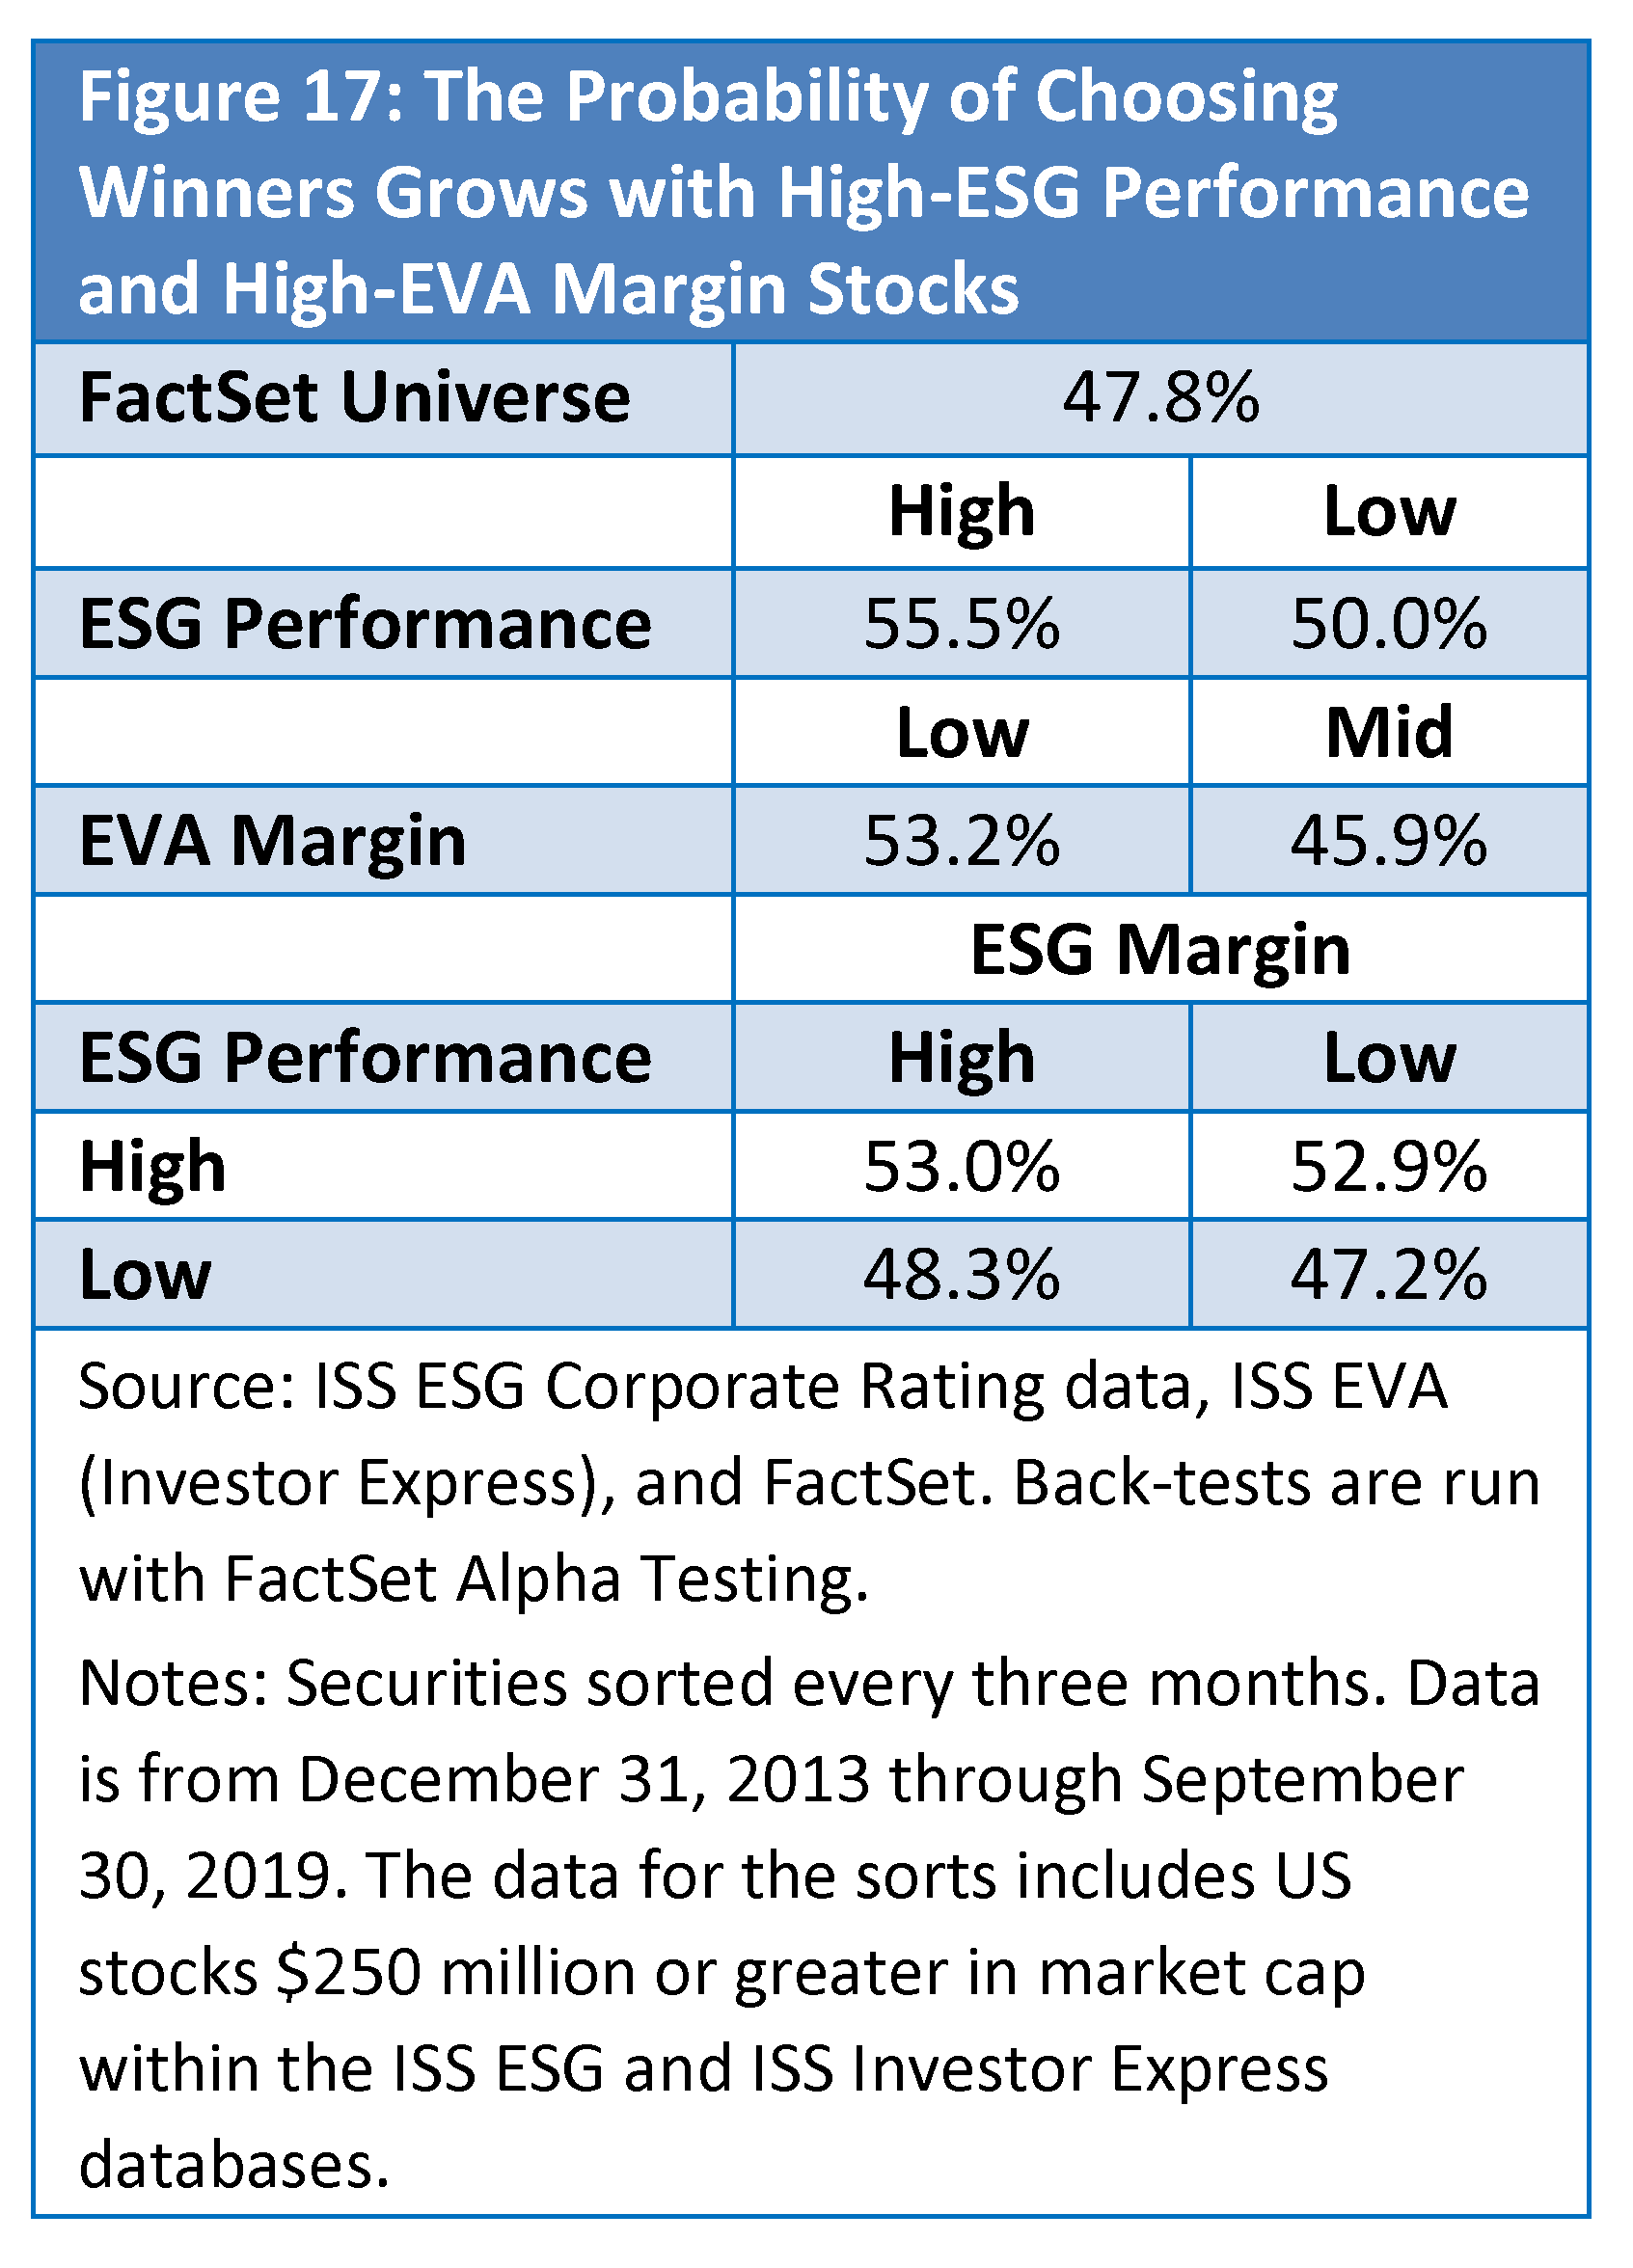
One can see from figure 17 that screening on ESG Performance and/or EVA Margin can improve one’s odds of choosing a stock that outperforms. 47.8% of companies outperform the FactSet universe, but the odds improve if one screens for ESG Performance and EVA Margin. The spread between high and low is nearly 6% with ESG Performance, about 7% for EVA Margin, and approximately 6% with both combined. While this may not seem significant, keep in mind that all one needs to do is pick more winners than losers—assuming returns are similar—to outperform.
Special Note
The fractiling discussed above has been across the entire universe. This introduces sector biases. For instance, some sectors tend to have higher (technology, healthcare, and consumer non-durables) or lower (financials, energy, and retail trade) ESG Performance. Despite perhaps introducing sector bias, sorting across the entire universe was done for three reasons. First, it provides extra insight into how good-ESG and EVA companies perform overall. Second, it allows us to identify the best-ESG sectors. Third, it reduces outliers impacting results. For instance, a 3X3 or 5X5 sort as done above for ESG Performance / EVA Margin may introduce an outlier effect given the limited number of ESG rated stocks. A 3X3 sort results in nine fractiles. Since there are 20 FactSet sectors and a universe that began with only 534 securities (ended with 1,196), this means that, on average, there would be only two securities (25 times 9 is 225 per fractile in the early periods for within sector
However, it should be noted that, while not displayed here, sorting within sectors produced similar results as reviewed above.
- 3X3 and 5X5 sorts of ESG Performance and EVA Margin within sectors generally produced similar results as shown above—higher returns without commensurately higher risk for high-ESG Performance / high-EVA Margin stocks versus low-ESG Performance / low-EVA Margin securities. Because of the concern with outliers, another within sector sort was done, but this time EVA Margin companies outside of one standard deviation of the average were removed. This also produced similar results.
- Generally, within sectors and similar to the across the universe fractiling, companies with higher ESG Performance, versus lower ESG Performance, have higher profitability, lower volatility, higher distributions to shareholders, higher EVA growth (but lower other measures of growth except dividends), better returns (except historical three-year price returns), and are Differences in results between within sector sort versus across the universe fractiling include how low ESG Performance was more likely to be associated with higher valuation, generally related to higher intangibles and goodwill, and R&D/sales and cap ex were similar across ESG Performance quintiles (for sorts across the universe, R&D/sales was higher for high-ESG Performance firms and cap ex/sales was lower). Health care and technology generally have a higher weight in the high ESG Performance quintile, so perhaps this explains the high ESG Performance quintile’s higher intangibles and goodwill (if they are acquisitive) in the sorts across the universe.
- Similar to sorts across the entire universe, returns of 1-1s are higher than 2-2s within most sectors most of the The spreads between returns and percent of time of outperformance is a bit lower for sorts within sectors, as is the probability of picking a winner, but they are still better for the 1-1s than 2-2s.
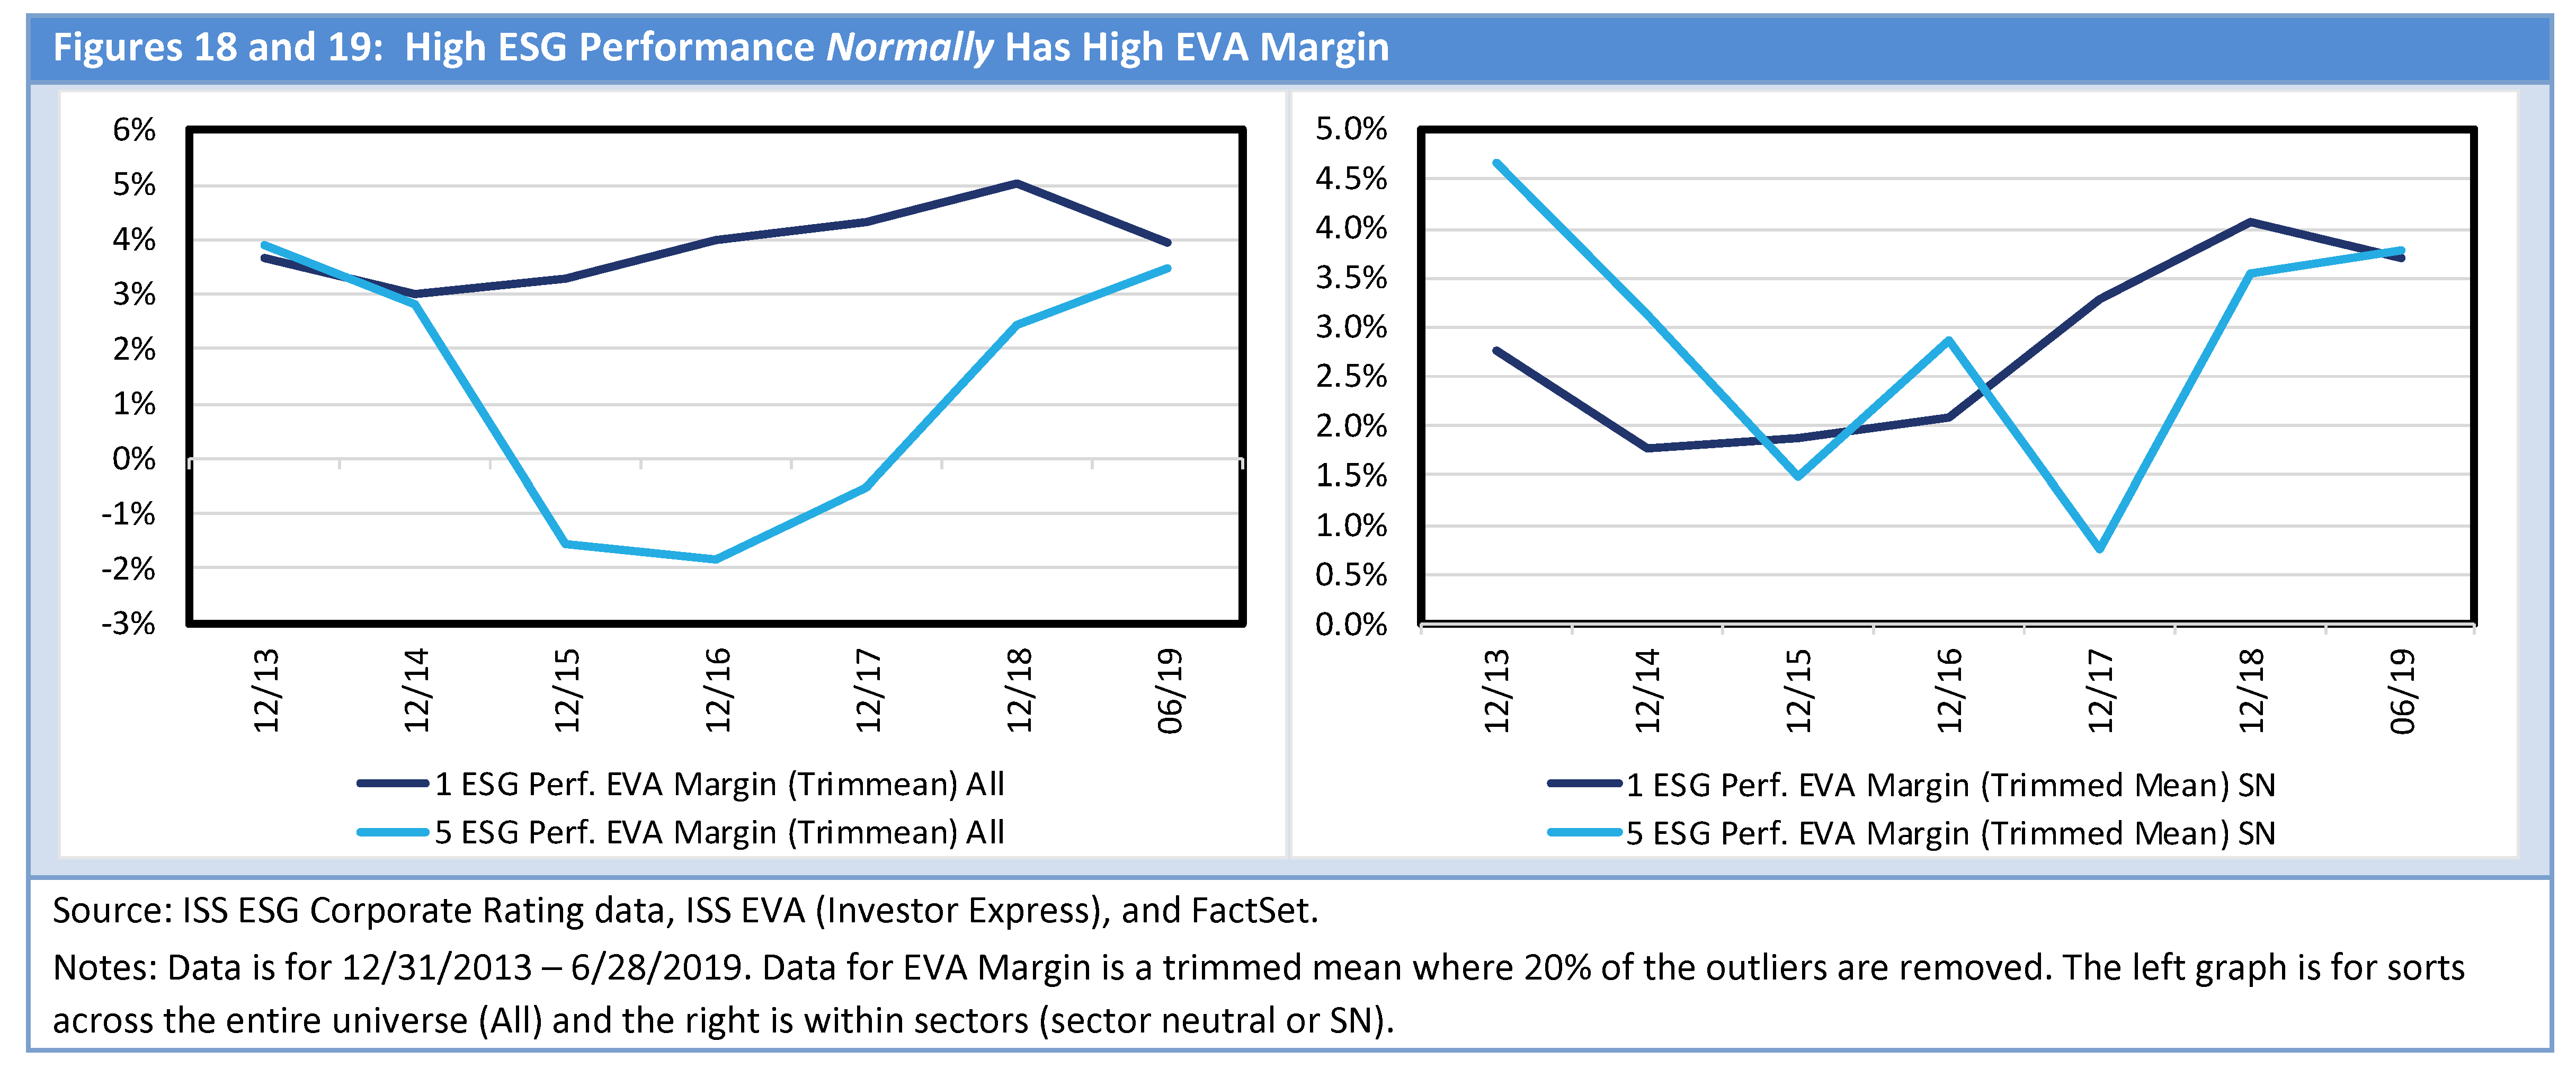
Profitability Changes Over Time
Profitability changes over time. Figure 18 shows how EVA Margin varies for the high quintile-ESG Performance and low quintile-ESG Performance companies from the end of 2013 through mid-2019. Generally, high-ESG Performance stocks have higher EVA Margin, but recently they have deteriorated as low-ESG Performance companies have improved.
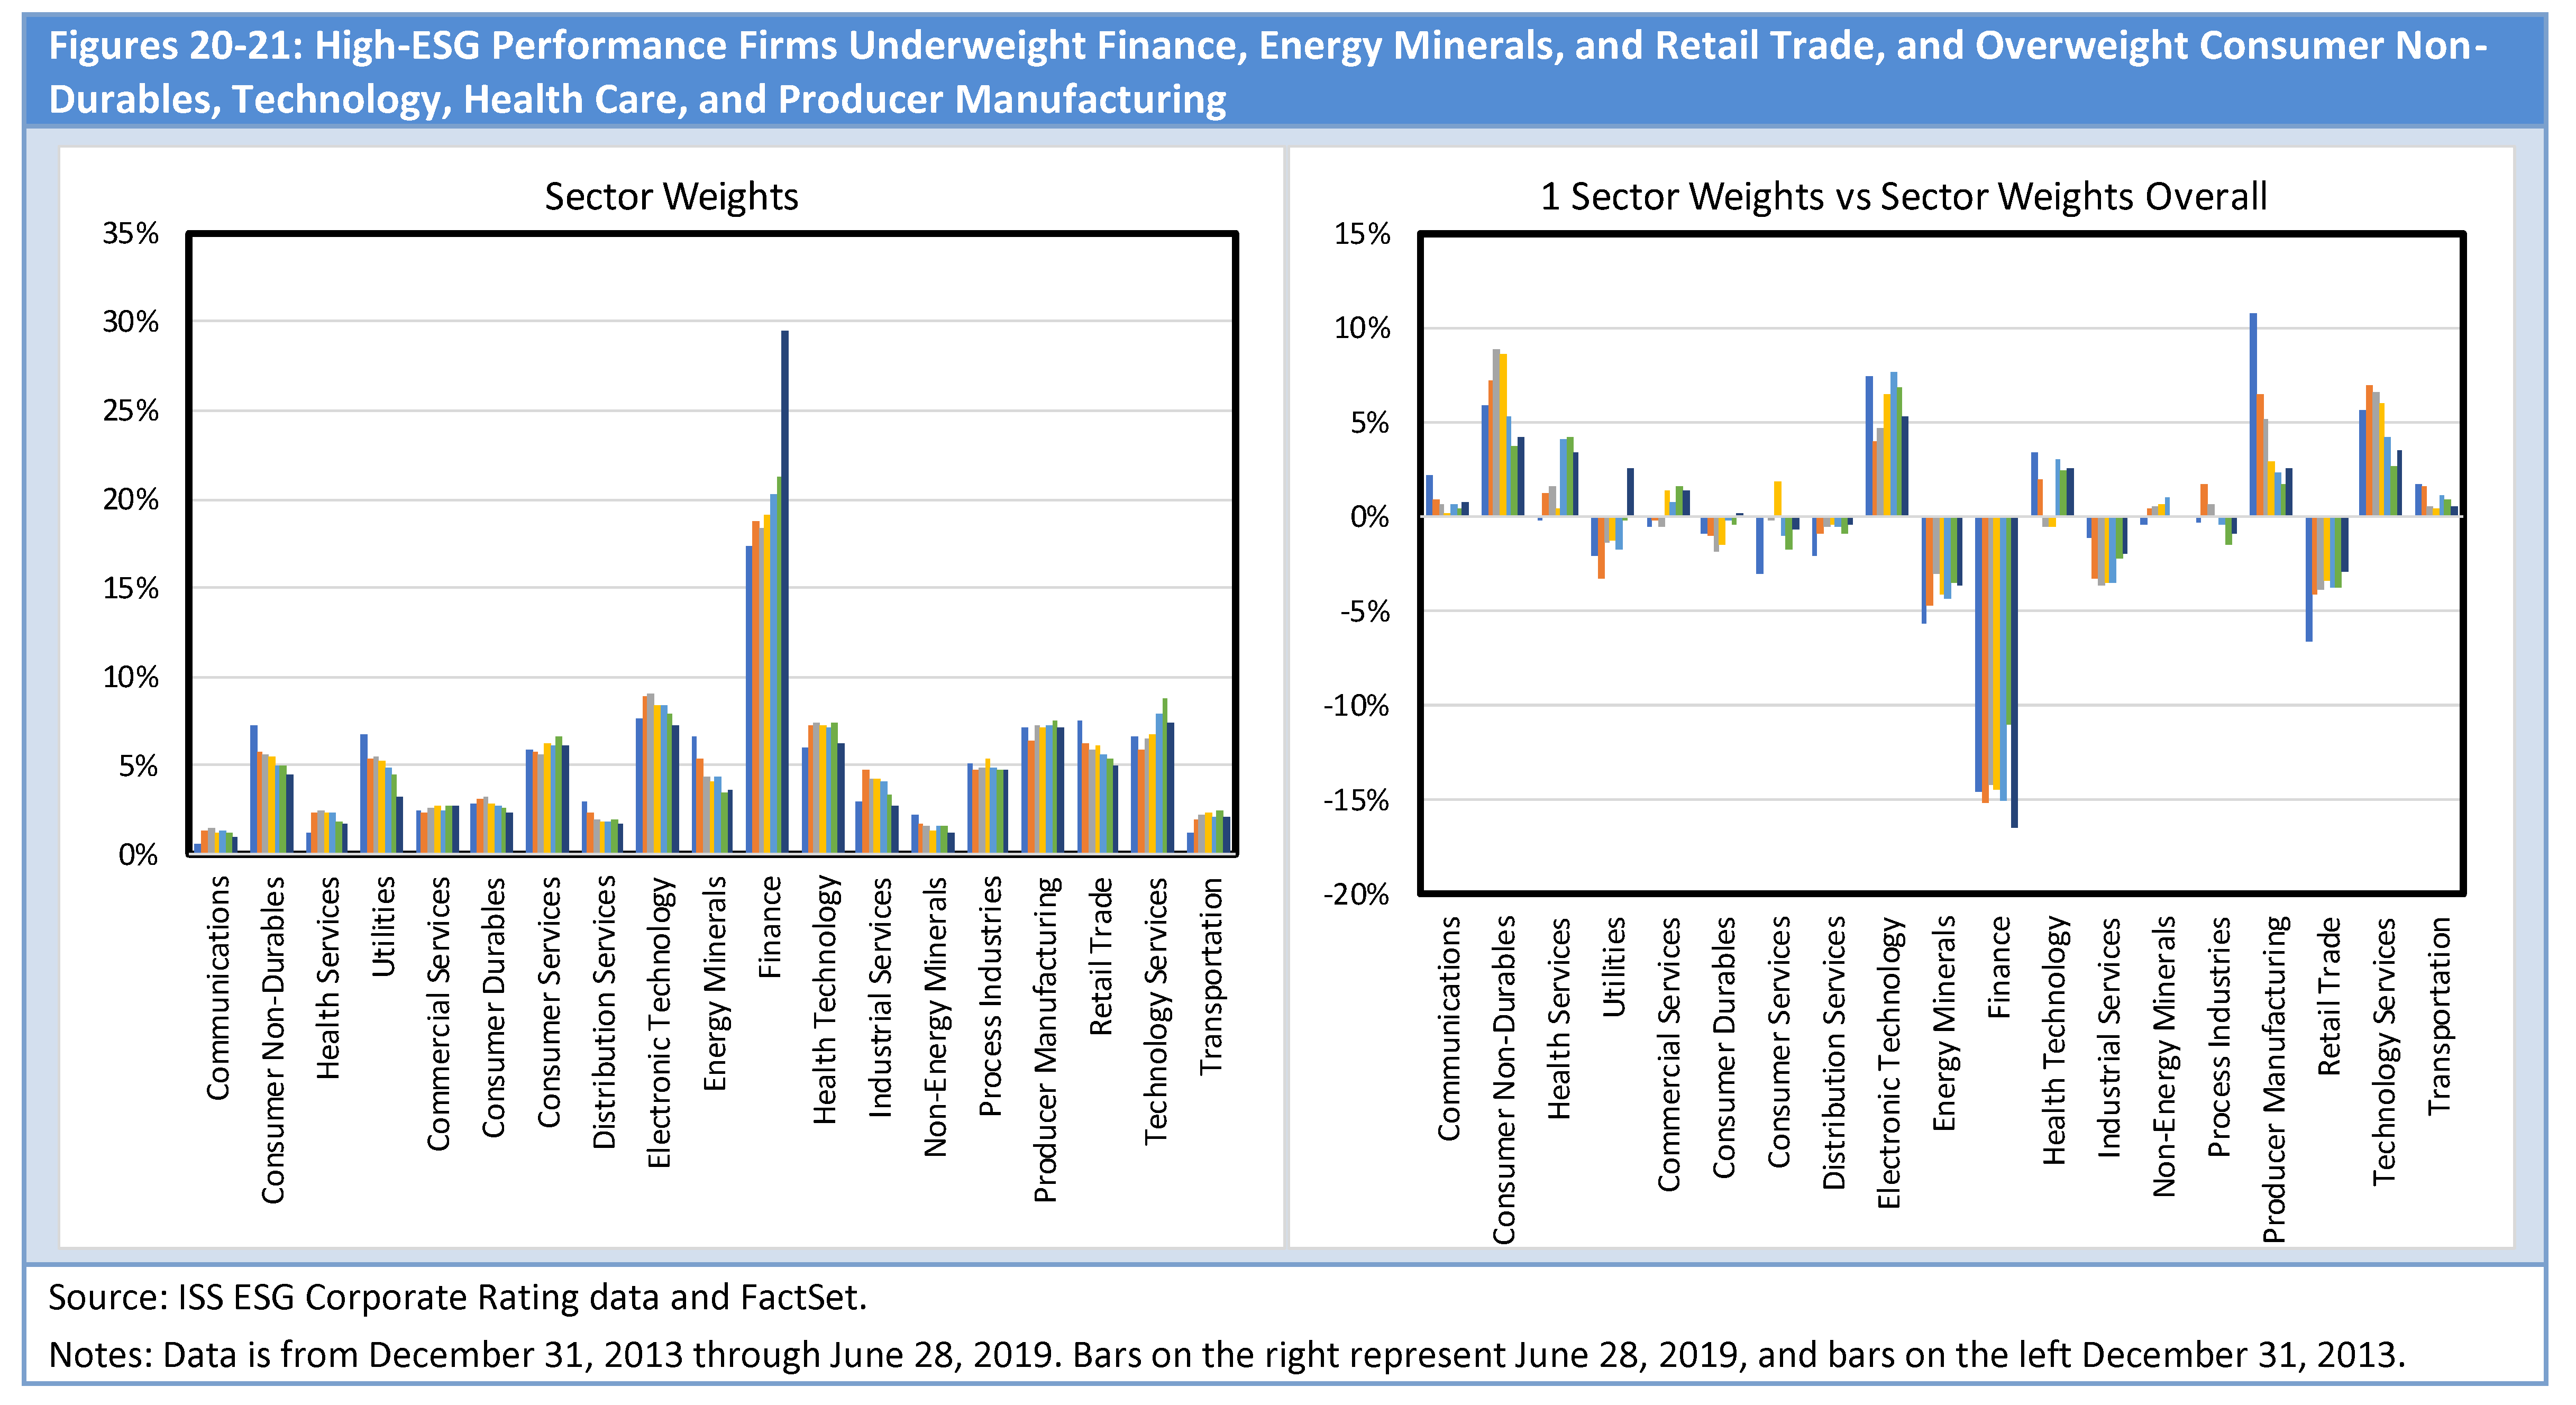
High-ESG Performance firms are generally overweighted traditionally growth and/or less cyclical areas (figure 21). These include the two technology sectors, two health care sectors, and consumer non-durables. On the other hand, low-ESG Performance is associated with cyclical sectors such as finance, energy minerals, and retail trade.
Sector weights explain the dive in EVA Margin for low-ESG Performance stocks from 2013 through 2015. This period was associated with a manufacturing recession and a rising threat from online retailers such as Amazon.
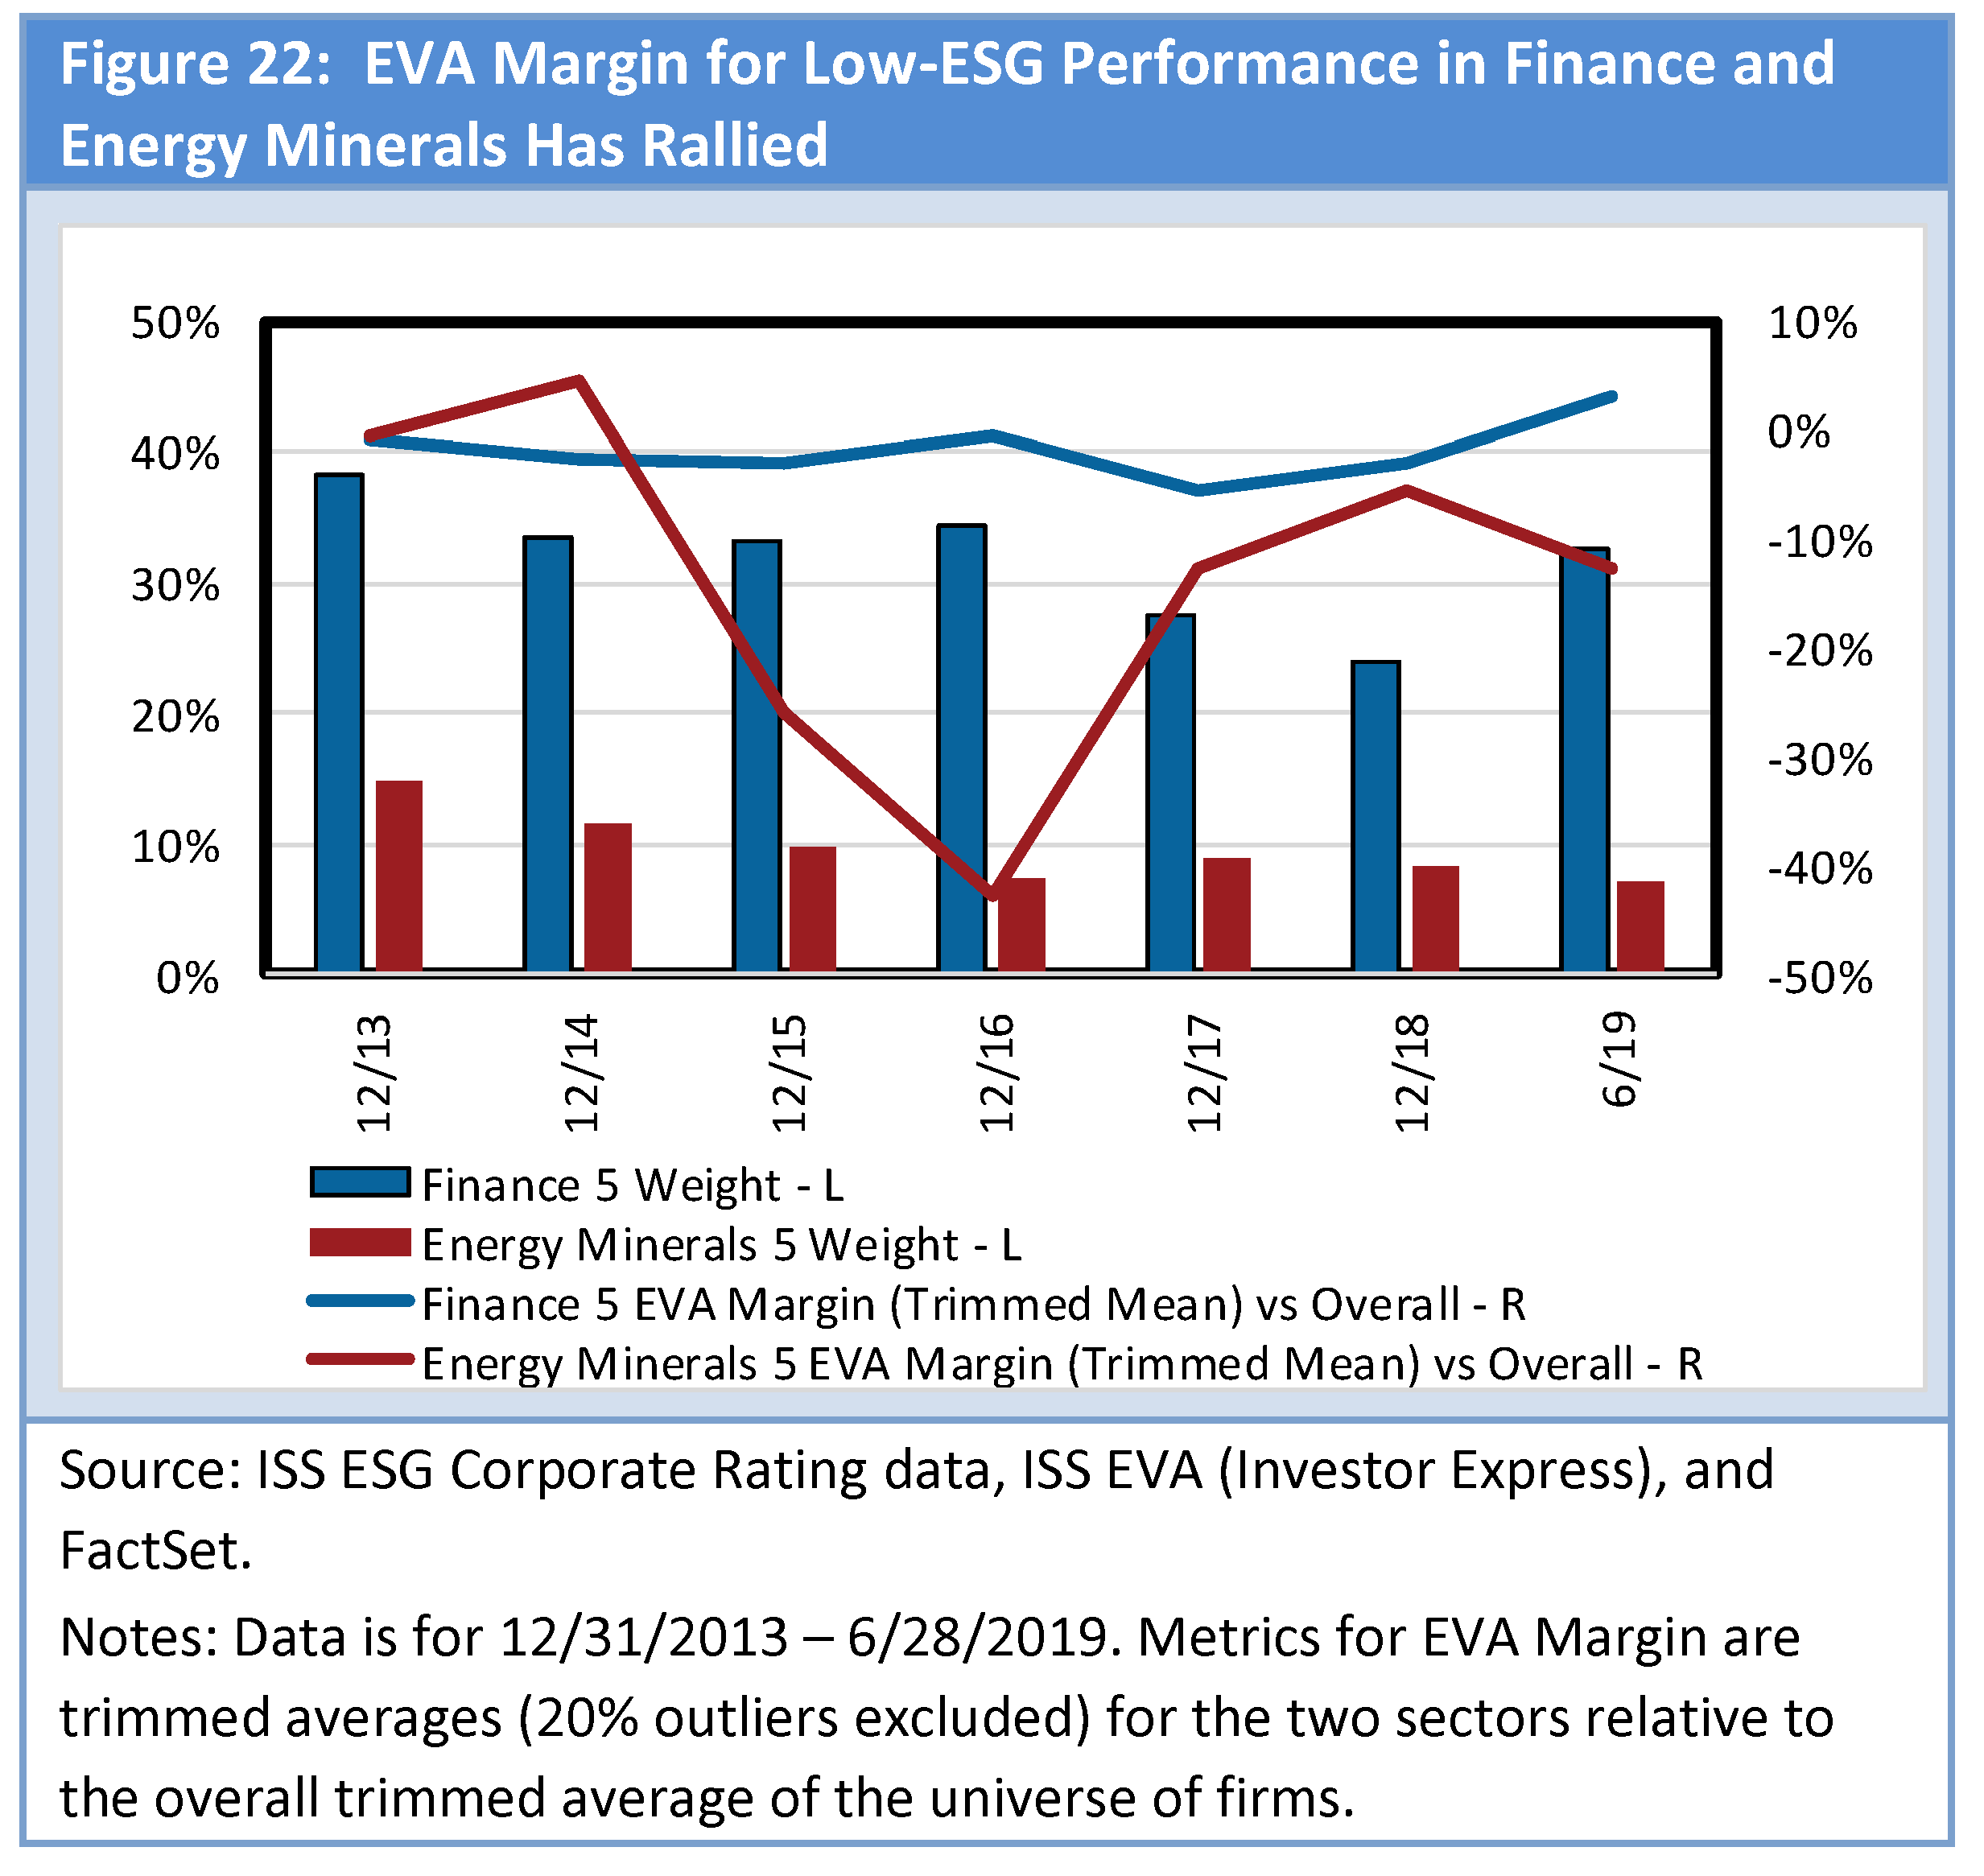
The main reason for the rally in EVA Margin for low-EVA Performance stocks is the improvement of relative EVA Margin for the finance sector from -5.4% in 2017, versus the overall trimmed average of the universe, to 2.9% mid- way through 2019 (figure 22). Since finance has a large weight (over 30%) of the 5s, this 8%+ change has over 2.4% impact on the overall EVA Margin for the low-ESG Performance stocks in figure 18. Also, EVA Margin rose significant for energy from the depths of oil prices in the first quarter of 2016. Relative EVA Margin for energy was – 42.6% in 2016 versus -13.0% in June 2019. Few energy minerals firms have high-ESG Performance (none since 2015 using end of year data), so the impact of oil prices has more effect on the low-ESG Performance universe than on the high.
EVA Margin also dropped modestly for high-EVA Performance companies this year. Relative EVA Margin for 1s for the higher-weighted technology services and consumer non-durables sectors have retreated. Finance is down a little, while producer manufacturing and health technology are close to flat.
Top-ESG Performance and EVA Margin Securities Tend to be in the Technology, Health Care, and Consumer Non-Durables Sectors
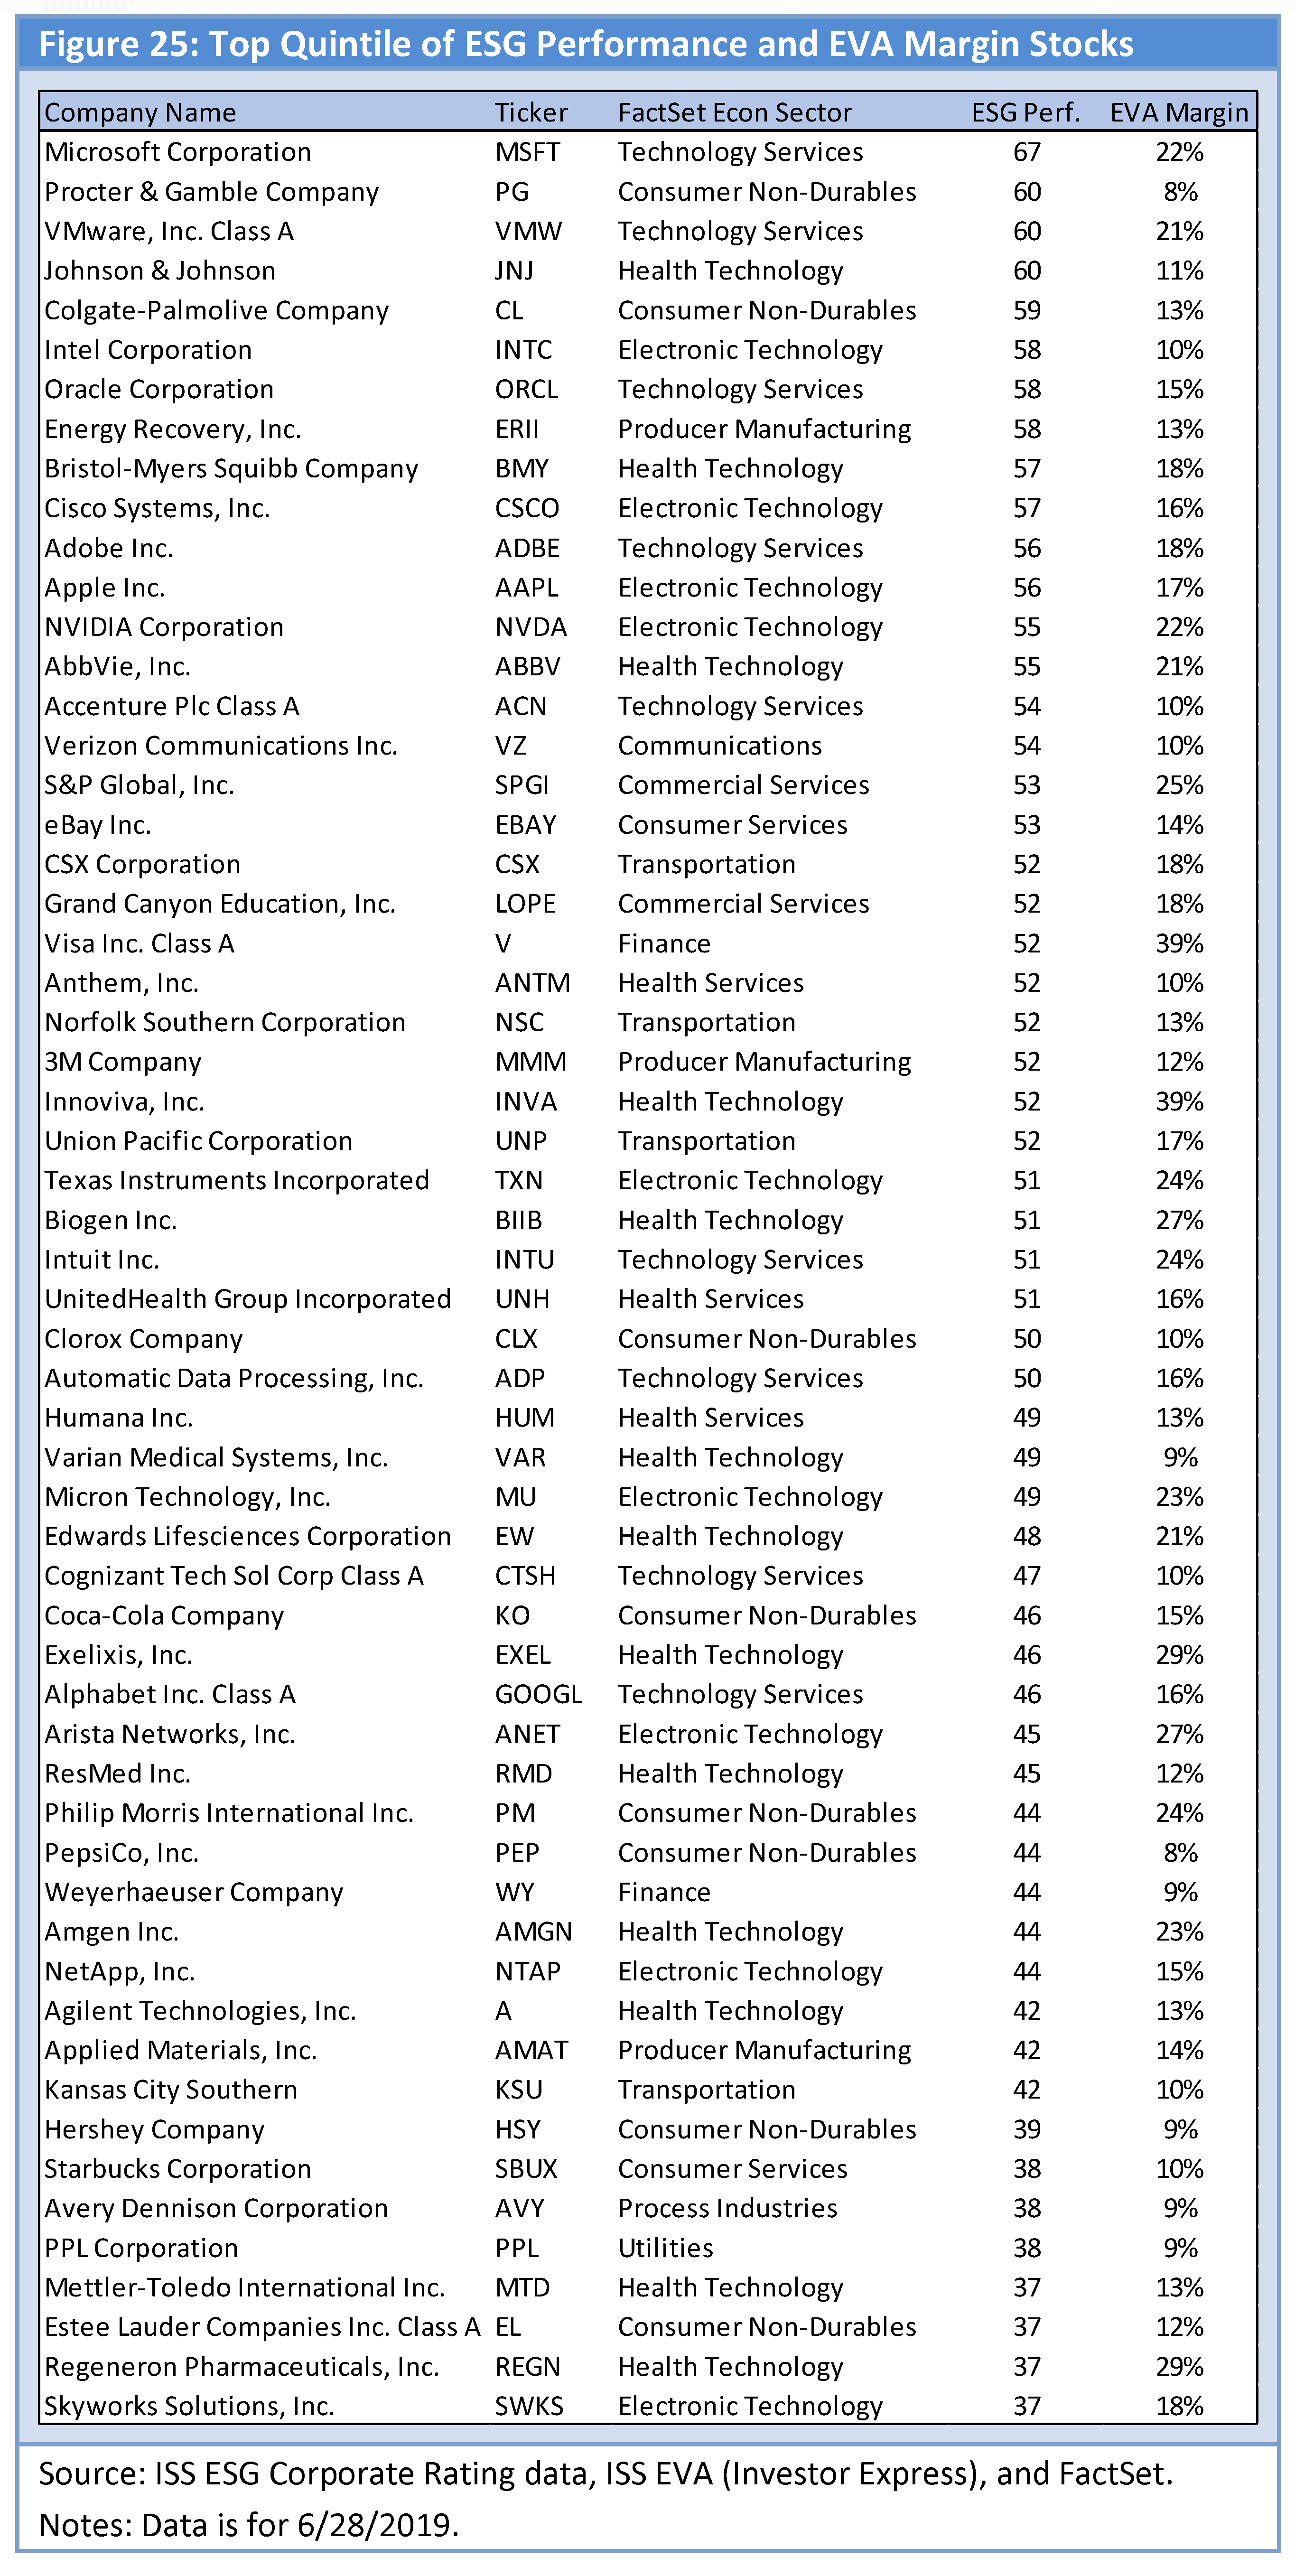
The top-ESG Performance and EVA Margin companies are in the technology, health care, and consumer sectors (figure 23). Specifically, health technology has the most top companies, followed by electronic technology, technology services, and consumer non-durables. The weights of these sectors in figure 23 are much higher than their overall percentages of the universe (figure 20), which means these sectors are on average better rated on ESG and more profitable.
Over time, as ISS has added new securities to its database of ESG companies, the ESG Performance of the top-rated companies has declined (figure 24). This has occurred at the same time as the EVA Margin of the top-ESG companies has risen. On the other hand, for the overall universe, the average ESG Performance and EVA Margin are about unchanged. This implies that the winners have been gaining on the poorer-rated companies. Overall, technology margins have risen as this sector has outperformed. The question then becomes, “Is this sustainable?”
Figure 25 shows the top-ESG Performance and EVA Margin securities. Microsoft is #1, followed by Proctor & Gamble. Companies in the table are first sorted by ESG Performance and then by EVA Margin. Technology, health care, or consumer non-durables companies make of nine of the top ten securities.