 Print
PrintExecutive Summary
At most U.S. firms, ownership is dispersedly-held and voting power is proportionate to capital at risk. At a minority of firms, however, a significant amount of the vote is controlled by one party through a sizeable ownership stake or, alternately, through a multiclass capital structure created specifically to allow voting power to be disproportionate to capital commitment. These controlling parties often include company founders and/or insiders whose interests may or may not conflict with those of unaffiliated shareholders.
The issue of control has received much attention since the initial public offerings of LinkedIn Corp., Zynga Inc., Groupon Inc., and Facebook Inc. While these firms were taken public amid great fanfare and high expectations, the results have been mixed. As of Aug. 31, 2012, the market price of LinkedIn Corp. had risen over 138 percent from its Sept. 16, 2011, initial public offering but Zynga Inc., Groupon Inc., and Facebook Inc. had fallen 72.0 percent, 79.3 percent, and 52.5 percent, respectively, from their IPO prices. A common feature of these firms is a capital structure that allows founders to control a majority of the voting stock while holding a comparatively small portion of their firm’s economic value.
Supporters of these structures claim that control of a firm’s voting power enables management to govern with minimal outside interference and focus on long-term business growth, ultimately delivering shareholders higher returns in exchange for control rights. Detractors, however, claim that control mechanisms misalign interest between affiliated and external shareholders and allow insiders to operate without the normal accountability mechanisms. This study attempts to contribute to that debate by examining the prevalence, characteristics, and relative performance of controlled companies listed on exchanges in the United States.
Key findings of the study include:
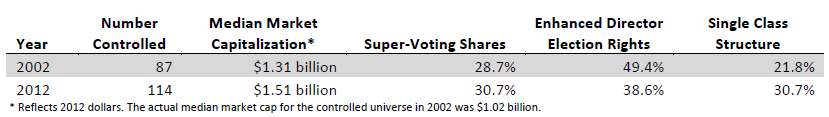
- The number of controlled companies has increased over the last decade. In 2002, there were 87 controlled firms in the S&P 1500 Composite; today, there are 114. Of these, 79 feature multiclass capital structures with unequal voting rights and 35 are controlled firms with a single class of voting stock.
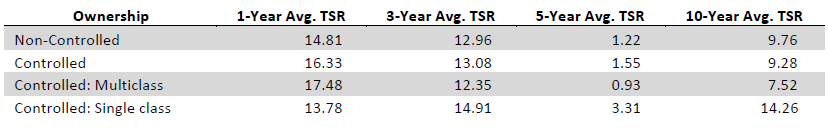
- Contrary to the theory, non-controlled firms outperform controlled firms over a 10-year period. Controlled firms with single-class capital structures outperformed those with multiclass capital structures and non- controlled firms over the three-, five-, and 10-year periods ended Aug. 31, 2012. Most importantly, and counterintuitively, control companies featuring multishare classes only outperformed over a one-year period, and materially underperformed over longer periods of time: the average 10-year total shareholder return for control companies with multiclass structures was 7.52 percent, compared to 9.76 percent for non-controlled companies and 14.26 percent for control companies with a single share class.
- Control companies have more material weaknesses in control environments and more related party transactions than non-control companies.
- Control companies with multiclass structures consistently exhibit materially more share price volatility than non-control companies. By contract, control companies with a single class of shareholders consistently exhibit more share price stability.
- Institutional investors cite concerns with investing in controlled companies, but generally do not have formal policies concerning such firms. Most investors report that controlled firms are less responsive or engage in less outreach than non-controlled firms.
- Since 2002, firms have eliminated controlling mechanisms has been outpaced by the number of new controlled firms. Nine firms within the S&P 1500 Composite that featured a controlling shareholder or shareholder group have eliminated a class of stock and are no longer controlled, while 26 controlled firms have joined the S&P 1500 since the beginning of 2003.
- The governance provisions of controlled firms with a single class of stock often differ from those with multiclass capital structures, and in some respects more closely resemble those of non-controlled firms. Controlled firms with a single class of stock have more conventional governance features with respect to board accountability and shareholder rights compared to controlled firms with multiclass capital structures.
The Universe of Controlled Firms
Control Mechanisms
There are two primary control mechanisms in the study group: multiclass capital structures with unequal voting rights (79 study companies) and ownership of 30 percent or more of single class of capital stock by a person or group (35 companies), of which six companies featured outright ownership of more than 50 percent. The study group does not include pyramidal ownership structures, which are more commonly found in non-U.S. markets.
Multiclass capital structures
Multiclass capital structures with unequal voting rights permit control of a firm through one or more classes of stock that entitle their holder(s) to enhanced voting rights relative to economic ownership. While this mechanism takes many forms, the two most common are those with super-voting shares, which carry more votes per share than other classes of voting stock (or entitle holders of a class to a fixed percentage of the total vote), and those which allow holders of one class to elect a fixed number or percentage (usually a majority) of board members. Firms that employ both of these features in their capital structure and those whose outside shareholders hold mostly non-voting shares are categorized in the latter group.
Super-Voting Shares
For 34 controlled companies, the control mechanism is a multiclass capital structure that includes at least one class of super-voting shares but does not provide exclusive rights to elect a certain number or percentage of board members. Most (32) of these firms have two classes of stock including one class of super-voting shares, while Lamar Advertising Co. and Seneca Foods Corp. have three classes and five classes of stock, respectively. The number of votes carried by each share of super-voting stock is fixed at 32 firms; in most cases, super-voting shares entitle their holder to 10 votes per share compared to one vote for other classes. At Interactive Brokers Group, Inc. and Ford Motor Co., the number of votes attached to each share of super-voting stock is adjusted by a formula to reflect insiders’ right to cast a certain percentage of the total voting power.
Most firms with super-voting shares adopt this form of capital structure prior to their initial public offering. Some firms restrict ownership of super-voting shares to insiders or require that such shares convert to common stock upon transfer to a non-controlling party. Notable exceptions are Berkshire Hathaway and Urstadt Biddle Properties Inc., which created new classes of common stock in 1996 and 1998, respectively. These firms’ founders had held considerable ownership stakes in their respective companies prior to creating these new classes of stock, which carry inferior voting rights relative to economic ownership. Neither of these companies has ownership restrictions on the original class of shares. However, subsequent share issuances at these firms have been mostly in the form of the newer classes of stock, which has enabled their founders to maintain a significant level of voting power over time.
At these firms, the controlling shareholders are generally company founders, their relatives, and/or their descendents. For example, at Tootsie Roll Industries, the controlling shareholders are CEO Melvin Gordon and his wife Helen, who serves as the company’s COO and is the daughter of a former executive of the firm who established a controlling stake in the firm subsequent to its initial public offering.
While super-voting shares can magnify a relatively small ownership stake, at nine controlled firms with super-voting shares, the controlling party owns at least 30 percent but less than a majority of the voting power. Other study companies were observed to have multiclass capital structures with unequal voting rights but no controlling shareholder. In these cases, the super-voting shares were widely dispersed or did not constitute a significant percentage of the total voting power.
Enhanced or Exclusive Director Election Rights
At 45 controlled companies in the study group, holders of at least one class of stock are entitled to elect a fixed number or percentage of board members. The voting rights at these firms vary: at 21 firms, holders of each class of stock vote separately for director nominees while at nine companies, holders of all classes vote together on certain nominees but not others. Fourteen members of this group have classes of non-voting shares including 11 where the non-voting stock is a majority of the aggregate number of shares outstanding. At nine firms, there are classes of stock with both super- voting shares and the exclusive right to elect a majority of the board. Four companies have classes of stock with limited voting rights, including Scripps Networks Interactive, Inc. and its former parent, The E.W. Scripps Co., where outside shareholders are entitled to elect a minority of directors but may not vote on other items. Further, Molex Inc. has non- voting shares as well as a mostly insider-held class of stock with exclusive rights to vote on matters other than director elections. At five companies — Brady Corp., EZCORP Inc., Eaton Vance Corp., Apollo Group., and Federated Investors, Inc. — all of the voting shares are closely held by insiders and there is no public market for any class of stock other than non- voting shares. At a sixth company, International Speedway Corp., descendents of the company’s founder control a majority of the class of stock with super-voting rights. Non-affiliated shareholders of these firms are effectively relegated to the status of silent partners.
Firms in this group share many characteristics with those with super-voting shares. Most are controlled by founders, their families, and/or their descendents and the control mechanisms generally date back to each firm’s initial public offering or spinoff from a parent company. It appears that only at International Speedway Corp. was the structure created following the company’s initial public offering.
Firms with Single Class Capital Structures
Thirty-five companies in the study universe have a single class of common stock and a party owning at least 30 percent of the outstanding shares. In addition to owning large economic interests, some controlling shareholders including those at HSN, Inc., Standard Pacific Corp., and Century Aluminum Co., are entitled under certain agreements to designate a minority of the board members. Firms in this category have comparatively fewer (16) controlling shareholders who are founders or members of a founder’s family. Controlling parties at 11 firms are non-executive investors, including seven who acquired a controlling stake subsequent to the firm’s IPO. At four companies, the controlling shareholder is a former parent company that retained a significant ownership interest, including British American Tobacco, which owns 41.8 percent of Reynolds America Inc.’s common stock. Three companies are controlled by non-founding executives; at a fourth, The Scotts Miracle-Gro Company, the controlling shareholder is CEO and Chairman James Hagedorn, whose ownership stake stems from the 1995 merger of the two entities which formed the company.
Firms in this category do not always maintain continuous control; in at least two cases, the controlling party’s ownership interest has fluctuated significantly over time. Saul Centers, Inc. founder B. F. Saul beneficially owns 37.5 percent of the company’s outstanding shares but owned only 17.9 percent in 1997.
Controlled Companies by Sector
Controlled companies are heavily concentrated in a handful of sectors (2-digit GICS code) and industry groups (4-digit GICS code). A majority of controlled companies can be found in only two sectors: the Consumer Discretionary sector, with 43 controlled companies, and the Industrials sector, with 19. Controlled companies are relatively scarce in capital- intensive industries: only two issuers in the Telecommunication Services sector and one in the Energy sector are controlled. None of the Utilities sector’s 66 constituents has a controlling shareholder. The table below breaks down the controlled company universe by sector.
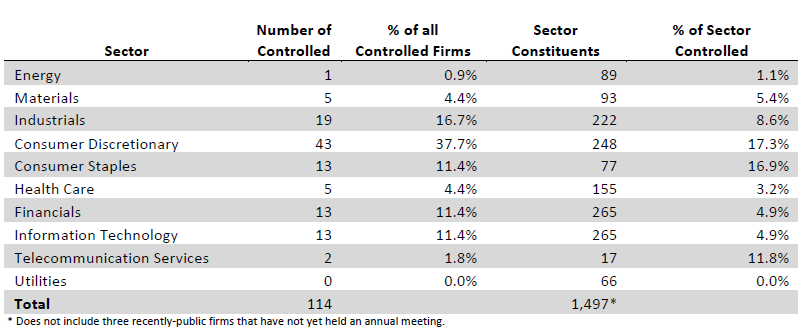
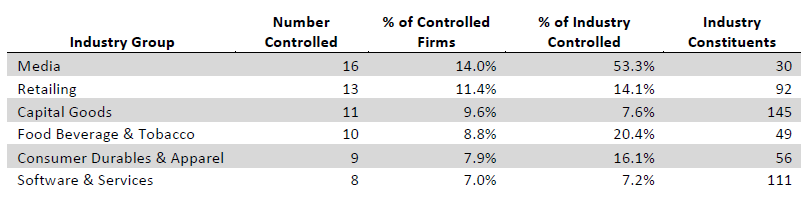
Controlled companies are found in 22 of the 24 industry groups represented in the S&P 1500 index. A majority of controlled companies are found in the top five sectors: Media (16), Retailing (13), Capital Goods (11), Food, Beverage & Tobacco (10), and Consumer Durables & Apparel (9). In addition to having the highest number of controlled companies, the Media group also boasts the highest concentration of controlled companies in the study group with 53.3 percent (16 of 30) of industry group constituents. In only one other industry group does the percentage of controlled companies exceed 20 percent: 20.4 percent (10 of 49) of the constituents of the Food Beverage and Tobacco group are controlled. Only the Utilities and Banks groups have no controlled companies.
Instances of control vary widely within sectors. Within the Consumer Discretionary sector, most Media companies are controlled, while only 1.9 percent in the Health Care Equipment and Services group are controlled. Similarly, within the Consumer Staples sector, more than 20 percent of study companies in the Food Beverage & Tobacco group were controlled compared to 6.7 percent of Food & Staples Retailing constituents. A discrepancy can also be found in the Financials sector, where controlled companies constitute nearly 10 percent of Diversified Financials, but none of the Banks constituents.
In certain industry groups, patterns were observed with respect to a preferred control mechanism. Controlled media firms overwhelmingly (13 of 16) have a capital structure that enables insiders to elect a majority of the board. Companies with control mechanisms in the Capital Goods and Food Beverage & Tobacco generally have multiclass capital structures with unequal voting rights at rates disproportionate to the prevalence of those structures. The Software & Services group had four companies in each of the super-voting share and single-class categories, but none with the right to elect a disproportionate number of directors. Of the industry groups with at least five constituents, only in the Materials group did a majority of controlled firms have a single class capital structure. The table below lists the controlled company universe by industry group.
Vintage Year
We refer to the “vintage year” of a company as the year in which the current control mechanism was established and/or the IPO year. Vintage years were determined using public company filings on EDGAR, company websites, share trading information, and conversations with company representatives. For controlled companies that do not disclose when control was established, the vintage year is the company’s IPO year.
The average “vintage age” of controlled companies in the study group is approximately 24 years. On average, controlled firms with multiclass capital structures (28 years) are “older” than firms with a single class of shares (16 years). Multiclass capital structures are found in the oldest controlled companies, including 27 of the 30 controlled companies with vintage years through 1980. At controlled firms with more recent vintage years (since 1995), the most common controlling mechanism is ownership of 30 percent or more of a company’s sole class of common stock. By industry group, Food Beverage & Tobacco firms were the oldest on average (43 years) of groups with five or more controlled constituents, followed by Commercial & Professional Services (34 years) and Capital Goods (32 years). The newest, on average, is the Software and Services group (11 years).
Most controlled companies have been controlled for as long as they have been publicly traded. Of the 51 controlled companies with a vintage year of 1995 or later, 27 were controlled at the time of their IPO, and nine were controlled when spun off of a larger entity. Eleven companies became controlled in connection with an investment; each of these firms has a single class of stock, which may suggest that investors have little appetite for the creation of capital structures that would diminish their voting rights. Two firms became controlled through acquisitions, and two more firms adopted dual-class capital structures with unequal voting rights; each was controlled at the time such structures were created, so the vote to adopt the dual-class structure was never in doubt and allowed perpetuation, rather than creation, of a controlled company.
Certain patterns were observed with respect to vintage year and control mechanism. Of the 27 controlled study companies that held have their IPOs since the beginning of 1995, 20 went public with multiclass capital structures. Only four of these firms have a class of stock that grants holders the right to elect a majority of board members. By comparison, six of the nine study companies that became public as the result of spinoffs have this feature, including four in the Media industry group.
Performance and Risk
Performance of Controlled vs. Non-Controlled Companies
The conventional argument for control companies is that control allows management to invest for the long-term, without regard to short-term pressures that may incent non-control companies to skimp on sensible investment in areas such as research and development, new product initiatives, etc. Somewhat counter-intuitively, non-controlled companies outperformed over a 10-year period, while controlled companies outperformed over shorter (1- 3- and 5- year) time frames.
Moreover, the performance data suggests a major performance difference according to the nature of the control mechanism. Multishare class companies underperformed non-control companies for all but the shortest time period, completely turning the conventional wisdom on its head. By contrast, single-class control companies showed a return pattern consistent with the theory, underperforming in the one-year period, but materially outperforming over longer time periods.
For the one-, three-, five-, and 10-year periods, the average annual total shareholder returns (“TSR”) for non-controlled companies were 14.81 percent, 12.96 percent, 1.22 percent, and 9.76 percent, respectively, compared to 16.33 percent, 13.08 percent, 1.55 percent, and 9.28 percent, respectively, for the controlled companies. Differences in performance were observed at controlled firms with a single class of voting stock and those with multiclass capital structures. Controlled firms with single class capital structures outperformed both non-controlled firms and controlled firms with multiclass structures over the three-year, five-year, and 10-year periods while trailing both over the one-year period. Non-controlled companies outperformed controlled firms with multiclass capital structures over the three-year, five- year, and 10-year periods. Adjustments were made to exclude returns for controlled firms for the periods during which they were not controlled. Similarly, for firms that were controlled in 2002 but are no longer controlled, returns were excluded for the periods during which they were controlled. The table below lists the TSR for controlled and non- controlled firms, as well as controlled firms with each of single-class and multiclass capital structures.
Risk at Controlled vs. Non-Controlled Firms
We have used two measures to identify risk at companies in the study universe: incidence of material weaknesses of internal controls and share price volatility. With respect to the former, companies with significant material weaknesses identified in the Section 404 disclosures potentially have ineffective internal controls, which may lead to inaccurate financial statements, hampering shareholders’ ability to make informed investment decisions, and may lead to the destruction of public confidence and shareholder value. Within the two most recent years, four (3.7 percent) controlled companies had a material weakness compared to 26 (1.9 percent) of the non-controlled companies.
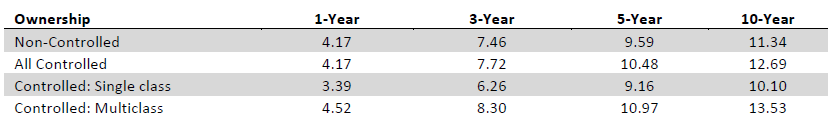
Volatility is a measure for variation of stock price over time and is a common measure of financial risk. Average volatility at non-controlled companies was lower than that for controlled companies for each of the one-, three-, five-, and 10- year periods ended Aug. 31, 2012, though volatility was nearly identical over the one-year period. As with performance, controlled firms with single-class capital structures differed from that of those with multiclass structures. On balance, controlled firms with a single class of stock exhibited lower levels of volatility than both non-controlled firms and controlled firms with multiclass structures in each of the periods reviewed, which suggests that investors assign less risk to firms in which a party — often a founder or investor — holds a controlling economic interest than firms whose economic ownership is more dispersedly held. The table below lists the average volatility (standard deviation) of controlled and non-controlled firms, as well as controlled firms with each of single-class and multiclass capital structures.
Frequency and Growth of Controlled Firms
The number of controlled companies has increased significantly over the last decade. From 2002 to 2012, the number of controlled companies in the S&P 1500 Composite rose from 87 to 114, an increase of 31 percent. The number of controlled companies increased in nearly all sectors, led by the Consumer Discretionary (nine) and Financials (seven) sectors. Only the Industrials sector incurred a net loss of controlled companies (from 14 to 11), while the Utilities sector did not have any controlled constituents in either year.
Market capitalizations are larger for controlled firms compared to 2002, a year in which most major equity indexes fared poorly. In 2002, the median market capitalization of the controlled firms was $1.02 billion; in 2012, the figure was $1.51 billion. Over the same period, the mean market capitalization of controlled companies increased from $4.6 billion to $10.7 billion, which reflected, among other things, the addition of Google Inc. ($209.8 billion) and Berkshire Hathaway Inc. ($189.2 billion) as controlled companies in the S&P 1500.
In both periods studied, multiclass capital structures with unequal voting rights were the most common control mechanism. In 2002, 63 controlled companies had a multiclass capital structure, including 25 with classes of super- voting shares and 43 with enhanced rights with respect to board elections. Only 19 percent of controlled firms had a single class of voting stock with a holder of at least 30 percent of shares outstanding. Since 2002, the proportion of firms with multiclass capital structures has declined as growth in this area has been outpaced by the number of controlled firms with single-class capital structures.
While controlled companies are highly concentrated in a relatively few sectors and industry groups, they are less concentrated than a decade ago. In 2002, constituents of the Consumer Discretionary and Industrials sectors accounted for 64.4 percent of all controlled companies, compared to 54.4 percent in 2012. Over the same period, the five sectors with the fewest controlled companies have seen their share of controlled companies rise from 6.9 percent to 11.4 percent, as newer controlled firms have appeared in sectors that previously had few or none.
Of the 87 controlled firms in the S&P 1500 Composite a decade ago, 59 were still in the index at the beginning of 2012. However, 15 of these firms no longer have a controlling shareholder: nine have since eliminated a class of voting stock and controlling shareholders at six firms have since divested their controlling interest. Twenty-one firms have since been acquired and seven firms are still traded publicly but are no longer index constituents. The table below shows key
characteristics of controlled firms in 2002 and 2012.
Comparison of Governance Features
Boards of Directors
Board/committee independence
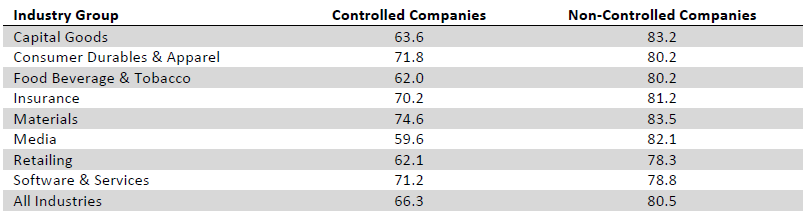
The average level of board independence is higher at non-controlled companies: 80.5 percent of non-controlled company directors are independent, compared to 66.3 percent at controlled companies. This discrepancy is due in part to exchange listing standards, which allow controlled firms to have a majority of non-independent directors. Seven controlled firms do not have a majority of independent board members and another three have 50 percent independence. Board independence levels are higher at non-controlled companies than controlled firms in all industry groups: average independence ranged from 75.8 percent in the Real Estate industry group to 86.0 percent in the Utilities group. At industry groups with five or more control company constituents, average board independence ranged from 59.6 percent at Media firms to 74.6 percent in the Materials group. Each of the four industry groups with the highest number of controlled constituents had lower-than-average levels of board independence. The chart below compares the average board independence levels at controlled and non-controlled firms for industry groups with a minimum of five controlled constituents.
Average independence levels on key board committees are also higher at non-controlled companies than at controlled firms. Audit committees, which are required by the SEC to be fully-independent, averaged 98.2 percent and 99.4 percent independence for controlled and non-controlled companies, respectively. A larger gap was observed at compensation committees, which average 95.4 percent independence at controlled companies and 99.4 percent at non-controlled companies. The widest gap in average independence levels was observed at nominating committees, whose members are not required to be independent under SEC guidelines. Nominating committees averaged 89.2 percent independence at controlled companies, compared to 98.9 percent at non-controlled companies. Of the 108 controlled companies for which data were available, 13 percent (14 companies) did not have separate nominating committees, compared to less than a half a percent (six of 1,383) non-controlled firms for which data were available.
Director election standard
Plurality voting is the default voting standard in most states. However, in recent years, majority voting coupled with a plurality carve-out for contested elections has gained favor with shareholders and has been adopted by about 80 percent of large-cap companies. A majority voting standard has been adopted by 47.9 percent of the non-controlled study universe; a substantial majority of these firms have also adopted a plurality carve-out for contested elections. Another 13.2 percent of non-controlled companies maintain a plurality voting standard but have adopted a policy whereby a director who received more “withhold” votes than votes “for” must tender his or her resignation. Majority voting standards are far less common at controlled companies where they are of limited value to non-controlling shareholders. Still, 14.8 percent of controlled companies have adopted majority voting requirements and another 7.4 percent have adopted director resignation policies.
Features that allow minority shareholders to gain board representation
Avenues through which minority shareholders can gain board representation are few and far between at controlled and non-controlled companies alike. One such avenue is cumulative voting, which provides shareholders access and influence over director elections by allowing them to amass all of their votes for directors and apportion these votes among one, a few, or all of the directors on a multicandidate slate. As such, through cumulative voting, minority shareholders can focus their voting power to elect one or more directors. At controlled companies, where majority insider control would preclude minority shareholders from having any representation on the board, cumulative voting could allow such representation. Currently, 7.4 percent of controlled firms and 5.9 percent of non-controlled firms allow shareholders to cumulate votes in board elections. Within the controlled company universe, 5.1 percent of firms with multiclass structures allow cumulative voting, but at single-class firms where cumulative could be used more effectively, 11.4 percent of firms offer this right.
CEO Compensation
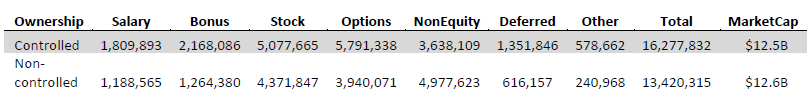
The median value for total CEO compensation was $3.6 million at controlled companies and $4.5 million at non- controlled companies, which had median market capitalizations of $1.51 billion and $2.12 billion, respectively. Note that comparisons of compensation at controlled versus non-controlled firms are confounded by factors such as differences in market capitalization for the two groups, disproportionate representation from certain industry groups and the absence of others, and insufficient sample sizes within controlled firm industry groups. However, the Media group presented the best opportunity for a comparison given similarities in size of the two groups, their market capitalizations, and their status as outliers in terms of compensation. At controlled Media companies, total compensation averaged $16.3 million compared to $13.4 million at non-controlled Media firms. Controlled components made greater use of equity-based awards ($10.7 million, compared to $8.3 million), while their non-controlled peers received higher cash awards ($6.2 million, compared to $5.8 million). The average base salary at controlled media firms of $1.81 million was 52.2 percent higher than the $1.19 million for the non-controlled group. The components of compensation for controlled and non- controlled media firms follow.
Shareholder Rights and Takeover Defenses
U.S. firms have a multitude of tools with which to defend against unsolicited takeover attempts, including classified boards, poison pills, and supermajority voting requirements. On the flip side, there are governance tools that shareholders can use to protect their rights as company owners, including the ability to call special shareholder meetings and act by written consent. Whether these tools should be viewed as consistent with, or contrary to, governance best practices, they should be viewed within the context of where they are employed, including whether the company is or is not controlled. On balance, this study finds that takeover defenses are less prevalent at controlled companies, which reflects their limited utility at such firms.
Supermajority Voting Requirements
Supermajority voting requirements require that certain voting items, such as amendments to the company’s governing documents or mergers, receive support from holders of greater than a majority of shares cast or outstanding, normally two-thirds, 75 percent, or 80 percent, to be deemed passed. Generally, supermajority voting requirements empower minority shareholders, regardless of whether or not a company is controlled. Supermajority voting requirements can serve as a takeover defense by deterring action that is not desired by holders of a substantial majority of the voting power. Shareholders of non-controlled companies often feel that supermajority voting requirements give minority owners the ability to block action that might be in shareholders’ best interests and promote board and management entrenchment. In recent years, shareholder proposals to reduce or eliminate supermajority voting requirements have averaged majority support at the ballot box. At controlled companies, however, supermajority voting requirements can protect minority shareholders by limiting or preventing a controlling party’s ability to act unilaterally on matters requiring a shareholder vote.
Supermajority voting requirements are less prevalent at controlled companies, whose controlling shareholders have little reason to support them. Supermajority voting requirements to amend the governing documents of a firm were found at 59.9 percent of non-controlled companies and 42.5 percent of controlled companies, while supermajority voting requirements to approve mergers were observed at 33.6 percent of non-controlled companies and 29.2 percent of controlled companies. In each case, a two-thirds vote was the most common supermajority threshold.
Shareholders’ Right to Call Special Meetings and Act by Written Consent
As with supermajority voting requirements, shareholders’ right to act between annual meetings can be viewed differently by minority shareholders at controlled and non-controlled companies. At a non-controlled company, shareholders may use their right to propose business between annual shareholder meetings to remove directors or force a vote on a merger not favored by the board. Accordingly, these rights can be viewed as potential checks on entrenchment. At controlled companies, the right to act between meetings has little real value for minority shareholders. For insiders, however, the right to act between meetings — particularly through the use of written consent — can give insiders the ability to act quickly and unilaterally, albeit with minimal transparency.
The right of shareholders to act by written consent is more prevalent at controlled companies: 51.9 percent of controlled companies allow action by written consent compared to 26.2 percent of non-controlled firms. These percentages do not include a shareholder right to act by unanimous written consent only, which is unusable at widely-held companies.
Shareholders have the right to call special meetings at 54.6 percent of controlled companies compared to 49.6 percent of non-controlled companies. At most controlled companies where shareholders do have the right to call special meetings, the threshold to use this right is a majority or greater of the outstanding shares, which generally allows only the controlling shareholder to utilize this right. By comparison, majority thresholds to call special meetings were observed at only 36.4 percent of non-controlled companies that allow shareholders this right.
Classified Boards
Most states, including Delaware, the legal domicile of a majority of U.S. companies, authorize boards to be divided into three separate classes so that only one-third of the board stands for election in a given year. Classifying the board makes it more difficult to change control of a company through a proxy contest involving the election of directors. In recent years, however, classified boards have fallen out of favor as investors have argued that staggered board terms reduce directors’ accountability and promote management and board entrenchment.
The ownership structures of controlled companies typically reduce, if not eliminate, their vulnerability to an unsolicited change in control, and thus reduce the usefulness of classified boards. Because classified boards provide little benefit to insiders at controlled companies, it should come as little surprise that relatively few controlled companies have them: only 24.5 percent of controlled firms have a classified board, compared to 43.9 percent of non-controlled companies. While some may question the benefit of annual elections, it is worth considering that annual elections can serve as a useful feedback mechanism for boards at controlled as well as non-controlled companies.
Poison Pills and Blank Check Preferred Stock
Poison pills deter unsolicited takeovers by forcing potential acquiring parties to negotiate with the board or face massive dilution of their stake if they exceed a specified ownership level. Poison pills, also called shareholder rights plans, are found at a minority of controlled and non-controlled companies, just 11.1 percent and 14.2 percent, respectively.
Like poison pills, blank check preferred stock gained popularity at U.S. companies amid a wave of hostile takeover activity during the mid-1980s. Companies could place the shares with a friendly party — a “white knight” — in response to a hostile takeover attempt — or issue the shares to a friendly party before a tender offer was threatened. Attributes of the shares were unspecified and could be issued at the board’s discretion. While blank check preferred shares continue to serve as a takeover defense, such shares have generally been used for routine financings. Blank check preferred shares are a common feature at controlled companies (86.1 percent) and non-controlled companies (94.0 percent).
Differences in Governance Features among Controlled Firms
The prevalence of certain governance features at controlled firms with single-class capital structures often differs from those with multiclass capital structures such that the governance features of the former are often more like those of non-controlled firms than firms with multiclass structures. Additionally, where there are differences between controlled and non-controlled firms, controlled firms with single-class capital structures tend to straddle the fence between the two, whereas controlled firms with multiclass capital structures tend to be the outlier. As such, differences between controlled and non-controlled firms tend to be more attributable to controlled firms with multiclass structures than those with single class structures.
For example, controlled firms with single-class structures have higher average levels of full board, compensation committee, and nominating committee independence than controlled firms with multiclass structures, though they trail the independence levels of non-controlled firms. Additionally, controlled firms with a single class of stock have annual elections and majority voting standards in proportions between those of controlled firms with multiclass capital structures and non-controlled firms. In terms of takeover defenses, controlled firms with single-class capital structures more closely resemble non-controlled firms in prevalence of poison pills and supermajority voting requirements to amend the charter or bylaws, while they authorize blank-check stock at a level between those of controlled firms with multiclass capital structures and non-controlled companies. Single-class controlled companies allow for the right to call special meetings at levels closer to non-controlled firms and have related-party transactions at less than one-half the levels of other controlled firms and at a frequency slightly above that of non-controlled companies.
Related-Party Transactions
Instances of related-party transactions were observed at a higher rate at controlled companies: 14.8 percent of these firms had engaged in related-party transactions, compared to 7.2 percent of the non-controlled group. The average values of the transactions did not differ substantially at controlled vs. non-controlled firms ($10.1 million vs. $10.2 million, respectively).
Alignment Between Controlling and Unaffiliated Shareholders
Voting results from shareholder meetings can be used to measure alignment between controlling and unaffiliated shareholders. By comparing the voting results at controlled firms as reported to the SEC with those excluding the controlling party’s vote, it is possible to see whether, and to what extent, the votes of controlling and unaffiliated shareholders differ on a given voting item. On balance, the voting results show misalignment between controlling and unaffiliated shareholders in cases where there are concerns or shareholder-sponsored initiatives.
Vote results for shareholder proposals at controlled companies with meeting dates from July 1, 2011 through June 30, 2012 showed a gap between controlling and unaffiliated shareholders: of the 24 shareholder proposals that went to a vote during this period, support averaged 17.2 percent of votes cast, but 38.1 percent support from unaffiliated shareholders. Of these, only one proposal was deemed passed, a proposal filed at Comcast (where insiders control 34 percent of the voting power) to submit the company’s poison pill to a shareholder vote that received 52.1 percent support. Additionally, four shareholder proposals to conduct a recapitalization so that each share of stock would be entitled to one vote averaged 69.8 percent support from unaffiliated shareholders but just 27.8 percent support overall.
A similar lack of alignment was observed at controlled firms in cases of “vote no” campaigns. Proxy contests are seldom launched at controlled firms: not one of the controlled companies in the study has been the target of a recent proxy contest, which typically requires a party to incur significant expenses and presents little prospect for success at a controlled firm. However, since mid-2011, shareholders of Wal-Mart Stores, Inc. and News Corp. have taken the less expensive alternative of orchestrating “vote no” campaigns at certain directors of these firms. Specifically, investors targeted Wal-Mart directors with an insufficient response to an alleged bribery scandal; targeted directors received support as low as 84.3 percent support, or 61.9 percent support from unaffiliated shareholders. At News Corp., concerns related to a phone hacking scandal led to four directors receiving less than 70 percent support. Excluding the controlling stake held by Rupert Murdoch, these four directors failed to clear 40 percent support.
Institutional Shareholder Views
We held discussions with representatives of six institutional investors, comprised of four asset managers and two asset owners, to gain insight into their policies and experiences regarding controlled companies.
Most investors reported that their experiences with respect to investing in controlled companies have differed from those with non-controlled firms, particularly in the area of engagement. Five of six respondents reported that controlled companies tend to be less responsive or conduct less outreach than their non-controlled counterparts, with most attributing this to the certainty of vote results at controlled companies. These experiences may lead to low expectations at controlled companies and perhaps reluctance to engage with them. One asset manager occasionally engages with controlled firms but suggested that doing so is generally not a good use of time. A representative of an asset owner responded that most engagements with controlled companies are unproductive, and feels that controlled companies focus on compliance with stock exchange listing requirements (which the investor representative views as weak) as opposed to best practices. In addition to observing differences with respect to engagement, one respondent expressed concerns that markets sometimes discount shares of controlled companies. Further, one individual noted that disclosure tends to be weaker at controlled firms. One institutional investor representative noticed little or no differences with respect to investing in controlled vs. non-controlled companies.
Although most investors surveyed acknowledged differences relating to investing in controlled versus non-controlled companies, none of the institutions surveyed reported having formal policies with respect to investing in, or engaging with, controlled companies. Still, three institutions reported that a firm’s status as a controlled entity is always or sometimes considered in the investment process. Two of these firms reported that whether a firm is controlled is one of many factors considered, while a third responded that it depends on the fund manager. One firm added that it generally excludes shares of controlled companies from the calculation of target weight or, in extreme cases, avoids investing in controlled firms altogether. Of the three firms that did not report considering the issue of control in the investment process, two indicated that their voting policies generally reflect a preference for the “one-share, one-vote” principle.
Recent Trends
The Recent IPO Market
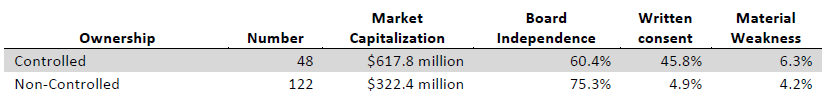
From Jan. 1, 2010, through March 28, 2012, 170 U.S. companies had conducted an initial public offering and held a shareholder meeting, including 48 controlled companies. Twenty of these recently public controlled firms feature a multiclass capital structure with unequal voting rights while 28 have a single class of stock and a party controlling at least 30 percent of the shares outstanding. (Note that Facebook was not included in the study because its initial public offering was after March 28, 2012.)
The Diversified Financials and Retailing groups led all industry groups with six recently public controlled firms apiece. Recently public controlled firms include five firms in the Energy group, which had no controlled constituents in the S&P 1500 in 2002 and only one at the beginning of 2012. By contrast, the Consumer Durables & Apparel group had nine constituents in the S&P 1500 at the beginning of 2012 but none in the recent IPO group. The median market capitalization of recently public controlled firms is nearly twice that of their non-controlled peers.
In terms of governance, recently public controlled firms exhibit many of the same traits as older controlled firms, including lower average levels of board and committee independence, comparatively fewer instances of supermajority voting requirements to approve mergers and amendments to the governing documents of firms, and higher levels of material weaknesses than non-controlled firms. The right to act by written consent was significantly higher in the controlled company group (45.8 percent) than the non-controlled group (4.9 percent). The table below lists features of controlled and non-controlled IPOs between Jan. 1, 2010, and March 28, 2012.
It is worth noting that some of the recently public controlled firms, particularly those with a single class of common stock, will cease to be controlled in the coming years as controlling shareholders, especially venture capital and private equity firms, reduce their ownership interests. As these firms transition from their newly public ownership structure to a more dispersedly held structure they will likely add independent board members and consider other changes to their governance structures.
To gain insight into the factors that have caused recently public firms to select controlling structures, we held discussions with representatives of investment banks who have been involved in initial public offerings and spinoffs of controlled firms.
Recent IPOs: Banker Perspectives
Representatives from both investment banks pointed out that most recently public controlled companies were backed primarily by venture capital and/or private equity firms, not founders or individuals, and that these firms typically have single-class capital structures. According to one banker, these firms typically view controlled company exemptions under exchange rules as a free option. Since these firms’ ownership structures entitle them to take advantage of these exemptions and because their boards include a significant number of investor representatives, most do not hesitate to do so. It is worth noting that most of these firms do not remain controlled indefinitely; private equity and venture capital investors rarely maintain controlling stakes in public firms. However, some of these firms signal to potential investors plans to transition to a more traditional governance structure with independent directors.
In contrast, firms that elect to go public with a multiclass capital structure to ensure control generally desire to stay controlled for the long-term. Bankers cite the desire of a founder to maintain control and tax reasons as the two primary reasons why firms select this form of controlling structure. With respect to the former, founder/CEOs who select a controlling structure often expect to be involved in the business for many years to come and simply wish to run it with minimal outside interference. As for the latter, one banker stated that many of the spinoffs that occurred during the last decade were structured as controlled companies in order to minimize taxes that might otherwise result from such a distribution.
The bankers interviewed were of the view that controlled company structures generally do not hinder a firm’s ability to sell shares, though there are exceptional cases. One banker reports that investors do not want to miss opportunities and that when investors do have concerns about a firm’s controlled status, they are generally inclined to give the firm the benefit of the doubt. A second banker responded that investors may respect when a founder has control if she personifies the business; in a sense, these investors are betting on a vision. This individual felt that investors would not be comfortable investing in a firm structured for long-term control by a private equity or venture capital firm. Further, this banker noted that investors occasionally cite governance concerns to gain leverage in discussions about a firm’s valuation.
Efforts to Create/Eliminate Controlling Mechanisms
In recent years, the number of firms that have sought to create new classes of common stock has outpaced those seeking to eliminate such classes. Since 2010, 17 firms have proposed the creation of new classes of stock, including Biglari Holdings, which sought investor approval to create a new class of common stock with inferior voting rights relative to economic rights, but ultimately terminated this effort amid investor scrutiny. Additionally, in 2012, Google sought and received investor approval of a new class of non-voting stock. Although Google is currently controlled by its two founders, the new class of non-voting shares could help to perpetuate the firm’s controlled status. By comparison, 10 firms have proposed to eliminate a class of common stock since the beginning of 2010. Two of these firms, Benihana, Inc. and Aaron’s, Inc., collapsed their multiclass capital structures into one class; the remaining firms eliminated classes of stock for which there were no shares outstanding. Only Aaron’s transitioned from a controlled to non-controlled firm as a result of the recapitalization. Shareholder-led efforts to eliminate controlling mechanisms have generally been unsuccessful. Since 2010, investors have voted on eight shareholder proposals to eliminate multiclass structures, with none receiving majority support.
Conclusion
The findings of this study are consequential for both investors and controlled firms. Most of all, it has demonstrated that control matters. Controlled companies featuring multiple classes of shares generally underperform over the long term, are perceived as having more financial risk, and offer fewer rights to unaffiliated shareholders than dispersedly owned firms. This study has also shown that not all controlled firms are created equal: The form of control matters. Firms in which the controlling party’s voting power and economic power are aligned outperform other controlled companies while offering unaffiliated shareholders comparatively more rights.
These findings present a serious challenge to advocates of controlled firms and their claims that such structures ultimately benefit all shareholders. While insiders may favor the combination of public market liquidity with private market autonomy, it does not appear that shareholders benefit from this arrangement.
Study Methodology
The study examines firms in the S&P 1500 Composite Index as of Jan. 1, 2012. Three recently public index constituents had not yet held an annual meeting and were excluded from the study group due to limited information. In addition, certain data were not available for six closely held firms that do not file Form Def14A (proxy statements) with the SEC. This study also includes discussions with representatives of six institutional investors and two investment banks to provide context to observable findings. The investor and banks were promised confidentiality so as to allow them the maximum amount of freedom to comment on the findings.
A controlled company is generally defined as one in which an individual or a group collectively owns a majority of a firm’s voting stock, or is entitled to elect a majority of directors. However, this definition does not take into account firms with owners of substantial but non-majority stakes that enable these investors to effectively control voting outcomes at these firms. These investors are often founders or executives, whose stakes are magnified by their insider status as well as by non-participation in the voting process by certain shareholders. In addition, the standard definition of a controlled company does not include shareholders with a common link — such as family members and co-founders — who may effectively exercise control over voting results by acting in concert. In practice, there is no bright-line test for “control.” Therefore, we have broadened the definition of control to include any person or group owning 30 percent or more of a company’s voting power; In selecting 30 percent as a threshold for control, we considered that the major U.S. exchanges assume that a change of control has occurred in certain cases when a party acquires as little as 20 percent of the voting power. In addition, at firms wherein a person or group has the ability to elect a substantial number (40 percent or more) of the board, that party will be considered a controlling party for the purposes of this study.
Note that director independence has been defined as independence under ISS’ 2012 U.S. Proxy Voting Guidelines, which differ in several respects from SEC and exchange guidelines. Data related to executive compensation have been provided by ISS’ ExecComp Analytics and may differ in some respects from disclosure in a firm’s proxy materials.
One Trackback
[…] like Zynga, Facebook, and NewsCorp really more responsible? For a contrasting study, see Controlled Companies in the S&P 1500: Performance and Risk Review, which found non-controlled firms outperform controlled firms over a 10-year period. The type of […]