 Print
PrintMatteo Tonello is Managing Director of ESG Research at The Conference Board, Inc. This post is based on a Conference Board memorandum by Merel Spierings, in partnership with ESG data analytics firm ESGAUGE and in collaboration with Debevoise & Plimpton, the KPMG Board Leadership Center (BLC), Russell Reynolds Associates, and the John L. Weinberg Center for Corporate Governance at the University of Delaware.
As boards grapple with a wider array of ESG issues and seek to take the interests of multiple stakeholders into account—all amidst significant economic, social, and geopolitical upheavals—we are seeing not only an evolution in the composition of US corporate boards but also meaningful changes in board leadership structures, board meeting practices, and committee structures.
If “diversity” is a key theme in US board composition as boards become more demographically diverse with a greater focus on functional expertise in areas such as technology, finance, and operations, then “variety” is the corresponding theme in board leadership, meeting practices, and committee structures.
- We are seeing an increase in the percentage of companies where the board chair is an independent director. This is not being driven by an overriding wave of shareholder sentiment, however, but rather by company-specific circumstances that are leading to different permutations of board leadership structures that unfold over time.
- While the number of board meetings has fallen from a peak during the first year of the COVID-19 pandemic, the number remains somewhat elevated. Boards are experimenting with different approaches to the timing and format of board and committee meetings and with the use of informal convenings to maintain a high level of communication.
- The majority of boards at public companies with over $5 billion in annual revenue now typically have four or five committees, rather than the three generally called for by stock exchange listing standards. But with few exceptions, there is little overall consistency in the types of additional committees that boards have established to grapple with their expanding responsibilities.
This post provides insights about board leadership, board meetings, and board committees at S&P 500 and Russell 3000 companies. Our findings are based on data pulled on June 8, 2022 from our live, interactive online dashboard powered by ESGAUGE, as well as a Chatham House Rule discussion with leading in-house corporate governance professionals held in April 2022. Please visit the live dashboard for the most current figures. [1]
Insights for What’s Ahead
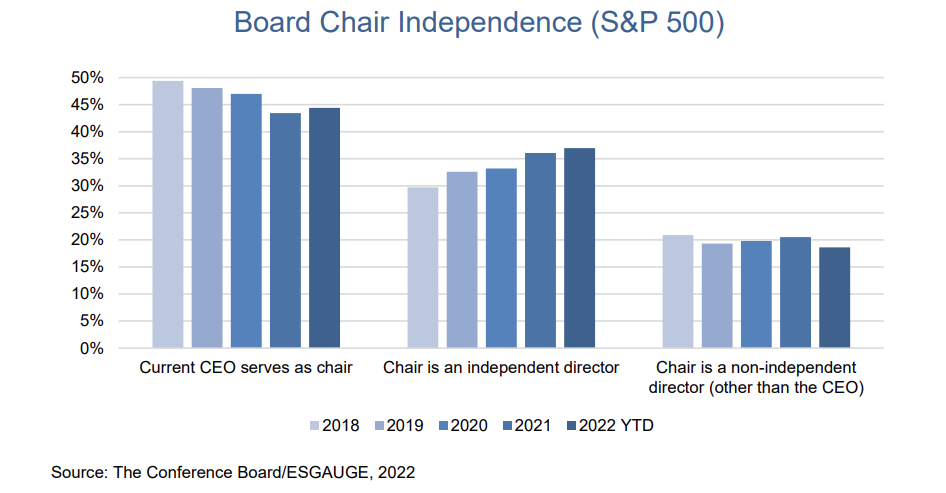
- The ongoing increase in board chair independence is likely driven by CEO succession events, as well as the growing workloads of boards and management, rather than shareholder proposals calling for CEO/board chair separation. The percentage of S&P 500 companies with an independent board chair has grown steadily from 31 percent in 2018 to 37 percent as of early June 2022. [2] At the same time, shareholder support for such proposals remains in the 30 percent range and, in fact, dropped from 35 percent in 2020 to 28 percent this proxy season. A potential driver for the rise in board chair independence is the increased workload of boards and management, as they grapple with a multitude of crises, fundamental transitions in business models, and growing demands for companies to address ESG issues and the needs of stakeholders. In this environment, a majority of companies favored having two leaders at the helm—with the (either independent or non-independent) chair focusing on the board and the CEO on management. Others have chosen a single point of accountability with one individual holding the CEO and chair roles. A key catalyst for naming an independent chair is CEO succession, which has increased recently and provides an opportunity for the board to reconsider its leadership structure. For example, of the 27 CEO succession announcements through June 21, 2022, only one firm chose to replace a departing CEO/board chair with someone who will assume both positions. By comparison, nine firms (33 percent) chose to have the former CEO remain as a non-independent chair—which is often for a transition period of a few years, after which some boards will name the current CEO as chair, while others will choose to name an independent chair. Thus, the recent uptick in CEO succession announcements could have an ongoing impact in driving the trend toward independent board chairs as some former CEOs, who are now serving as non-independent chairs, may step down in the coming years and be replaced by independent chairs.
- Just as the decline in the reported percentage of board members with business strategy experience at smaller companies is worrisome, so is the decline in the percentage of independent chairs with such experience—and this trend may accelerate. [3] While the percentage of independent board chairs at S&P 500 companies with strategic experience has increased in recent years, it declined by three percentage points across the broader Russell 3000, from 79 percent in 2018 to 76 percent in 2022. This trend threatens to worsen in the Russell 3000, as the percentage of directors with strategic experience at the Russell 3000—the primary pool from which independent chairs are drawn—declined even more, from approximately 68 percent in 2018 to 63 percent in 2022. Having strategic experience is critical for an independent chair in collaborating with the CEO, setting the board agenda, managing board conversations, and serving as a liaison between the board and management. Even more importantly, such experience can help directors discern from discussions with management and fellow directors key opportunities and risks that should be addressed by management and at future board meetings. Companies should consider including business strategy experience as a key requirement when choosing independent chairs.
- The number of board meetings is likely to stay at an elevated level, due to factors beyond the ongoing pandemic. The pattern of the number of meetings held by public company boards resembles a barbell: the majority of companies have fewer than eight board meetings a year, while the next largest group of companies has twelve or more, a number which typically suggests such companies are experiencing some form of acute event, whether a business crisis, government investigation, or major M&A deal. While that pattern is likely to persist, we expect to see an elevated average number of board meetings (8.3 in the S&P 500 during 2021, as compared to 7.8 in 2019) going forward. The increase is likely due to multiple crises unfolding globally (including the ongoing pandemic and war in Ukraine); business challenges ranging from talent management to digital transformation; and increasing regulatory burdens in areas such as cybersecurity, climate change, and human capital management. While some directors have welcomed the return to in-person meetings, boards are likely to continue to use virtual and hybrid meetings to accommodate extra or unanticipated demands as they have grown comfortable meeting remotely during the pandemic.
- Board meetings (at which minutes are taken and which count toward director attendance requirements under SEC disclosure regulations) can be usefully supplemented by informal board calls or virtual meetings, which are well-suited to bring the board up to speed on specific issues where no board decisions need to be taken. As our discussion with in-house corporate governance professionals revealed, these sessions can be particularly useful not just to address breaking developments during a crisis, but also for deeper dives or more (informal) time with the CEO to discuss topics that may not merit an item on a board agenda or to augment the board’s understanding of ESG issues. Boards may wish to consider planning a few informal calls in between regularly scheduled board meetings, even if there is no current crisis requiring a gathering.
- To manage the increased workload falling on board committees, companies may want to consider having their board committees meet (virtually) the week before the in-person board meeting. A common approach for companies is to hold in-person board committee meetings on one day, followed that evening by an informal board dinner, and the next day by a full board meeting. Some larger companies are currently experimenting with a different approach, in which some or all committees meet the week before the full board meeting. This has allowed them to hold longer committee and board meetings to accommodate an increased workload. There can be challenges with this approach, especially if committees meet only virtually throughout a year. We expect to see continued experimentation in the timing, length, and nature (hybrid, virtual) of committee meetings going forward.
- Just as we are expecting boards to try different approaches in holding committee and board meetings, we also expect them to explore a variety of approaches to committee structures to accommodate the expanding array of risks and increased workload. While public companies with under $5 billion in annual revenue typically have just three committees (audit, compensation, and nominating/governance), larger companies tend to have four or five standing committees. This demonstrates that larger companies have already moved beyond simply satisfying the stock exchange listing standards and other regulatory requirements. We expect the next few years will bring an era of experimentation, as companies try different approaches to address a broader array of environmental and social risks, associated stakeholder expectations, and regulatory requirements. Indeed, a single company may deliberately change its own approach over time, establishing a temporary structure to establish a sustainability program, and then a different approach once the program is up and running.
- To avoid overburdening the audit committee, it may be helpful to have the audit committee focus on overseeing overall risk management processes and disclosure and have other committees focus on the substantive aspects of ESG issues, such as talent management and diversity, equity & inclusion. For example, while the audit committee could be responsible for the risk assessment process relating to topics such as climate and employee health and safety, other committees, such as the compensation committee, could take the lead in addressing the substantive aspects of human capital management oversight.
Board Leadership
Board Chair Independence
- The trend toward board chair independence continues—especially at larger companies—and, with the recent increase in CEO succession events, has the potential to increase in the coming years. In the S&P 500, the percentage of companies combining the roles of CEO and board chair declined from 49 percent in 2018 to 44 percent as of June 2022. At the same time, the share of companies with an independent board chair grew from 30 percent in 2018 to 37 in 2022. In the Russell 3000, where CEO/board chair separation has been more common, the decline in percentage of companies with a combined role was less pronounced, from 37 percent in 2018 to 35 percent in 2022. In that index, the share of companies with an independent chair grew from 42 percent in 2018 to 45 percent in 2022.
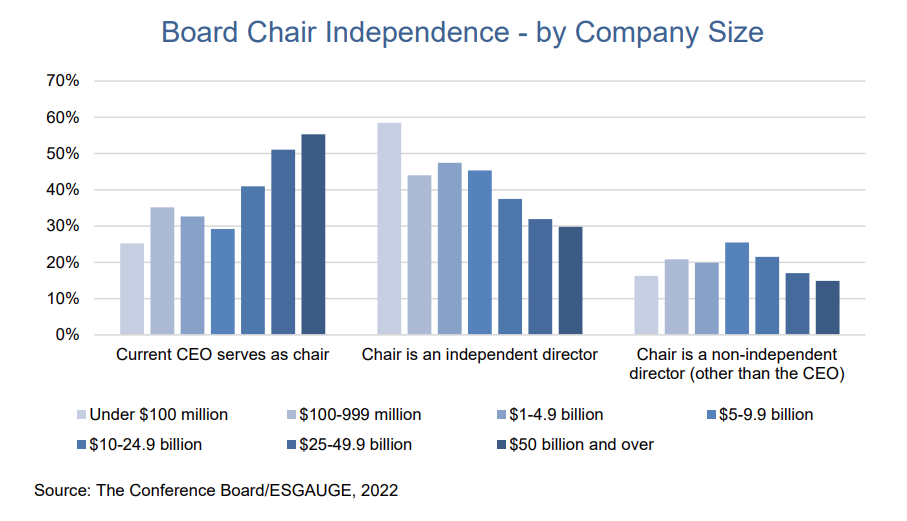
- There’s a direct relationship between company size and board leadership model, with larger companies generally more likely to combine the CEO/board chair role and smaller companies more likely to have an independent board chair. [4] As of June 2022, the CEO also served as chair at a majority of companies with annual revenue of $50 billion and over (55 percent). For companies with an annual revenue under $100 million, this percentage was only 25 percent. Similarly, a majority of the smallest companies have an independent chair (58 percent), whereas for the largest companies this percentage is only 30 percent.
- Across business sectors in the Russell 3000, a combined CEO/board chair role is most common at companies in the consumer staples (42 percent) sector, followed by those in utilities (40 percent). This makes sense as these sectors have the highest share of companies with annual revenues of $10 billion and over (27 and 26 percent, respectively). By contrast, in the health care sector, where a majority of companies (52 percent) have annual revenues under $100 million, companies are least likely to combine the CEO/board chair role (29 percent—six percentage points below the average) and most likely to have an independent chair (56 percent—nine percentage points above the average).
CEO/Board Chair Combination or Separation Policy and Rationale
- Virtually all companies have adopted a formal policy on board leadership, and the vast majority of such policies give the board the flexibility between CEO/board chair separation and combination, depending on specific company circumstances. As of June 2022, just 17 percent of S&P 500 companies specifically stated that the CEO and board chair roles should be separated, which compares to 22 percent in the Russell 3000. In both indexes, about 10 percent of companies have a policy that explicitly requires the model of CEO/board chair combination. The share of companies allowing flexibility over their board leadership model has slightly increased in recent years, from 72 percent in 2018 to 74 percent in 2022 in the S&P 500, and from 63 to 68 percent in the Russell 3000.
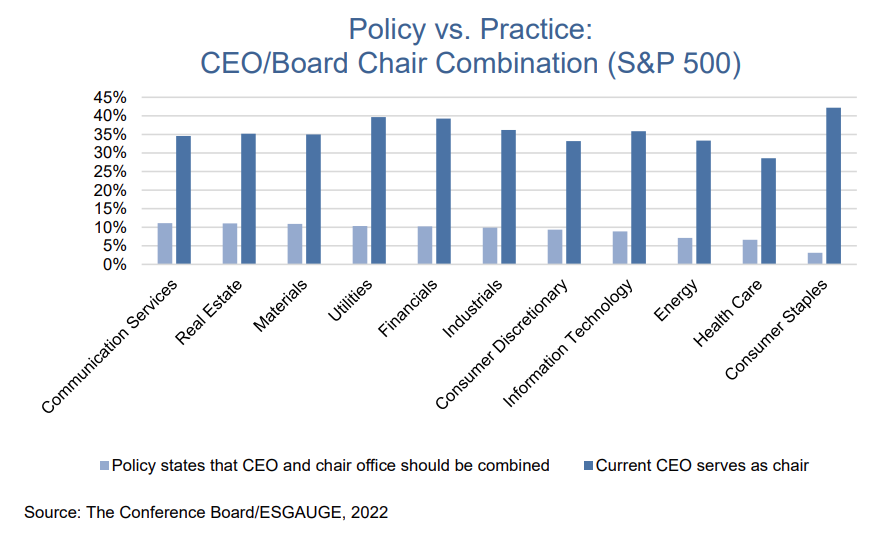
- Interestingly, policy doesn’t seem to be the main driver of practice at a business sector level. Having a formal policy on CEO/board chair separation or combination isn’t necessarily resulting in more companies separating or combining the two roles. For example, in the S&P 500, the communication services sector has the highest percentage of companies with a policy requiring the CEO/board chair separation model (27 percent) but ranks 6th when it comes to actually separating the two roles (65 percent). On the other hand, only 3 percent of consumer staples companies have a policy that requires combining the CEO/board chair positions, but this sector has the highest percentage of companies where the CEO also serves as the chair (42 percent).

- A prevalent reason disclosed by companies for requiring the separation of the CEO and chair roles is that the offices have different responsibilities. As of June 2022, 66 percent of S&P 500 and 76 percent of Russell 3000 companies provide this rationale in their company disclosures. Further, 23 percent of companies in S&P 500 and 28 percent in the Russell 3000 state that the company is committed to strong, independent board leadership and
- The main reason disclosed by larger companies for requiring the combination of the two roles is that board leadership independence can be achieved through a lead independent director. Sixty percent of S&P 500 and 31 percent of Russell 3000 companies that require one person to serve both roles provide this rationale in their company disclosures. Moreover, 50 percent of companies in the S&P 500 and 56 percent in the Russell 3000 requiring a combination state that the CEO is best suited to set the board agenda because of his or her industry experience and knowledge of the company’s daily operations. Another reason companies state for combining the roles is that it enables better communication between management and the board and enhances the company’s ability to carry out its strategic plan, according to 23 percent of S&P 500 and 30 percent of Russell 3000
Independent Chair Qualifications and Skills
- Business strategy continues to be the most commonly cited experience for independent chairs. But whereas the reported percentage of independent chairs with such experience has increased in the last few years at larger companies, it has decreased at smaller ones. In the S&P 500, the share of directors with strategic experience (as reported in the proxy statement or other disclosure documents) increased from 76 percent in 2018 to 79 percent as of June 2022. Conversely, in the Russell 3000, this percentage declined from 79 percent in 2018 to 76 percent in 2022. Interestingly, this trend for distribution of strategic experience doesn’t hold at the extreme ends of company size by revenue. As of June 2022, 71 percent of the largest companies (with annual revenues of $50 billion or more) with an independent chair disclosed that the individual had strategic business experience, compared to 80 percent at the smallest companies (with annual revenues under $100 million). This may reflect the fact that at the smallest companies the board may play a more hands-on role in determining corporate strategy (as they do in other areas, such as crisis management).
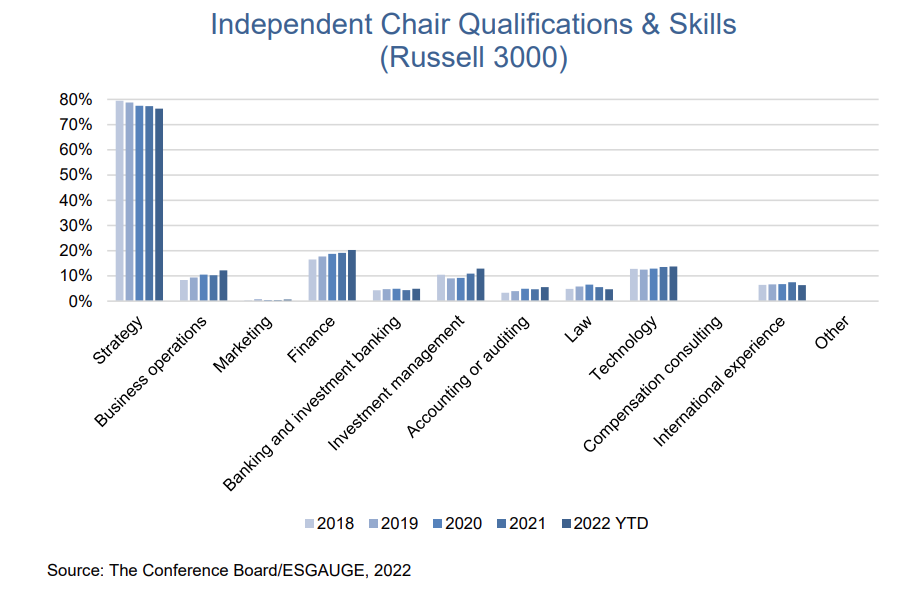
- At larger companies, independent chairs with experience in technology (24 percent) and finance (21 percent) are also relatively common as compared to other areas of professional expertise. These percentages are somewhat lower in the Russell 3000, at 14 percent (technology) and 20 percent (finance). Moreover, in the S&P 500, experience in business operations has seen a considerable uptick, from 6 percent in 2018 to 16 percent in 2022 (and from 8 to 12 percent in the Russell 3000). [5] Importance of international experience for independent chairs rose slightly for S&P 500 companies in 2021 (at 15 percent) but seems to have returned to a relatively stable trend (to 9 percent in 2022 from 11 percent in 2018).
Board Meetings
Frequency of Board Meetings
- Even though the average number of formal/minuted board meetings has declined since 2020 (the year the COVID-19 pandemic started), levels are still elevated, especially at larger companies. With the exception of 2020, boards of directors at companies of all sizes have met approximately eight times a year on average over the last five years. However, they saw an uptick in 2021.

- Notwithstanding the average number of meetings per year cited above, a majority of companies continue to hold fewer than eight board meetings per year. And the next largest group of companies hold more than 12 board meetings per year. In 2021, boards at 11 percent of S&P 500 companies met more than 12 times (and 13 percent of Russell 3000 companies). Not surprisingly, 2020 saw a spike in the number of firms holding more than 12 board meetings per year.
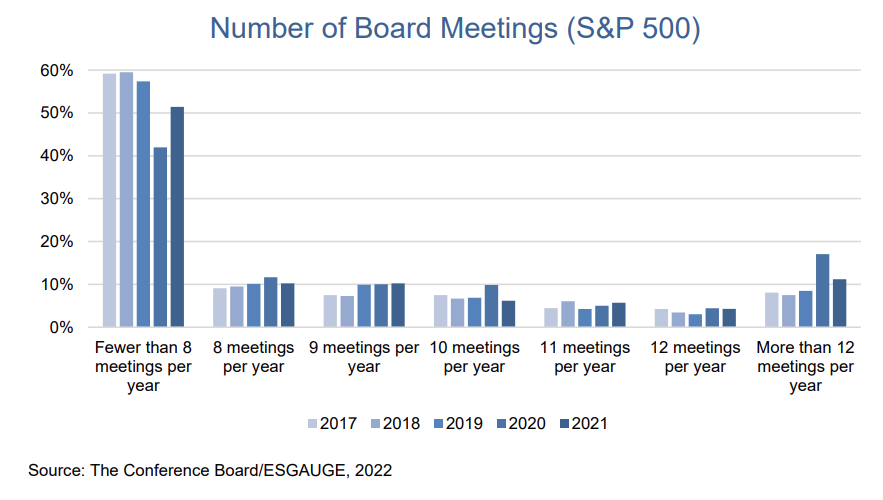
- Boards at the largest companies tend to meet most frequently. In 2021, 28percent of the largest companies, with annual revenues of $50 billion and over, held at least 11 board meetings, versus 18 percent of the smallest companies with annual revenues under $100 million.
- In the Russell 3000, boards in the energy sector tend to meet the most often. In 2021, companies in the energy sector were least likely to hold fewer than 8 board meetings (35 percent) and most likely to hold more than 12 meetings (23 percent) per year. Conversely, the materials sector had the largest percentage of companies disclosing fewer than eight board meetings per year (62 percent) and the lowest percentage of companies with more than 12 board meetings (7 percent).
Board Committees
Number of Board Committees
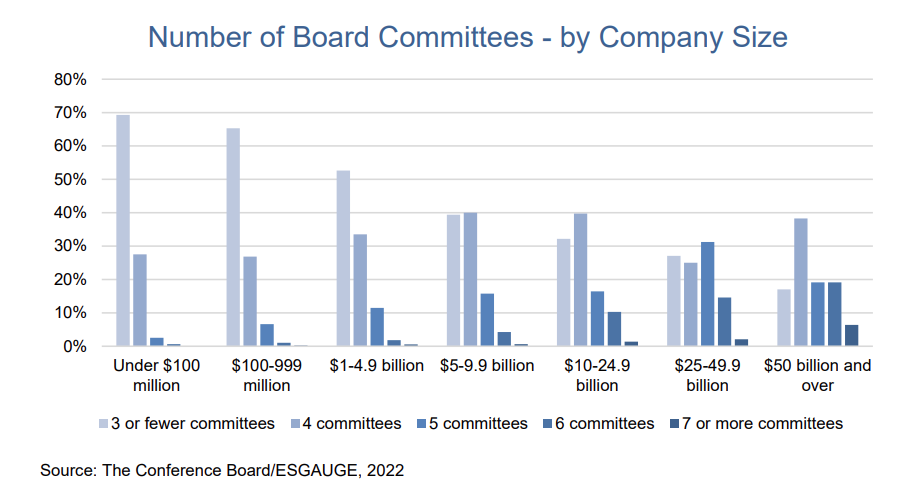
- While larger companies are most likely to have four or five board committees, smaller companies tend to have three or fewer. [6] As of June 2022, 20 percent of S&P 500 companies had five committees, 38 percent had four committees, and 25 percent had three or fewer. These percentages have been fairly stable over time, although we have seen the percentage of S&P 500 companies with six committees increase from 9 percent in 2018 to 13 percent in 2022. In the Russell 3000, 13 percent of companies had five committees, 32 percent had four, and 48 percent had three or fewer.
- There is sharp contrast in the number of board committees between the largest and smallest public companies. Sixty-nine percent of the smallest companies, with annual revenues under $100 million, have three or fewer committees versus 17 percent of the largest companies with annual revenues of $50 billion and over. Conversely, whereas only 1 percent of the smallest companies have six committees or more, 25 percent of the largest companies have that number of committees. This seems to be directly correlated with overall board size, as larger companies tend to have larger boards and thus may find it easier to populate a larger number of board committees. [7]
- The sectors that tend to have more than three committees are financials, materials, and utilities. For financial companies—which are required to have a risk committee—and those in materials, it is most common to have four committees. For utilities, it’s most common to have five. By contrast, a clear majority of technology (63 percent), communications services (62 percent), consumer discretionary (59 percent), and health care companies (57 percent) have three or fewer board committees.

Board Committee Types
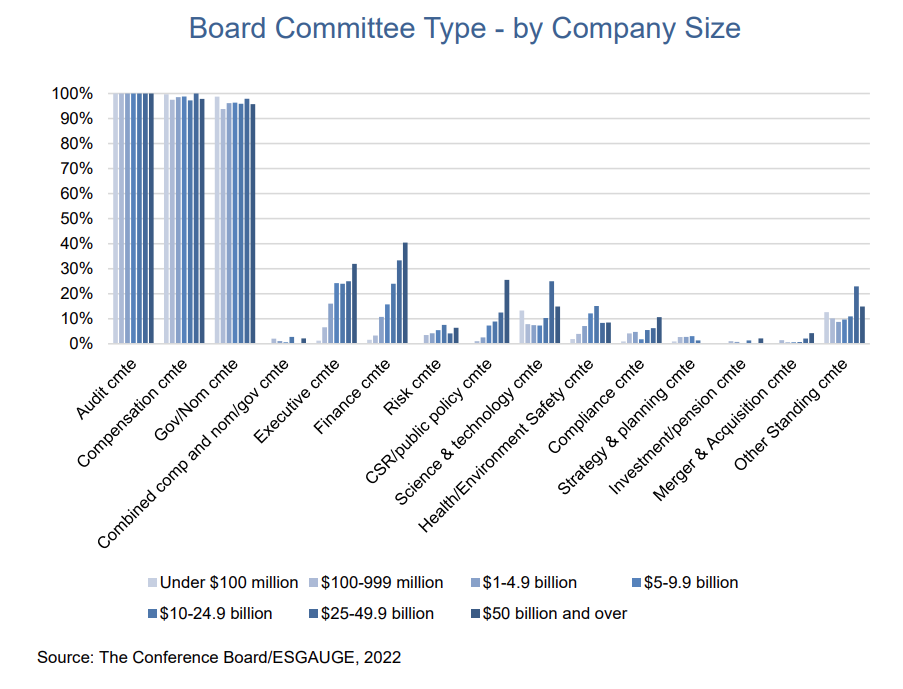
- In addition to the traditional audit, compensation, and nominating/governance committees, the most common standing committee of the board of directors is the executive committee. In the S&P 500, 30 percent of companies have such a committee (versus 17 percent in the Russell 3000). Other common committees at larger companies are finance committees (27 percent versus 10 percent in the Russell 3000), science & technology committees (16 percent versus 9 percent in the Russell 3000), and risk committees (13 percent versus 12 percent in the Russell 3000). The S&P 500 also saw an uptick in companies with health/environmental safety committees (from 7 percent in 2018 to 11 percent in 2022).

- There’s a direct correlation between company size and the percentage of companies with an executive, finance, or CSR/public policy committee. The smallest companies, with annual revenues under $100 million, usually don’t have any of these committees, and the largest companies, with annual revenues of $50 billion and over, are most likely to have one of these committees.
- In the Russell 3000, the financial sector has the highest percentage of companies with a risk committee (49 percent versus, for example, only 1 percent of health care companies). This reflects the regulatory requirement that publicly traded nonbank financial companies supervised by the Federal Reserve and publicly traded bank holding companies with $10 billion or more in assets have such a committee. The utilities sector has the highest share of both finance committees (45 percent) and executive committees (34 percent). Companies in the energy, materials, and utilities sectors all have high percentages of health/environmental safety committees (30, 26, and 24 percent, respectively).
Endnotes
1The Conference Board, in collaboration with ESG data analytics firm ESGAUGE, is keeping track of disclosures made by US public companies with respect to their board composition, director demographics, and governance practices. Our live, interactive online dashboard allows you to access and visualize practices and trends from 2016 to date by market index, business sector, and company size. The dashboard is organized in six parts: 1) board organization; 2) board leadership; 3) board composition; 4) new directors; 5) director election and removal; and 6) other board policies. While the data relied on for the conclusions presented in this report were pulled from the database on June 8, 2022, they reflect practices in place as of the most recent SEC filing or corporate documents relevant for each datapoint (including 2022 proxy statements, Forms 8-K and 10-K, committee charters, etc.).(go back)
2Throughout this post, the data for 2022 were pulled from our database on June 8 and include information for approximately 400 (or 80 percent of) S&P 500 companies and 2350 (or 78 percent of) Russell 3000 companies.(go back)
3Merel Spierings, “Board Composition: Diversity, Experience, and Effectiveness,” The Conference Board, May 2022.(go back)
4Company-size data in this report apply to manufacturing and nonfinancial services companies.(go back)
5An increase in operational experience among independent chairs mirrors an increase in operational experience among directors in general. But it could raise an issue if there isn’t a clear delineation between the board chair and CEO’s responsibilities, and the board chair is inclined to become involved in day-to-day business operations.(go back)
6These include some NASDAQ-listed companies without a separate nominating/governance committee as well as some recently IPO’d companies that have a single committee responsible for both nominating/governance and compensation matters.(go back)
7In 2021, companies with annual revenues of $50 billion or over had an average board size of 11 directors, with 82 percent having 10 or more directors, and 18 percent with 13 or more directors. By comparison, companies with annual revenues under $100 million had an average board size of 8, with just 9 percent reporting 10 or more directors, and none reporting more than 12.(go back)