 Print
PrintThe following post comes to us from Pay Governance LLC and is based on a Pay Governance memorandum by John D. England and Jeffrey W. Joyce.
At a recent Chief Human Resources Officer (CHRO) conference, two private equity firms’ operating partners observed that executive compensation programs in each and every company in which they invested had to be completely overhauled. “Of course,” quipped one CHRO, “all you need to do is grant large, upfront stock options as a one-time long-term incentive, and you don’t worry about pay after that.” After the chuckling subsided, the operating partners politely demurred. One replied “Actually, we worry every day about whether our portfolio company pay programs create drive, discipline, and speed, for without these three motivations, our investments won’t create value for our investors. The other added, “You need to worry more about these motivations, too.”
It’s sobering to consider the implicit critique being delivered about the state of public-company executive compensation today. After all, most compensation philosophies are built around the objectives of “attracting, retaining, and motivating” key executives. And most companies have implemented short- and long-term incentive programs that, together with other elements of total rewards, are intended to support these three objectives. How could it be that incentive plans are so consistently lacking in “drive, discipline, and speed” that these private equity owners felt required to replace them? Is it possible that the motivation objective has been blunted by shareholder advisory firm activism in the Say on Pay voting world in which we now live?
Design and evaluation tools abound in executive compensation today. Probably the first tools developed were compensation surveys to assess the competitiveness of pay programs. Other tools include realizable pay, goal calibration, Monte Carlo analysis, and investor expectations modeling, not to mention Institutional Shareholder Services (ISS) tools such as Relative Degree of Alignment, Multiple of Median, and Pay-TSR Alignment. But no tool exists to help a company consider how much “drive, discipline, and speed” is created by its executive compensation programs or how different design choices may influence these desired motivations.
Summary Takeaways
- Is it possible that motivation has been blunted by shareholder advisory firm activism in the Say on Pay voting world in which we now live?
- Pay Energy© is a new tool to measure “drive, discipline, and speed” in an executive compensation program
- S&P 100 companies have been scored with significantly varied results in their CEO pay packages
- Companies should consider measuring “drive, discipline, and speed” when they review or redesign executive pay programs
Assessing Pay Energy©
Pay Governance has studied the issue of whether today’s executive compensation programs have varying degrees of “drive, discipline, and speed”, and has created a proprietary Pay Energy© measurement index as an additional design and evaluation tool.
The index makes no judgment as to whether particular executive compensation programs are “good” or “bad”, nor does it consider a company’s specific industry, performance, or position within the business cycle. For instance,
- Retention concerns may be preeminent in design for companies facing significant business challenges or experiencing talent drains
- Winning Say on Pay after a crushing advisory vote loss may be the driving focus in design
- Some industries gear pay more toward cash than equity compensation
What Pay Energy© does, however, is assess almost 50 different design features typically found in executive compensation programs through one specific lens:
“What is the degree to which a pay element motivates ‘drive, discipline, and speed’ in delivering results and growing shareholder value?”
Aggregated individual feature assessment results becomes a company’s Pay Energy© score.
Measuring Pay Energy©
Pay Energy© is a propriety model that scores individual components of an executive compensation program. By scoring points along a full spectrum of possibilities, an overall indexed score can be obtained from any company’s public disclosures.
Pay Energy© looks at the major components of an executive pay package, and weights them according to their ability to influence “drive, discipline, and speed.”
- Base Salary, weighted 5%
- Annual Incentives, weighted 30%
- Long-Term Incentives, weighted 60%
- All Other Compensation, weighted 5%
Within these major components of executive compensation, almost 50 separate design elements with up to 7 possible scoring outcomes each are processed by the Pay Energy© model. Indexed scores can range from 0 to 200, with an expectation of a typical score of 100.
The Pay Energy© measurement index was developed using decades of executive compensation consulting experience, and verified by conjoint analysis from CHROs and compensation and benefits professionals.
For instance, on one end of the pay spectrum, take base salary…
- On its own, base salary is unlikely to have much “drive, discipline, and speed”
- But, now let’s re-define base salary as “base salary as a percent of total compensation”
- It’s reasonable to assess a “10% total compensation slice representing salary” to have more Pay Energy© than a “30% slice”, although in neither case is it very much
On the other end of the pay spectrum, consider a long-term performance plan driven by 3-year operating earnings goals…
- Pretty clearly, a long-term performance plan creates more “drive, discipline, and speed” than base salary
- Versus a classic three-year “point-to-point” relative total shareholder return (TSR)-based long-term incentive, three-year operating earnings goals should create much more actionable “drive, discipline and speed”
- Finally, within the design of a long-term performance plan, features such as “cash versus shares”, “threshold-target-maximum calibration”, and “payout leverage” can lever up and down an overall score
You can do your own experiment on differentiated “drive, discipline, and speed” created by alternative program features:
| “Creates Pay Energy©?” | “Blunts Pay Energy©?” |
| Modest Salary | High Salary |
| Salary Small in TDC Mix | Salary High in TDC Mix |
| Financial Goals in AIP | Discretionary AIP |
| 1-2Goals | 5 or More Goals |
| High Gearing in Pay-Performance Ranges | Low Gearing in Pay-Performance Ranges |
| Stock Options | Restricted Stock |
| Shorter Vesting | Longer Vesting |
| Financial Goal PSUs | Relative TSR PSUs |
| Variable Pay High in TDC Mix | Variable Pay Low in TDC Mix |
| No SERPs, Perks | SERPs and Heavy Perks |
| No Contract | Contracts |
Now, let’s look at two hypothetical CEO pay packages…
| Company A | Company B | |
| Salary | $1.2 Million | $1.5 Million |
| Annual Incentive | 70% Financial Metrics | 80% Financial Metrics |
| Stock Options? | None | 50% Stock Options |
| Restricted Stock? | 50% RSUs | None |
| Performance LTI? | 50% Relative TSR | 50% ROCE vs Goal |
| SERP? | ERISA Excess | None |
| Contract? | Yes–3x Cash Severance | CIC Only |
| Perks? | Security, Plane, Financial Planning | Financial Planning & Executive Health |
Who has more “drive, discipline, and speed”?
Pay Energy© in the S&P 100
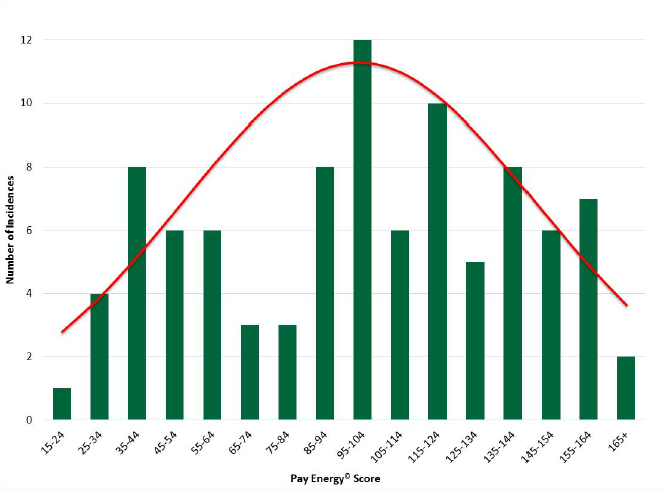
Using 2014 Compensation Disclosure and Analysis reports for the S&P 100, Pay Governance assessed “drive, discipline, and speed” in pay programs for non-founder CEO pay programs.
Potentially surprising to the aforementioned private equity firm operating partners, it appears that many companies have managed to retain pay programs that create “drive, discipline, and speed” as measured by Pay Energy©, even in a Say on Pay environment.
Other companies have much more modest scores in comparison to others. Among S&P 100 non-founder company CEOs…
- Average score: 99
- Median score: 5
- # Companies With scores below 100: 46
- # Companies With scores above 100: 49
- # Companies With scores above 150: 12
Does Pay Energy© Matter?
While no single metric is determinative in executive pay design, Pay Governance believes the answer to whether “drive, discipline, and speed” matters is “yes.” A look at the relationship of TSR performance and Pay Energy© suggests higher performing companies tend to have higher indexed scores. *
| 1-year | # Cos | Median TSR | Median Pay Energy© | 3-years | # Cos | Median TSR | Median Pay Energy© | 5-years | # Cos | Median TSR | Median Pay Energy© |
| High TSR | 32 | 58% | 109 | High TSR | 31 | 30% | 106 | High TSR | 31 | 29% | 106 |
| Medium TSR | 31 | 36% | 103 | Medium TSR | 31 | 16% | 95 | Medium TSR | 31 | 18% | 95 |
| Low TSR | 32 | 16% | 97 | Low TSR | 32 | 6% | 98 | Low TSR | 31 | 11% | 97 |
* Based on dividing S&P 100 sample of companies into top third, middle third and bottom third of TSR performance
What’s Your Company’s Pay Energy© Score?
Does your company have “high”, “medium”, or “low” Pay Energy© in absolute terms and relative to peers? Does the amount of “drive, discipline, and speed” fit your company’s culture and its espoused compensation philosophy of attracting, retaining, and motivating executive talent? What changes could be made to enhance focused performance, and what impact would such an enhancement have on other pay program design considerations?
Setting out to only maximize a Pay Energy© score would never be recommended, as many inputs are needed to design a company-specific executive compensation program. However, supporting a sense of urgency by creating “drive, discipline, and speed” in a company’s executive pay program seems critical to the philosophy of “attract, retain, and motivate.” How much Pay Energy© is ideal for your company depends on multiple factors. But it all starts with knowing what the score is and why.
We believe Pay Energy© joins other diagnostic tools that should be deployed when designing or assessing executive compensation programs. Combined with multiple other forces impacting final design, the degree to which a pay program or specific pay element motivates “drive, discipline, and speed” in delivering results and growing shareholder value should be an important ingredient into final decisions on executive pay program design.