 Print
PrintIra Kay is a Managing Partner and Blaine Martin is a Consultant at Pay Governance LLC. This post is based on a Pay Governance memorandum.
On April 29, 2015, the SEC released proposed rules on public company pay‐for‐performance disclosure mandated under the Dodd‐Frank Act. Pay Governance has analyzed the proposed rules and the implications for our clients’ proxy disclosures and pay‐for‐performance explanations to investors. We are concerned about the validity of describing a company’s pay‐for‐performance alignment using the disclosure mandated under the SEC’s proposed rules, and its implications for Say on Pay votes.
The disclosure of “compensation actually paid” (CAP) as defined by the SEC may prove helpful for investors and other outside parties to estimate the amount of compensation earned by executives, in contrast to the compensation opportunity as disclosed in the Summary Compensation Table (SCT). However, the SEC’s proposed rules are explicitly intended to compare executive compensation earned with company stock performance (TSR), per the relevant section of the Dodd‐Frank legislation. [1] If the rules are intended to help shareholders understand the linkage between executive compensation programs and stock performance, then the technical nuance of the proposed methodology may be problematic.
Key Takeaways
- The SEC’s proposed CAP disclosure was intended to facilitate a pay‐for‐performance comparison by investors. Its definition does not chronologically align executive stock grants to the performance period for the calculation of total shareholder returns. As a result, the SEC’s methodology does not facilitate an accurate assessment of pay‐for‐performance.
- CAP for 3 years as of 2014, for example, includes pro‐rata vesting tranches of equity awards that could have been granted in 2009, 2010, 2011, 2012, and 2013. In comparison, TSR is measured over the 2012‐2014 period.
- We illustrate the problems inherent in the SEC’s methodology using a real‐world anonymous example.
- Such misalignment is inherent in the CAP methodology. Thus the SEC’s suggestion that a time‐series comparison of CAP and TSR can help investors to understand the alignment of pay and performance is not valid.
- Instead, realizable pay, which provides an updated value of equity awards granted in the preceding three years, provides a better view of pay‐for‐performance alignment for investors.
The most apparent problem with comparing CAP and company TSR is that the CAP figure, which includes the value of equity awards vesting in each year, includes multiple equity grants that may have been granted one, two, three, four, or more years before the TSR measurement period. This depends heavily on the vesting schedule or performance period of equity awards. This mismatch in the timing of the stock grants and TSR significantly limits the utility of CAP in pay‐for‐performance analysis.
This post explores this concern by modeling a real‐world CEO CAP disclosure table for the 3‐year period allowed under the SEC’s disclosure transition relief. While this example is based on a real public company and CEO, identifying data have been withheld to protect confidentiality.
Pro‐Forma SEC Mandated Table
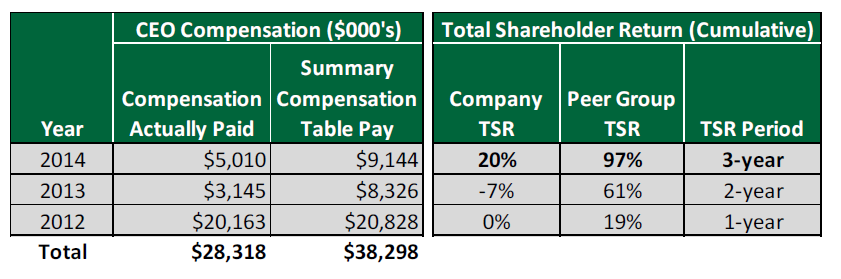
The table below is a pro‐forma version of the SEC mandated CAP table representing a 3‐year period. Our pro‐forma table focuses only on the CEO to simplify discussion and analysis, but results would be similar for all other named executive officers. [2]
Potential Narrative Disclosure
The proposed rules require a narrative discussion of the relationship 1) between CAP and company TSR, and 2) between company TSR and peer TSR. In the case of our example, the narrative below attempts to describe these relationships:
In the three year history of CEO compensation in the SEC‐mandated table above, CAP was significantly below Summary Compensation Table pay in 2013 and 2014. CAP in 2012 approximates SCT pay, but 2012 was an unusual year for the Company due to a CEO transition, and the CAP value in 2012 includes severance and vested equity awards for our departing CEO, in addition to annual compensation for our new CEO. The disclosed level of CAP was delivered commensurate with 3‐year cumulative TSR of 20%, which was below the 3‐year TSR for the peer group of 97%. Additional information on company pay‐for‐performance alignment is provided in the Compensation Discussion and Analysis.
The SEC’s proposed disclosure rules suggest that the SEC believes that a comparison of the year‐over‐year change in CAP, company TSR, and peer group TSR would help investors to understand pay‐for‐performance alignment. This expectation is potentially problematic because CAP is composed mostly of the equity awards that vest in a particular year, many of which were not granted during the TSR performance period (e.g., a 3‐year award granted in 2009, which vests in 2012). Vested equity awards are valued using the stock price on the date of vesting, and not the year‐end stock price (as used for TSR calculation purposes), further contributing to the CAP/TSR timing disconnect. The methodology is further complicated by the SEC’s requirement that companies disclose the aggregate CEO CAP for years in which a CEO transition occurred mid‐year. Thus, it is unlikely that CAP would track company stock performance based on these nuances in the SEC‐mandated methodology.
As a result, our pro‐forma narrative focuses not on the year‐to‐year change in CAP, but on the relationship between CAP and summary compensation table pay (pay opportunity) and the relationship between 3‐year company TSR and 3‐year peer group TSR. While the comparison of 3‐year CAP and summary compensation table pay is not perfect because the two values do not represent the same equity awards, it is nearly meaningless to compare CAP to TSR without reference to either pay opportunity or peer company compensation. Companies may also wish to consider disclosing a peer group comparison of CAP levels, although such an analysis would have to lag one year behind the disclosure year based on availability of peer group CAP disclosure.
Graphical Comparison Alternative
The SEC proposed rules suggest that companies may wish to provide a time series line chart which would plot CAP, Company TSR, and Peer Group TSR. We provide an example of such disclosure below:

As described above, the SEC may believe a time‐series comparison will tell the story of CEO pay relative to company TSR, and Company TSR to peer group TSR. However, in this test scenario, an investor may conclude that CAP has decreased since 2012 while company stock performance remained relatively flat versus peer company returns. While those facts are true, the 2012 CAP values are inflated due to a CEO transition in 2012, and the chart does not demonstrate the reality that the value of the new CEO’s equity awards have tracked company stock price performance. Additionally, the chart does not illustrate that CAP was significantly lower than pay opportunity in 2013 and 2014, or have a reference for CAP relative to peer companies. Without some context for pay, comparing CAP to company and peer group TSR performance is not particularly helpful to investors.
Realizable Pay as a Supplemental Disclosure
Fortunately, the SEC proposed rules allow for supplemental analyses of pay‐for‐performance alignment in the proxy statement, as long as that analysis is not disclosed more prominently than the required CAP disclosure.
Our research demonstrates that realizable pay is the best methodology for companies to assess and communicate the pay‐for‐performance alignment of their executive compensation programs. Unlike CAP, realizable pay tracks the change in value of equity awards over the same three‐year period for TSR. Thus, 2012, 2013, and 2014 equity grants are valued on 12/31/2014 in our example below. Further, realizable pay is directly comparable to Summary Compensation Table pay since it generally represents an updated valuation of the equity awards provided in 2012, 2013, and 2014. In contrast, CAP measures the value of stock vested in each year, so the equity value for the pro‐forma 3‐year CAP disclosure includes the portion of awards vesting ratably from grants in 2009, 2010, 2011, 2012, and 2013. Realizable pay compares both pay and performance to competitive peer group levels, because comparing company TSR to peer TSR without the same comparison for pay tells an incomplete story at best. As a result, any peer competitive analysis of realizable pay would lag one year behind the most recent fiscal year since competitive peer data would not be available until the follow year.
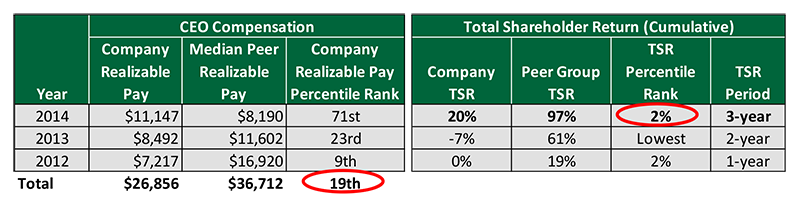
The table above presents an analysis of realizable pay for our pro‐forma example. We ranked the company realizable pay and TSR relative to the peer group and found that the company’s 3‐year CEO compensation is currently valued at the 19th percentile of the peer group, aligned with performing at the 2nd percentile of the peer group for TSR.
This approach shows how the CEO’s equity award values track company stock price. In well‐aligned pay programs, CEO realizable pay is typically ranked low relative to peers when TSR is underperforming peers, and is typically ranked high when TSR is outperforming peers. The example above, and research on hundreds of companies over the years, show alignment between CEO pay and company performance more clearly, consistently, and reliably than can be expected using the SEC’s CAP disclosure. [3]
Conclusion
Our pro‐forma analysis of the SEC’s proposed mandated CAP disclosure reveals major technical and practical problems with the SEC’s proposed approach to mandatory pay‐for‐performance disclosure. If the intention is to help investors understand the pay‐for‐performance linkage of company executive compensation programs with company stock returns, disclosures complying with the proposed regulations may provide a hazy or even coincidental understanding of pay‐for‐performance linkage at best. Based on these findings, we believe that supplemental disclosure, and the use of realizable pay in particular, will be critical in communicating the alignment of executive pay programs with the financial interests of shareholders.
Endnotes:
[1] ISS uses a modified version of SCT pay for their relative degree of alignment pay‐for‐performance model.
(go back)
[2] The pro‐forma disclosure provided, including the TSR period, is based on our good‐faith interpretation of the proposed SEC regulations. The disclosure format may change pursuant to the SEC’s final rules, and subsequent Q&A provided by the SEC.
(go back)
[3] While the example above shows that both CAP and realizable pay are aligned with TSR, this outcome may be coincidental. There are numerous possible scenarios where CAP shows misaligned pay while realizable pay is closely aligned.
(go back)