 Print
PrintThe following post comes to us from Subodh Mishra, Vice President at Institutional Shareholder Services, and is based on an ISS white paper by Daniel Cheng, available here.
Introduction
The enhanced executive compensation disclosures mandated by the U.S. Securities and Exchange Commission in 2006 have provided a significant new data set for investors and companies to analyze and benchmark pay practices across a broad set of U.S. corporate issuers.
Moreover, precisely how companies choose to benchmark their pay practices has received much attention following the outcry over Wall Street payouts and the recent promulgation of legislation requiring most U.S. issuers put their pay to a precatory shareholder vote.
Against this backdrop, Executive Pay Through a Peer Benchmarking Lens summarizes key findings from ISS Corporate Services’ study of almost 15,000 Def 14A filings over the past four years. Drawing on ISS’ executive compensation database, the focus of the analysis is on both pay levels as well as the processes by which companies benchmark their pay relative to peers.
Trends in Total CEO Pay
The median value of total CEO compensation for S&P 500 companies decreased 4.8 percent in fiscal 2009 but jumped 20 percent to $10.6 million in fiscal 2010. A similar trend was observed among small-cap companies (defined here as members of the Russell 3000 index excluding the S&P 1500). The decline in median CEO pay for those issuers was 10 percent from 2008 to 2009, followed by a 26 percent surge in fiscal 2010.
Although the gains are evidenced across all industries in fiscal 2010, those with the biggest increases were financial and information technology companies with jumps in median pay of 47 percent, followed by energy companies at 30 percent. In fiscal 2009, utility companies were on top, paying their CEOs 13 percent more than the previous period, followed by consumer discretionary companies’ 11 percent jump, when most other industries cut CEO pay.
In fiscal 2009, the global economic slowdown, coupled with increasing pressure from investors to rein in executive pay, resulted in a sharp decline in the use of equity-based compensation. Our study shows that the median option value granted by S&P 500 companies in 2009 declined almost 17 percent, while nearly half of small- cap firms suspended option awards. Instead, discretionary and non-discretionary bonuses became popular alternatives. S&P 500 companies increased their payouts of cash bonuses to CEOs by 13 percent from levels in 2008, for example, while cash bonuses climbed 28 percent at small-cap firms in 2009.
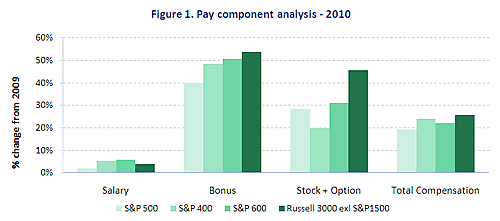
In fiscal 2010, this trend saw dramatic growth. Companies across all indices not only resumed the grant of equity-based compensation but also increased discretionary and non-discretionary bonus awards. S&P 500 companies raised equity-based compensation by 28 percent, while small-cap firms increased such pay by 46 percent. Much of the increase can be attributed to the growing popularity of stock awards. For instance, 53 percent of equity-based compensation was composed of stock in 2010 among S&P 500 companies–up from 46 percent in the previous period. Continuing the trend from 2009, large-cap companies gave 40 percent more in bonus awards to their CEOs, while small-cap companies rewarded their chiefs 54 percent more, as reported in 2011. Figure 1 illustrates the breakdown in pay.
Peer Benchmarking Disclosure
More Companies Clearly Disclosing their Benchmarking Peers
More than 97 percent of S&P 1500 companies disclosed their benchmarking practices in fiscal 2010, compared with 84 percent in 2007. Among companies reporting in 2011, we see nearly 60 percent having selected 10 to 20 peers to benchmark their CEO’s pay level, with a median number of peers selected of 15. In addition, we found that peer group size typically increases at larger companies. More than 30 percent of S&P 500 companies selected over 20 peers to benchmark pay with only 23 percent of companies beyond the S&P 1500 doing so.
Size Matters in Choosing Peers
 When determining peer groups, a key observation is that a majority of companies tend to select benchmarking peers whose sizes are between 0.5 and two times their own. Another observation is that the most popular standards to measure company size are corporate revenue, market capitalization and assets, in descending order of prevalence.
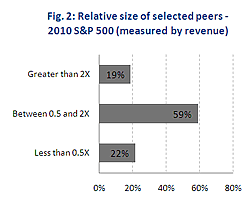
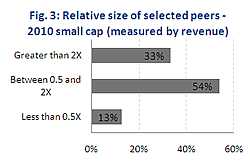 We studied over 40,000 pairs of company-peer data disclosed for fiscal years 2010 and 2007. Our analysis shows that about 60 percent of peers’ sizes are between 0.5 and two times that of the choosing company’s revenue. The trend is consistent between fiscal 2007 and 2010 and applies across all indices. If the focus is turned to the percentage of total peers composed of larger cap companies, defined as companies with revenues of more than two times their own, we find the percentage is about 19 percent for S&P 500 companies, and increases to 33 percent for small-cap firms, as illustrated in Figures 2 and 3.
Payout Targets Can be Vague or Moving
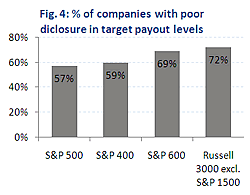 Despite the SEC’s guidance to encourage companies to increase transparency and disclose targeted levels of compensation, our study found more than 66 percent of the studied sample did not specify targets or provided ambiguous disclosure. The poor quality of disclosure is more prevalent among small-cap companies, with 72 percent of Russell 3000 companies (excluding S&P 1500 constituents) failing to disclose what percentile levels of pay they plan to target, as reported in 2011. For companies revealing the targeted percentile, we find over half set the target at peers’ medians while another 40 percent target the top quartile or above median.
Peer Selection Remains a Challenge
Do Peers Pay for Performance?
To gain more insight into the relationship between CEO pay and corporate financial performance, we examined all the peers selected by Russell 3000 companies in fiscal 2010. Our data shows that more than 170 companies’ CEOs received a significant increase (greater than 25 percent for the same CEO) in total compensation while their performance, as measured by both one- and three-year total shareholder returns, were both below the median levels of Russell 3000 peers in the same industry. Nevertheless, CEOs pay at these 170 companies were benchmarked by roughly 1,400 Russell 3000 companies, and, in one notable case, a CEO’s pay was benchmarked by 42 other companies.
Higher Paid CEOs are Popular Peers for Benchmarking
Peer benchmarking in setting executive pay and cherry-picking highly paid peers has long been a hot-button issue for governance observers. One recent study shows companies tend to select higher paid peers when setting executive pay. [1] Here we provide similar evidence utilizing our dataset. To control for company size, the same research is conducted for S&P 500, 400, and 600 companies. Adopting a portfolio approach, we divided the data set into three groups – top and bottom 10 percent and middle 80 percent – based on total CEO pay. We further ranked the data to study the number of times a company is benchmarked; in effect, its “popularity” as a compensation benchmarking peer. Our data show the average CEO compensation among the top 10 percent highest paying S&P 500 companies is $34.8 million, while that for the bottom 10 percent of S&P 500 companies is $2.9 million. For the highest paid group, the average number of times that a company is benchmarked is 27, which is 34 percent higher than that of the lowest paid group at 20.2 times. The spread increases inversely based on company size. Among S&P 600 firms, the top-paid group is benchmarked on average 13.3 times, which is almost twice as often as the bottom-paid group of 6.8 times.
Table 1: Pay Rank Across S&P Indices, 2010
|
Average CEO total compensation
(in $million ) |
Average number of times being benchmarked
|
|||||
| Pay Rank | S&P 500 | S&P 400 | S&P 600 | S&P 500 | S&P 400 | S&P 600 |
| Top 10% | 34.8 | 14.4 | 8.0 | 27.0 | 15.1 | 13.3 |
| Middle | 11.4 | 5.5 | 2.6 | 22.4 | 16.0 | 10.8 |
| Bottom 10% | 2.9 | 1.4 | 0.7 | 20.2 | 12.7 | 6.8 |
Popular Peers Tend to Have Higher CEO Pay
Similarly, we re-rank the data by “popularity” and derive the average pay for each of the three groups. Our analysis shows the average number of times the top 10 percent most popular S&P 500 companies are used in benchmarking is 45.2 times, while the average for the bottom 10 percent least popular group is 7.6 times. And the average total compensation for the top 10 percent most popular S&P 500 companies is $17.2 million, which is almost two times more than that of the bottom 10 percent least popular ones, which stands at $8.8 million.
Across virtually all sizes of companies, the higher the average CEO pay, the greater the popularity, and vice versa. [2]
Table 2: Popularity Rank Across S&P Indices, 2010
|
Average number of times being benchmarked
|
Average CEO total compensation (in $million)
|
|||||
| Popularity Rank | S&P 500 | S&P 400 | S&P 600 | S&P 500 | S&P 400 | S&P 600 |
| Top 10% | 45.2 | 32.0 | 24.2 | 17.2 | 6.2 | 4.3 |
| Middle | 22.2 | 15.5 | 10.4 | 13.0 | 6.2 | 2.8 |
| Bottom 10% | 7.6 | 4.5 | 2.0 | 8.8 | 4.6 | 2.8 |
Mind the Gap: How Pay Aligns with Size and Performance Under Companies’ Benchmarking Practices
Leveraging ISS data, our analysis also looked at the correlation between pay, performance, and firm size to identify trends in compensation benchmarking. Our analysis ranked study companies against their disclosed peers by three criteria: total CEO compensation; firm size as measured by total revenue; and shareholder returns over the previous three years.
We then introduced three measurements to evaluate how compensation is relatively benchmarked: Relative Pay Rank; Relative Performance Rank; and Degree of Misalignment.
- Relative Pay Rank is the spread between rank in pay and company size. It measures the alignment between pay and firm size, whereby Positive Relative Pay Rank indicates rank in pay is higher, while zero Relative Pay Rank suggests pay rank is in line with size rank. For example, rank in pay at the 75th percentile and rank in size at the 45th percentile leads to Relative Pay Rank of 30 percentage points.
- Relative Performance Rank is the deviation of a firm’s performance rank from the median of peers’ performance rank, (i.e., the 50th percentile). Positive Relative Performance Rank represents better performance than more than half of selected peers, while zero Relative Performance Rank means performance is in line with that of the median level for disclosed peers. For example, performance rank at the 75th percentile leads to a Relative Performance Rank of 25 percentage points.
- Degree of Misalignment is the difference between Relative Pay Rank and Relative Performance Rank. A Positive Degree of Misalignment indicates higher pay than performance, while a zero Degree of Misalignment implies that pay and performance are comparable.
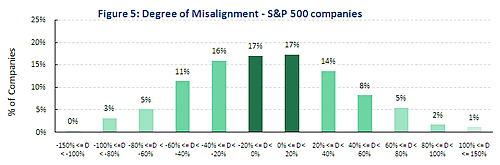
Analyzing S&P 500 companies shows 34 percent of studied companies set their pay relatively in line with their performance, within a 20 percent deviation in ranking. As illustrated in Figure 5, this bell-shaped distribution centering on zero deviation in ranking suggests that “pay commensurate with performance” is the norm while fat tails for this distribution suggest a notable amount of deviation from the pay-for-performance link. For example, nearly 30 percent of companies more aggressively benchmarked their pay yielding the Relative Pay Rank considerably higher than Relative Performance Rank by more than 20 percentage points. Conversely, 36 percent of study company pay is at a lower level considering their relatively better performance against peers.
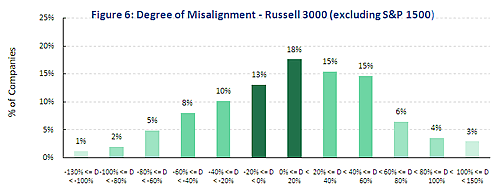
In line with our previous observation that small-caps tend to select larger-cap companies to benchmark their pay, Figure 6 illustrates that although 31 percent of small-cap companies are within the norm, nearly 43 percent of companies have Relative Pay Rank much higher than Relative Performance Rank, leaving only 26 percent of companies on the left tail with a higher rank in performance and lower rank in pay.
With the recent regulatory mandate for an advisory shareholder vote on pay and growing investor pressure on issuers to align pay and performance, governance watchers will monitor how this trend continues to evolve.
Conclusion
The growing prevalence of peer benchmarking by companies and improved disclosure around the benchmarking process creates new opportunities for the analysis of peer benchmarking composition and its impact on executive pay. Our study shows higher paid CEOs are more likely to be selected for benchmarking. Moreover, many CEOs’ pay is not commensurate with performance, which in turn may lead to higher risk related to both executive retention and firm performance. With compensation benchmarking a growing concern for a broader number of governance stakeholders, issuers and investors alike will face growing pressure to analyze related patterns to ensure best practices are maintained. Using our comprehensive compensation data set, ISS will continue to monitor trends in pay benchmarking.
Endnotes
[1] Yang and Faulkender (2010); Journal of Financial Economics
(go back)
[2] It is likely that “popularity” further depends on other factors, such as: the average number of peers that a company selects as benchmarks in a peer group; the difference in tendency of disclosing peer benchmarking details in different segments; and the difference in the number of potential peers available as benchmarks within a segment of similar business and size. Indeed, a regression analysis of our data set shows that these factors are statistically significant in general. We also conducted similar research while based on regression-adjusted “popularity” to account for the influence of these factors. In most cases, the results still support the same conclusion of statistical significance despite some differences in quantitative details.
(go back)