Print
PrintThe following post comes to us from Craig Sherman, partner focusing on corporate and securities law at Wilson Sonsini Goodrich & Rosati, and first appeared in the firm’s Entrepreneurs Report.
Deal terms remained broadly similar in 1H 2013 as compared with 2012, with a couple of notable exceptions. First, the use of uncapped participation rights in both up and down rounds continued to decline. Second, down rounds also saw a shift away from the use of senior liquidation preferences.
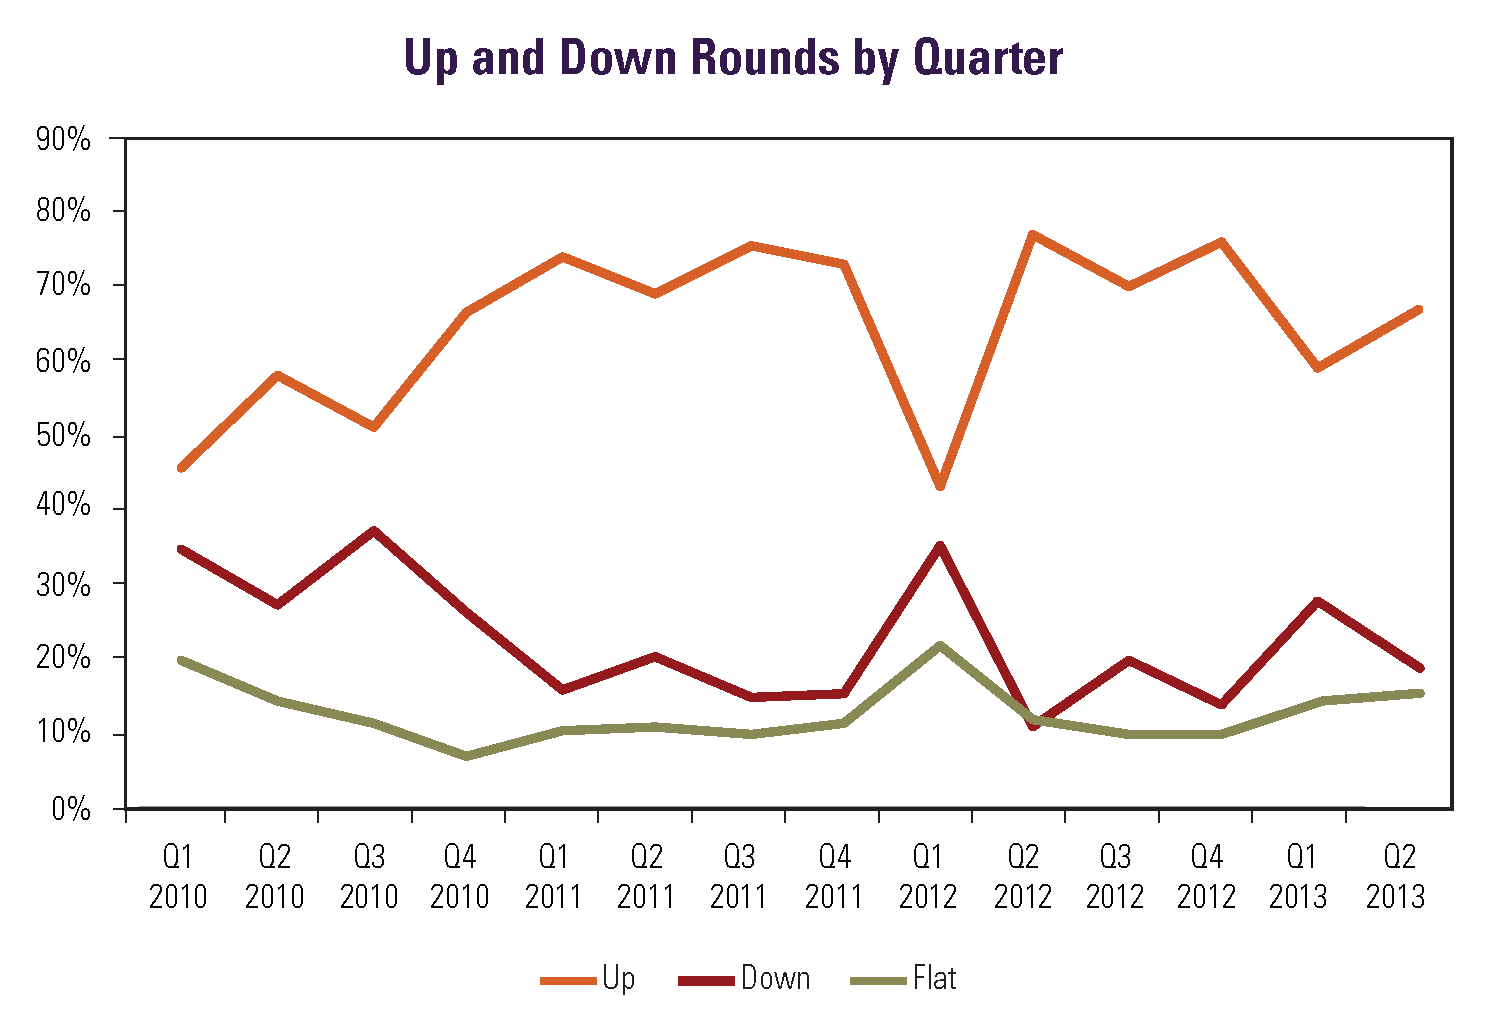
Up and Down Rounds
Up rounds represented 67% of all new financings in Q2 2013, an increase from 60% in Q1 2013 but still down markedly from the 76% figure for up rounds in Q4 2012. Similarly, down rounds as a percentage of total deals declined from 26% in Q1 2013 to 18% in Q2 2013, but were still higher than the 14% figure for Q4 2012. The percentage of flat rounds grew slightly, from 14% of all deals in Q1 2013 to 15% in Q2 2013.
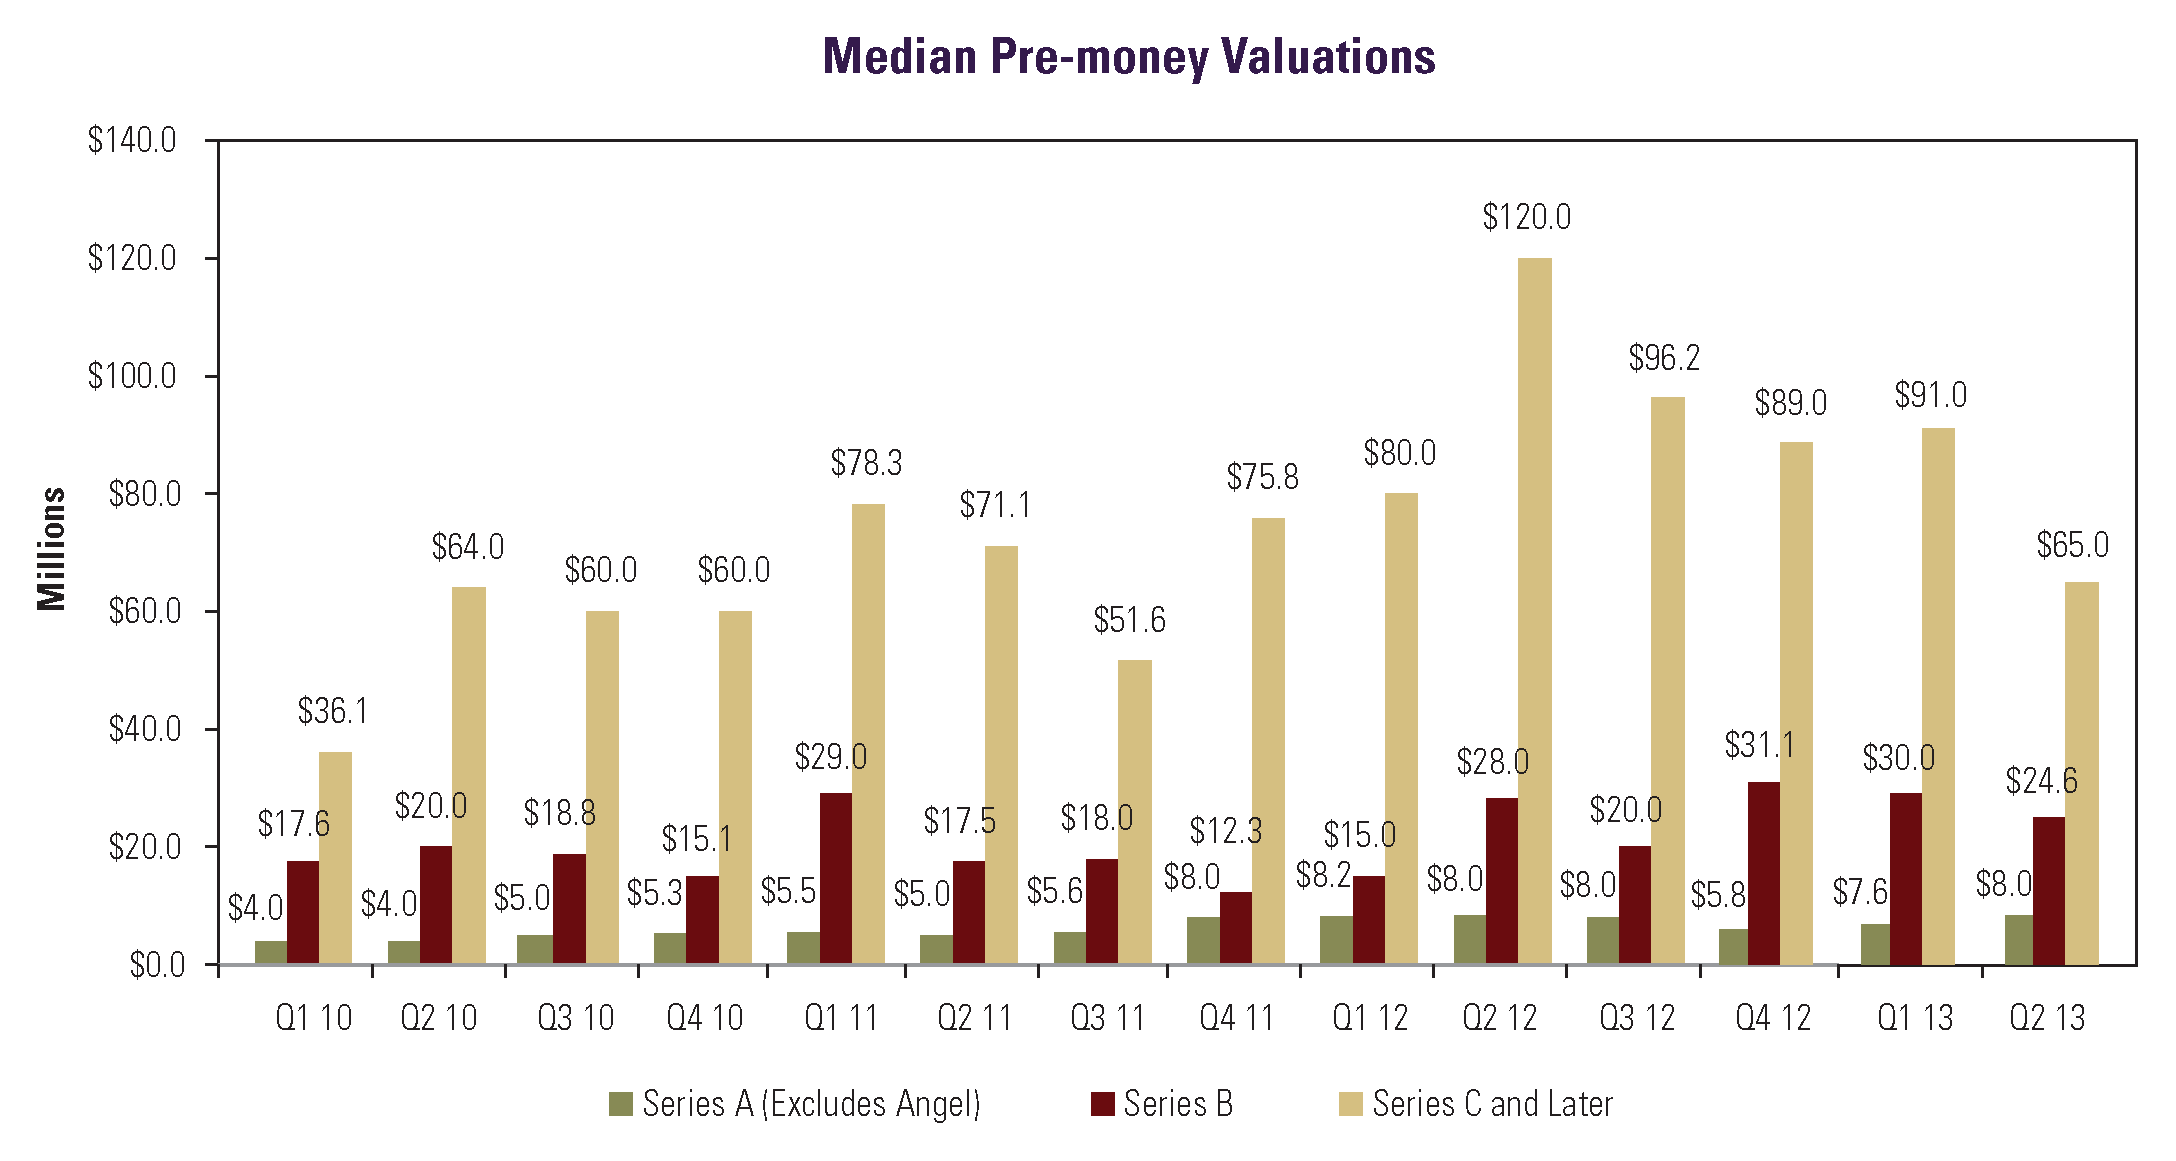
Valuations
Company valuations in Series A deals were generally higher in Q2 2013 than in the prior quarter. Specifically, the median pre-money valuation for non-angel Series A venture financings rose from $7.6M in Q1 2013 to $8.0M in Q2 2013, equivalent to the $8.0M median Series A pre-money valuation for full-year 2012. Conversely, the median pre-money valuation for Series B rounds declined from $30.0M for Q1 2013 to $24.6M for Q2 2013, although it remained higher than the $21.0M median Series B pre-money valuation for full-year 2012. The median pre-money valuation for companies completing Series C and later rounds declined markedly, from $91.0M in Q1 2013 to $65.0M in Q2 2013, the lowest median pre-money valuation for Series C and later rounds since the $51.6M figure in Q3 2011.
Amounts Raised
Median amounts raised in equity financings saw mixed results, remaining roughly constant for Series A deals while increasing for Series B financings and falling sharply for Series C and later deals. For non-angel Series A deals, the median amount raised fell slightly from $2.3M in Q1 2013 to $2.1M in Q2 2013, which was still higher than the $1.8M figure for Q4 2012. For Series B financings, the median increased from $5.0M in Q1 2013 to $6.0M in Q2 2013, and the median amount raised in Series C and later transactions decreased sharply from $10.5M in Q1 2013 to $6.1M in Q2 2013.

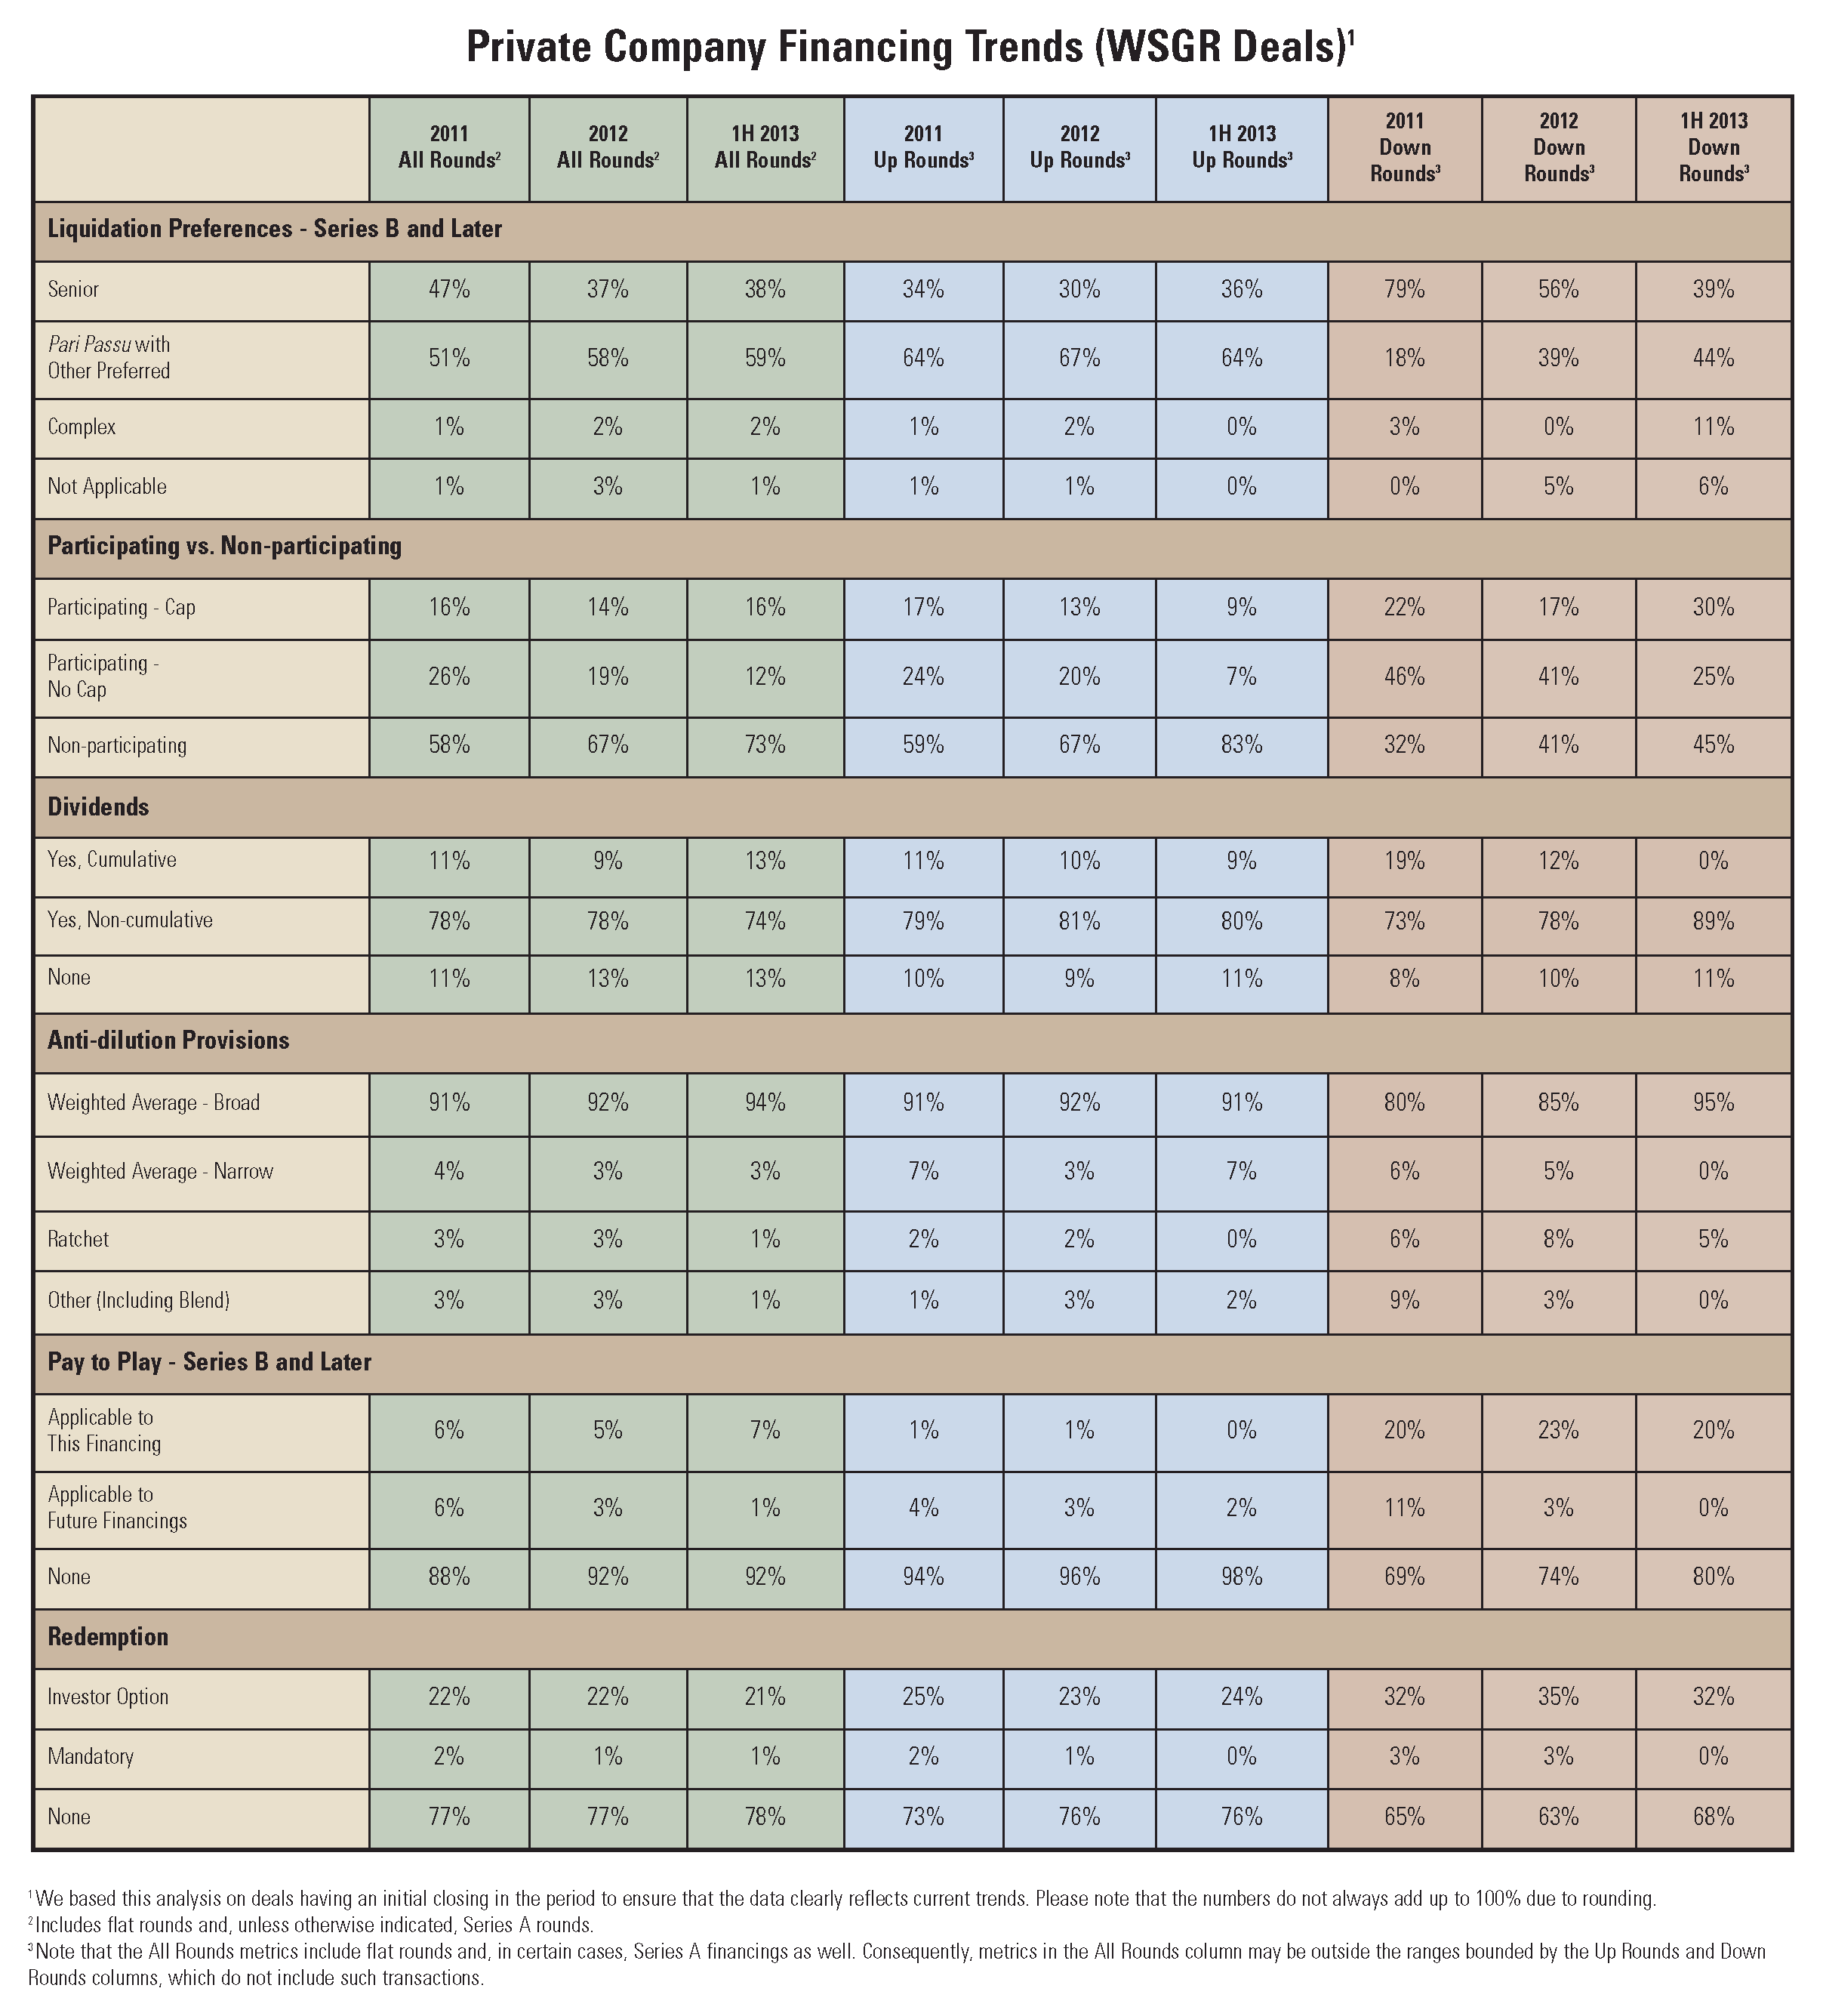
Deal Terms
Liquidation preferences. Deals with senior liquidation preferences increased slightly, from 37% of all rounds in 2012 to 38% in 1H 2013. For up rounds, the increase in the use of senior liquidation preferences was stronger, climbing from 30% in 2012 to 36% in 1H 2013. In down rounds, the use of such preferences declined from 56% in 2012 to 39% in 1H 2013. This decline was partially offset by a large rise in the use of complex preference structures in down rounds, from 0% of all deals in 2012 to 11% in 1H 2013.
Participation rights. The use of participating preferred decreased from 33% of all deals in 2012 to 28% in 1H 2013. The use of such rights in up rounds decreased substantially, from 33% of all deals in 2012 to 16% in 1H 2013, while for down rounds, the decrease in the use of participating preferred was smaller, from 58% of all deals in 2012 to 55% in 1H 2013.
Dividends. The use of cumulative dividends grew slightly, from 9% of all deals in 2012 to 13% in 1H 2013.
Anti-dilution provisions. There was a small increase in the use of broad-based weighted-average anti-dilution provisions, from 92% of all rounds in 2012 to 94% in 1H 2013.
Pay-to-play provisions. The use of pay-to-play provisions remained level in 1H 2013 as compared with 2012, at 8% of all deals.
Redemption. The overall use of redemption provisions declined slightly, from 23% of deals in 2012 to 22% in 1H 2013. In up rounds, the use of investor-option redemption in deals increased slightly, from 23% in 2012 to 24% in 1H 2013, while its use in down rounds declined from 35% to 32% over the same period.
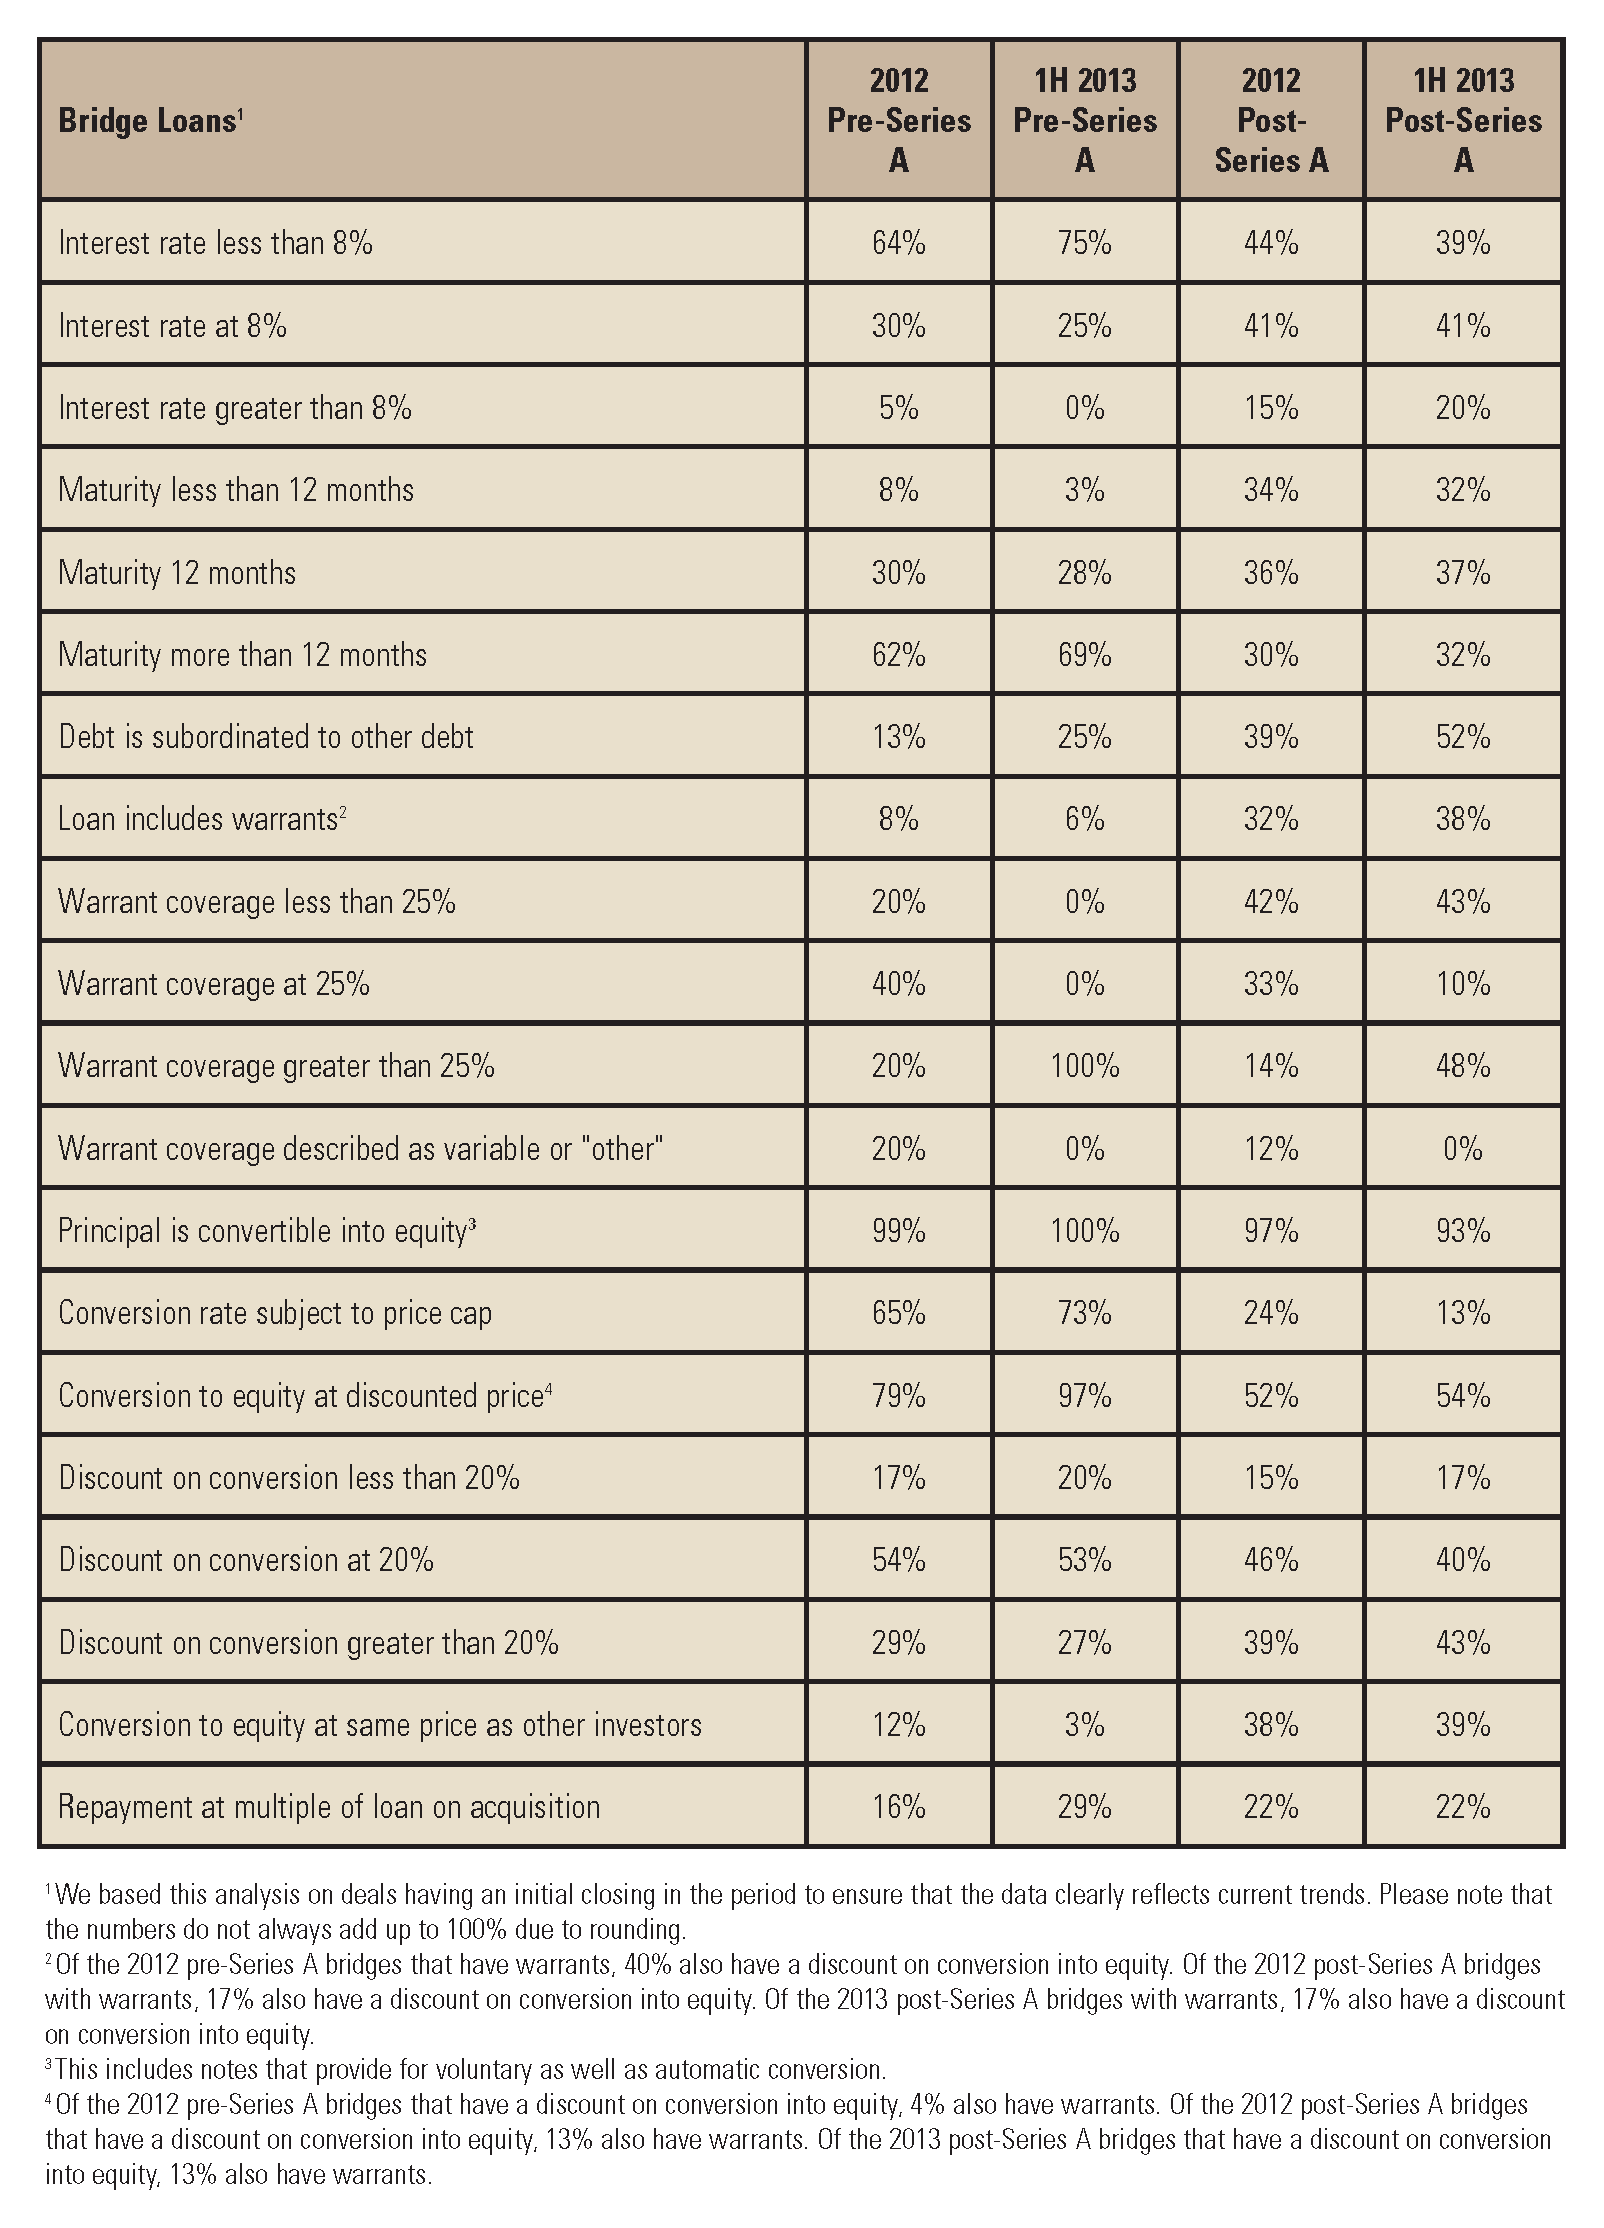
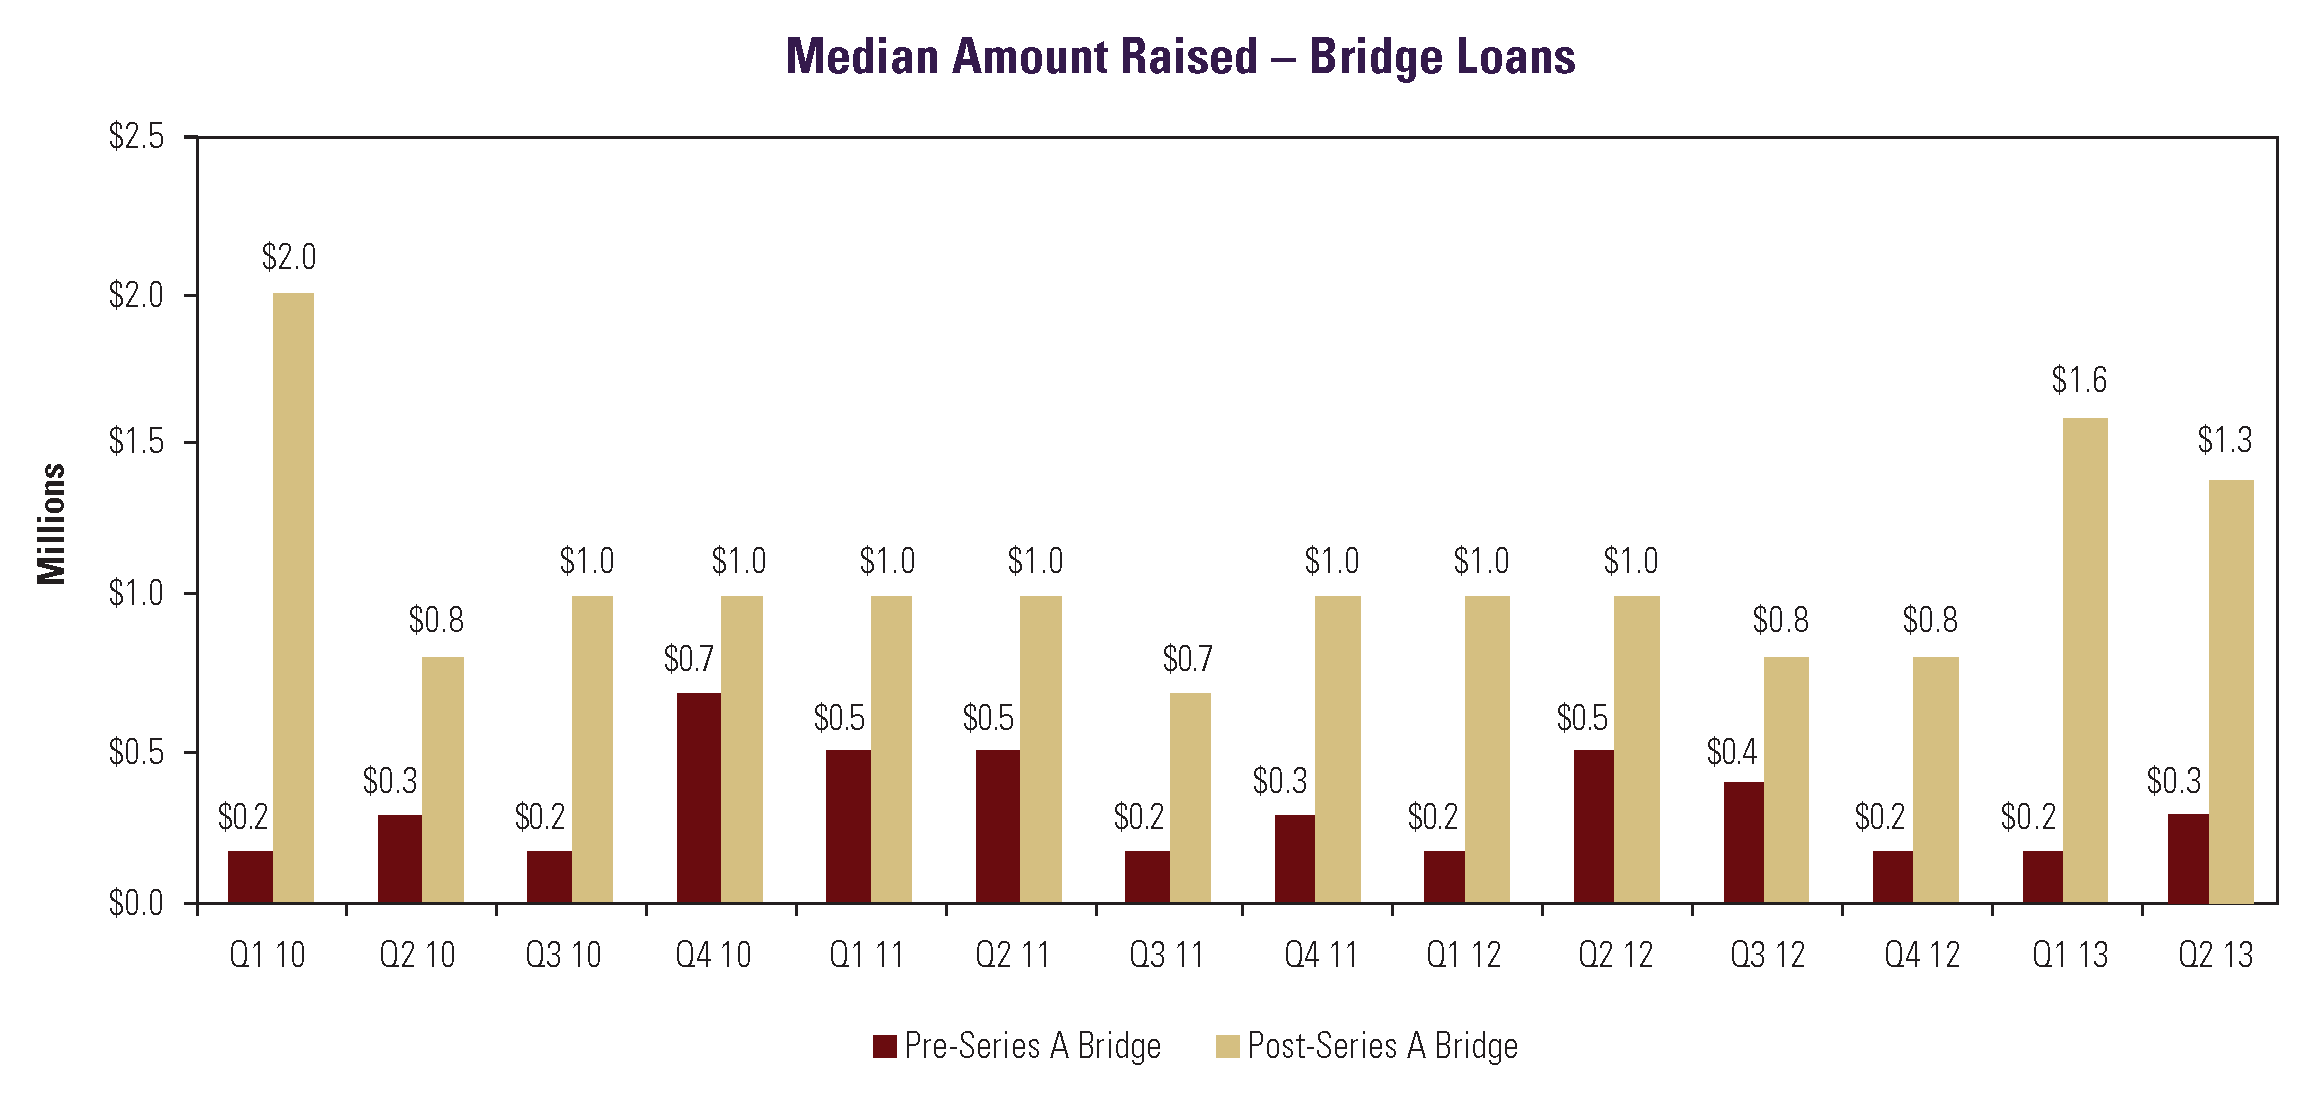
Bridge Loans
The median amount raised in pre-Series A bridge financings increased from Q1 2013 to Q2 2013 but declined in post-Series A loans. The median pre-Series A loan amount rose from $200K in Q1 2013 to $300K in Q2 2013, while the median for post-Series A loans dropped from $1.6M in Q1 2013 to $1.3M in Q2 2013.
Interest Rates. Data for 1H 2013 confirmed the previously reported trend of generally declining interest rates for pre-Series A bridge loans but generally increasing interest rates for post-Series A bridge loans. The percentage of pre-Series A bridges with annual rates under 8% increased markedly, from 64% of all deals in 2012 to 75% in 1H 2013. By contrast, the percentage of post-Series A bridge loans with annual interest rates above 8% increased from 15% of all deals in 2012 to 20% in 1H 2013. The percentage of post-Series A bridges with rates of less than 8% declined from 44% to 39%.
Maturities. Maturities for pre-Series A bridge loans remain substantially longer than for post-Series A ones. The percentage of pre-Series A deals with maturities of 12 months or more increased from 92% in 2012 to 97% in 1H 2013. For post-Series A loans, maturities of one year or more increased from 66% of loans in 2012 to 69% in 1H 2013.
Subordinated Debt. The use of subordinated debt increased between 2012 and 1H 2013 for both pre- and post-Series A bridge loans, rising from 13% of pre-Series A loans in 2012 to 25% in 1H 2013, and from 39% of post-Series A loans in 2012 to 52% in 1H 2013.
Warrants. Only a small percentage of pre-Series A loans have warrants, so we did not examine trends in warrant coverage for those deals. For post-Series A bridge loans, the use of warrants increased. In 2012, 33% of the deals with warrants had coverage at 25%. This declined to 10% in 1H 2013, while deals with more than 25% warrant coverage increased from 14% of deals with warrants in 2012 to 48% of such deals in 1H 2013.
Conversion. The percentage of pre-Series A bridge loans subject to an explicit price cap on conversion grew from 65% of deals in 2012 to 73% in 1H 2013, and 97% of such deals in 1H 2013 were convertible at a discounted price, up substantially from the 79% figure in 2012. Conversely, the percentage of post-Series A bridge loans subject to a price cap on conversion fell from 24% in 2012 to 13% in 1H 2013, while the percentage of such deals convertible at a discounted price remained roughly constant at 54% of deals in 1H 2013 as compared with 52% in 2012.
Multiples. Provision for repayment at a multiple of the loan value in the event of an acquisition increased for pre-Series A loans from 16% of deals in 2012 to 29% in 1H 2013. The percentage of post-Series A loans with such a feature remained constant at 22% for both 2012 and 1H 2013.