 Print
PrintEduardo Gallardo is a partner focusing on mergers and acquisitions at Gibson, Dunn & Crutcher LLP. This post is based on a Gibson Dunn client alert. The full publication, including tables, is available here. Related research from the Program on Corporate Governance includes The Long-Term Effects of Hedge Fund Activism by Lucian Bebchuk, Alon Brav, and Wei Jiang (discussed on the Forum here), The Myth that Insulating Boards Serves Long-Term Value by Lucian Bebchuk (discussed on the Forum here), The Law and Economics of Blockholder Disclosure by Lucian Bebchuk and Robert J. Jackson Jr. (discussed on the Forum here), and Pre-Disclosure Accumulations by Activist Investors: Evidence and Policy by Lucian Bebchuk, Alon Brav, Robert J. Jackson Jr., and Wei Jiang.
This post provides an update on shareholder activism activity involving publicly traded domestic companies during the first half of 2015. At the midway point of 2015, shareholder activism shows no signs of slowing. In fact, our survey for the first half of 2015 includes nearly as many activist campaigns as did our survey for all of 2014.
Although funds continue to make news with activist campaigns involving large domestic companies, the most notable trend is the sheer number of funds involved in activist campaigns that are captured by our survey: 42 funds in just the first half of 2015 versus 35 funds for all of 2014.
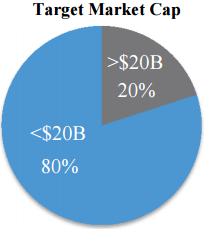
In all, our 2015 Mid-Year Activism Update covers 56 public activist campaigns at 50 unique domestic companies by 42 unique investors during the period from January 1, 2015 to June 30, 2015. Ten of those companies faced advances from at least two activist investors. Market capitalizations of the targets range from just above our study’s $1 billion minimum to approximately $120 billion.
We have included a chart of the activist campaigns covered by the survey and a statistical analysis of various trends. We have also continued our survey of settlement agreement terms with breakdowns of settlement agreements signed during the first half of 2015 and updated statistics on key settlement terms.
By the Numbers—H1 2015 Public Activism Trends
| Activist Goal | # of Campaigns |
|---|---|
| M&A | 31 |
| Board Composition | 38 |
| Return of Capital | 19 |
| Business Strategy | 9 |
| Governance | 8 |
| Management Changes | 7 |
| Control | 1 |
By the Numbers—Trends in Settlement Agreements
(2014-Present)
| Category | 2014 Average | 2015 Average | ||
|---|---|---|---|---|
| Board Seats Granted | 2.4 | 1.8 | ||
| Total Board* | 11.5 | 10.5 | ||
| Percent of Board* | 21.3% | 17.2 | ||
| *Following settlement agreement | ||||
Common Settlement Provisions (since 1/1/2014)*
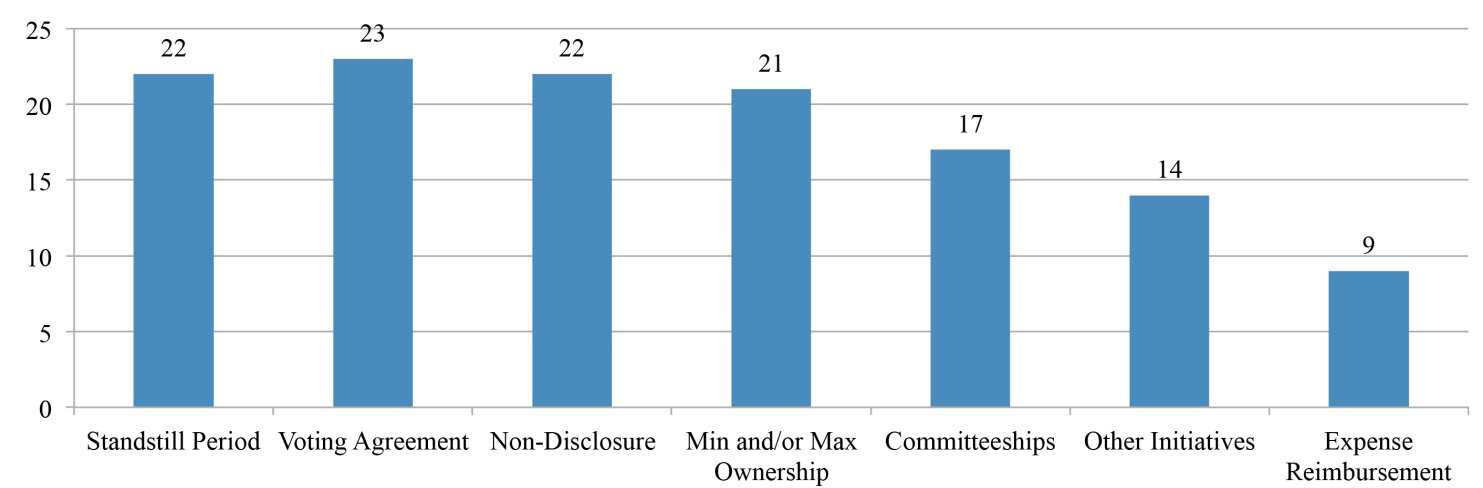
*All data represented here is derived from the data compiled from the campaigns studied for Gibson Dunn’s Activism Update and includes 12 agreements filed in 2014 and 12 agreements filed in H1 2015.
Survey of Selected H1 2015 Activist Campaigns
| Investor | Company* | Public Action Date | Market Cap (in billions) | % Ownership ** | Activist Goals | 2015 Proxy Solicitation (Y/N) |
|---|---|---|---|---|---|---|
| Ancora Advisors LLC | Shutterfly Inc. | 5/29/2015 | 1.7 | 0.001 | Board composition; governance; return of capital | N |
| Appaloosa Management | General Motors | 2/10/2015 | 53.6 | 0.011 | Board composition; return of capital | N |
| Artisan Partners | Annaly Capital Management | 5/28/2015 | 8.7 | 0.002 | Return of capital | N |
| Barington Capital Group | The Children’s Place, Inc. | 3/11/2015 | 1.4 | >2.0% (in total w/ Macellum Advisors) | Board composition; return of capital | Y |
| Blue Clay Capital Management | Select Comfort Corporation | 3/6/2015 | 1.6 | 0.02 | Board composition; business strategy | Y |
| Cadian Capital Management | Altera Corp. | 4/13/2015 | 15.4 | 0.041 | M&A | N |
| Carl Icahn | Manitowoc Inc. | 12/29/2014 | 7.8 | 0.078 | Board composition; governance; M&A | N |
| Carl Icahn | Gannett Co. | 1/22/2015 | 3.2 | 0.066 | Board composition; governance | Y |
| Carl Icahn | eBay Inc. | 2/23/2014 | 73.2 | 0.037 | Board composition; M&A | Y |
| Carlson Capital | Vitamin Shoppe, Inc. | 4/22/2015 | 1.1 | 0.053 | Business strategy | N |
| Chieftain Capital Management | Tempur Sealy International Inc. | 2/23/2015 | 4 | 0.058 | Management changes | N |
| Corvex Management | VEREIT (f/k/a American Realty Capital Properties, Inc.) | 12/29/2014 | 7.4 | 0.078 | Board composition; management changes | N |
| Corvex Management | Yum Brands Inc. | 5/4/2015 | 39.6 | 0.035 | Business strategy; M&A | N |
| Elliott Management | Citrix Systems Inc. | 6/11/2015 | 11.2 | 0.071 | Business strategy; management changes; return of capital | N |
| Elliott Management | Interpublic Group of Companies, Inc. | 7/24/2014 | 8.2 | 0.047 | Board composition; M&A | N |
| Elliott Management | Informatica Corp. | 1/25/2015 | 5.3 | 0.055 | M&A | N |
| Elliott Management | EMC Corp. | 7/21/2014 | 51.3 | 0.022 | Board composition; M&A | N |
| Engaged Capital | Rovi Corp. | 3/12/2015 | 1.6 | 0.006 | Board composition; control | Y |
| Engaged Capital | TriMas Corporation | 2/25/2015 | 1.3 | 0.016 | Board composition | N |
| FrontFour Capital Group | OM Group, Inc. | 1/9/2015 | 1 | 0.058 | Board composition; return of capital | Y |
| GAMCO Investors | Telephone & Data Systems, Inc. | 11/26/2014 | 3.2 | 0.078 | Board composition | Y |
| H Partners | Tempur Sealy International Inc. | 2/17/2015 | 4 | 0.1 | Board composition; management changes | N |
| Harry Wilson | General Motors | 2/10/2015 | 53.6 | 0.001 | Board composition; return of capital | N |
| Hayman Capital Management | General Motors | 2/10/2015 | 53.6 | 0.003 | Board composition; return of capital | N |
| HG Vora Capital Management | General Motors | 2/10/2015 | 53.6 | 0.002 | Board composition; return of capital | N |
| Ironsides Partners LLC | PIMCO Dynamic Credit Income Fund | 3/17/2015 | 2.8 | 0.01 | Board composition | Y |
| JANA Partners | Computer Sciences Corporation | 2/23/2015 | 9.3 | 0.059 | M&A | N |
| JANA Partners | ConAgra Foods, Inc. | 6/18/2015 | 18.7 | 0.072 | Board composition; business strategy | N |
| JANA Partners | Hertz Global Holdings Inc. | 10/20/2014 | 7.6 | 0.07 | Return of capital | N |
| JANA Partners | Qualcomm | 4/13/2015 | 102.1 | 0.007 | M&A; return of capital | N |
| Kerrisdale Capital Management | Webster Financial | 3/2/2015 | 3.6 | 0.016 | M&A | N |
| Land and Buildings | Macerich Co. | 4/2/2015 | 11.8 | 0.001 | Board composition | Y |
| Land and Buildings | MGM Resorts International | 3/17/2015 | 10.3 | 0.004 | Board composition; M&A | Y |
| Land and Buildings | Pennsylvania Real Estate Investment Trust | 10/29/2014 | 1.5 | 0.011 | Board composition; M&A | N |
| Luxor Capital Group | Panera Bread Co. | 4/16/2015 | 4.6 | n/a | Business strategy; return of capital | N |
| Macellum Advisors | The Children’s Place, Inc. | 3/11/2015 | 1.4 | >2.0% (in total w/ Barington Capital) | Board composition; return of capital | Y |
| Marathon Partners Equity Management | Shutterfly Inc. | 5/29/2015 | 1.7 | 0.154 | Board composition; governance; M&A; return of capital | Y |
| Marcato Capital Management | BNY Mellon | 11/13/2014 | 47.9 | 0.016 | Board composition; management changes | N |
| Marcato Capital Management | Lear Corp. | 2/3/2015 | 8.7 | 0.047 | M&A; return of capital | N |
| Marcato Capital Management | Sotheby’s | 2/20/2015 | 3.1 | 0.073 | Management changes; return of capital | N |
| MHR Fund Management | Loral Space & Communications Inc. | 3/10/2015 | 1.4 | 0.38 | Board composition | N |
| Naya Management | MSCI Inc. | 1/13/2015 | 6.9 | 0.02 | M&A | N |
| Orange Capital | American Capital, Ltd. | 3/5/2015 | 3.7 | 0.024 | M&A; return of capital | N |
| Orange Capital | Macerich Co. | 4/15/2015 | 11.8 | 0.006 | Board composition | Y |
| Orange Capital | Pinnacle Entertainment Inc. | 4/22/2014 | 2.3 | 0.049 | M&A | N |
| Pershing Square Capital | Zoetis Inc. | 11/12/2014 | 24.1 | 0.084 | Board composition; M&A | N |
| Sachem Head Capital | Zoetis Inc. | 11/12/2014 | 24.1 | 0.018 | M&A | N |
| Sandell Asset Management | Brookdale Senior Living Inc. | 2/6/2015 | 6.4 | n/a | Board composition; | Y |
| Sandell Asset Management | SemGroup Corp. | 1/26/2015 | 3.3 | n/a | M&A | N |
| Sandell Asset Management | JDS Uniphase Corp. | 9/11/2014 | 2.7 | 0.01 | Governance | N |
| Sarissa Capital Management | Ariad Pharmaceuticals Inc. | 2/13/2015 | 1.6 | 0.069 | Board composition; management changes | Y |
| Sorin Capital Management | New York REIT | 6/16/2015 | 1.6 | 0.021 | Governance; M&A | N |
| SpringOwl Asset Management | OM Group, Inc. | 6/4/2015 | 1 | 0.007 | M&A | N |
| Stadium Capital Management | Insperity, Inc. | 2/20/2015 | 1.3 | 0.059 | Business strategy; governance | N |
| Starboard Value | Brink’s Co. | 5/4/2015 | 1.4 | 0.082 | Business strategy | N |
| Starboard Value | Insperity, Inc. | 1/21/2015 | 1.3 | 0.131 | Board composition; business strategy; governance | N |
| Starboard Value | Staples, Inc. | 12/11/2014 | 9.8 | 0.077 | Board composition; M&A | N |
| Starboard Value | Yahoo! Inc. | 9/29/2014 | 36.9 | 0.007 | M&A; return of capital | N |
| Taconic Capital Advisors | General Motors | 2/10/2015 | 53.6 | 0.007 | Board composition; return of capital | N |
| TIG Advisors | Altera Corp. | 4/13/2015 | 15.4 | n/a | M&A | N |
| Trian Fund Management | DuPont E.I. De Nemours & Co. | 1/9/2015 | 58.5 | 0.027 | Board composition; M&A | Y |
| Trian Fund Management | PepsiCo Inc. | 2/14/2014 | 117.9 | n/a | Board composition; M&A | N |
| ValueAct Capital Partners | MSCI Inc. | 1/5/2015 | 6.9 | 0.083 | Board composition; M&A | N |
| Wynnefield Capital | OM Group, Inc. | 6/12/2015 | 1 | 0.004 | M&A | N |
| * Study covers selected activist campaigns involving publicly traded domestic companies with equity market capitalizations of greater than $1 billion as of June 30, 2015 (unless company is no longer public). | ||||||
| ** Ownership is as of June 30, 2015 and includes economic exposure to derivatives where applicable. | ||||||
