Print
PrintMalcolm Baker is Professor of Finance at Harvard Business School. This post is based on an article authored by Professor Baker; Brock Mendel of Harvard University; and Jeffrey Wurgler, Professor of Finance at New York University.
In our paper, Dividends as Reference Points: A Behavioral Signaling Model, which is forthcoming in the Review of Financial Studies, we use loss aversion, a feature of the prospect theory value function of Kahneman and Tversky (1979), to motivate a behavioral signaling model. A loss-averse value function has a kink at the reference point whereby marginal utility is discontinuously higher in the domain of losses. Loss aversion is supported by a considerable literature in psychology, finance and economics, as we briefly review later.
Why do we need another model of dividends? As background, managers share a number of common views about their dividend policies, as shown in the survey by Brav, Graham, Harvey, and Michaely (2005). They strive to avoid reducing dividends per share (of the 384 managers surveyed, 93.8% agreed); they try to maintain a smooth dividend stream (89.6%); and, they are reluctant to make changes that might have to be reversed (77.9%). They follow such policies because they believe that there are negative consequences to reducing dividends (88.1%), which they believe convey information to investors (80%). While caution is merited in interpreting survey responses, the Brav et al. results are further consistent with Lintner’s (1956) own survey and interviews, his partial-adjustment model, and a large empirical literature demonstrating a significant response to dividend announcements.
While managers view dividends as some sort of signal to investors, they cast doubt on the mechanisms of standard dividend signaling models. For example, the proposition that dividends are used to show that their firm can bear costs such as borrowing external funds or passing up investment—a typical approach in the theoretical literature—was summarily rejected (4.4% agreement, the lowest in the entire survey). The idea of signaling through costly taxes did not receive much more support (16.6%).
The essence of our model is that investors evaluate current dividends against a psychological reference point established by past dividends. Because investors are particularly disappointed when dividends are cut, dividends can credibly signal information about earnings. The model is inherently multiperiod, which leads to more natural explanations for the survey results above and other facts about dividend policy such as the Lintner partial-adjustment model, which static signaling models cannot address. While it is difficult to measure investor utility functions per se outside the laboratory, we perform some novel tests that get at the core intuitions of the approach.
To provide a bit more detail, the model uses reference point preferences as the mechanism for costly signaling. The manager’s utility function reflects both a preference for a high stock price today and for avoiding a dividend cut in the future. In the first period, the manager inherits an exogenous reference level dividend, and receives private information about earnings. The manager balances the desire to signal current earnings by paying higher dividends with the potential cost of not being able to meet or exceed a new and higher reference point through the combination of savings from the first period and random second-period earnings. In equilibrium, managers that cannot meet the inherited dividend level pay out everything in the first period, as the marginal cost of missing the reference point is high; managers with intermediate first-period earnings pool to pay the reference dividend; and managers with strong first-period earnings pay out a fraction that raises the reference level for the future but, given their savings and expected second-period earnings, to a level they are relatively confident that they can maintain.
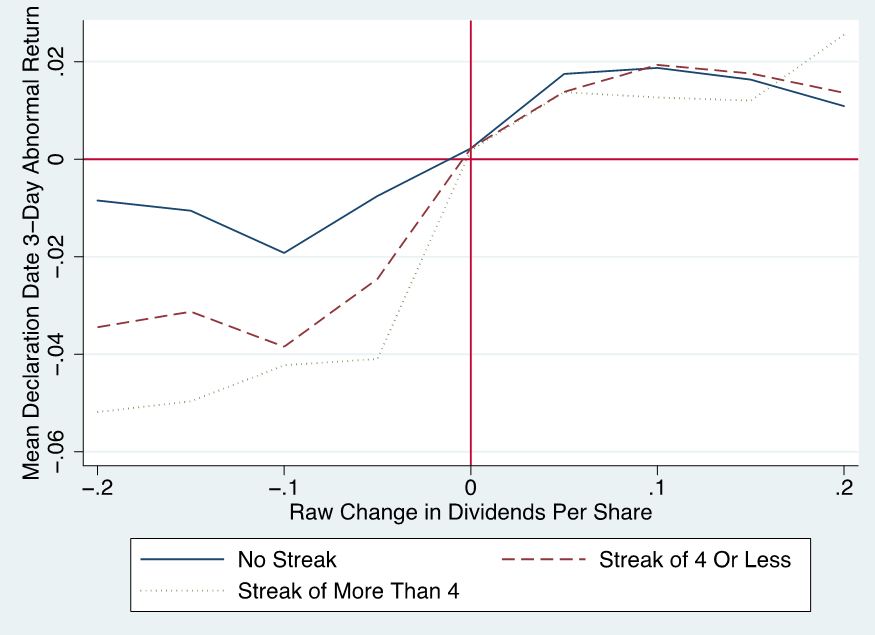
Our main new test examines the general intuition of signaling around a moveable reference point. In particular, the market reactions to changes, is stronger when reference point effects are stronger. While we do not model memory and salience, we hypothesize that the repetition of a particular dividend level tends to ingrain a reference point. Consistent with this hypothesis, we find that the asymmetric response to dividend changes is more pronounced when the new dividend breaks a multi-year streak of quarterly dividends per share. This is demonstrated in the paper in a figure that is reproduced below.
Let us recap. Standard dividend signaling theories posit that executives use dividends to destroy some firm value and thereby signal that plenty remains. The money burning typically takes the form of tax-inefficient distributions, foregone profitable investment, or costly external finance. The executives who actually set dividend policy overwhelmingly reject these ideas—yet, at the same time, are equally adamant that “dividends are a signal” to shareholders and that cutting them has negative consequences.
We develop what we believe to be a more realistic signaling approach that fits these facts. We use loss aversion, which is widely supported in both the experimental and empirical literatures, to create a model in which past dividends are reference points against which future dividends are judged.
The full paper is available for download here.
Figure 1. Market reaction following quarterly dividend per share streaks. Average 3-day abnormal return by change in quarterly dividends per share. Changes in dividends per share are sorted into groups of 0.05, by rounding the raw dividend per share down to the nearest threshold. We partition the sample into situations where the dividend was changed in the previous period (No Streak), where the dividend was not changed in the previous period, but it was changed within the last four periods (Streak of 4 or Less), and where the dividend was not changed in the previous four periods (Streak of More Than 4). 3-day abnormal returns are computed as the sum in the three days surrounding the dividend declaration date of the difference between the total return and the CRSP value-weighted stock index return. The sample is further limited to changes over a three-month window with no stock splits.