 Print
PrintAubrey E. Bout is a Partner in the Boston office of Pay Governance LLP. This post is based on a Pay Governance memorandum by Mr. Bout, Brian Wilby, and Steve Friedman.
Executive pay continues to be a hotly debated topic in the boardroom among investors and proxy advisors, and it routinely makes headlines in the media. As the U.S. was in the heart of the financial crisis in 2008-2009, CEO total direct compensation (TDC = base salary + actual bonus paid + grant value of long-term incentives) dropped for two consecutive years. As the U.S. stock market sharply rebounded and economy stabilized and started to slowly grow again, CEO TDC also rebounded. Large pay increases occurred in 2010 and they were primarily in the form of larger LTI grants. Since then, year-over-year increases have been fairly moderate—in the 3% to 6% range. While CEO pay increases have been higher than seen for the average employee population, they are well aligned with company stock price performance.
Based on past pay trends and current earnings growth projections, we expect that actual 2015 CEO TDC increases and 2016 target TDC will likely be flat to up and in the low-single digits and will vary quite considerably by industry and be highly dependent on individual company performance. This assumes a slow down in the global economy, continued strong U.S. dollar which translates into lower revenues and earnings, soft stock market and slow down in earnings growth. Executives in industries that are continuing to see meaningful earnings growth at their companies will likely see bigger pay increases than those executives in industries where a slow-down is occurring.
Overall Trend in CEO TDC
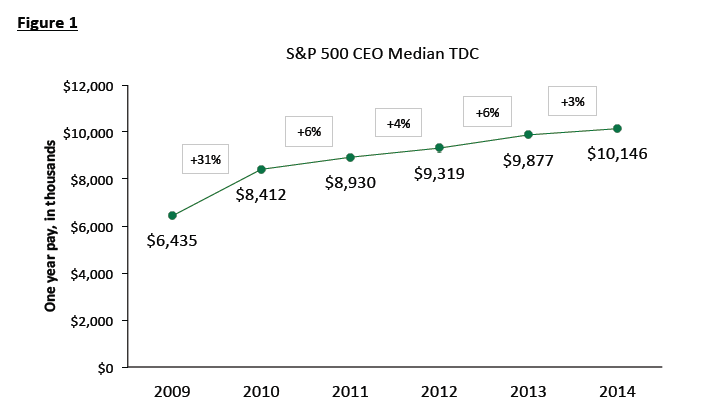
CEO TDC rebounded 31% in 2010 after two consecutive years of decreases during the financial crisis (see Figure 1). Since then year-over-year pay increases have been fairly moderate—in the 3% to 6% range. The mix of LTI awards changed little between 2013 and 2014 after a dramatic shift away from stock options. From 2009 to 2014, performance share usage increased from 31% to 50%, stock option usage decreased from 44% to 27%, and restricted stock usage remained relatively constant.
Trend in CEO TDC versus S&P 500 Index Performance
CEO TDC increases have been supported by strong operating performance and total shareholder return (TSR)—annualized pay increases over the last 5 years have trailed TSR performance by more than 5 percentage points. Figure 2 shows that in every year that TSR increased, CEO TDC increased. The increases in pay were not always proportionate to TSR increase; in 3 out of 5 years the increases were lower than the TSR increase and in cumulative the pay increases were significantly lower than the S&P 500 index increase (see Figure 2 and 3).
There is clear positive correlation between share price performance and CEO TDC. This correlation occurs as the share price increases, it is likely that the Compensation Committees and Boards would be supportive of CEO pay increases, likely in the form of larger LTI grants (target TDC increases may also occur as competitor/ peer company pay median increases). CEO base salaries may only periodically increase and typically only make up a small portion of the executive pay package. Annual actual bonuses, though not as large as the LTI portion, can have a meaningful impact on whether year‐over‐year pay increases. Most often when a company is having a good year and exceeding budget goals and investor analyst expectations, the CEO bonus pays out above target and increases year-over-year (often the share price also increases as company performance is strong).
That said, there will be some years where a CEO’s bonus pays out above target as the company exceeded its budgeted goals, while the share price went down due to stock market volatility/ correction and sector rotation. The opposite also can happen, where goals are not met, resulting in lower bonuses, while the stock price and overall stock market goes up.
Figure 2.
| Year | CEO TDC Increase | S&P 500 Total Return |
|---|---|---|
| 2010 | 31% | 15% |
| 2011 | 6% | 2% |
| 2012 | 4% | 16% |
| 2013 | 6% | 32% |
| 2014 | 3% | 14% |
| Annualized Rate | 10% | 15% |
| Cumulative Amount | 58% | 105% |
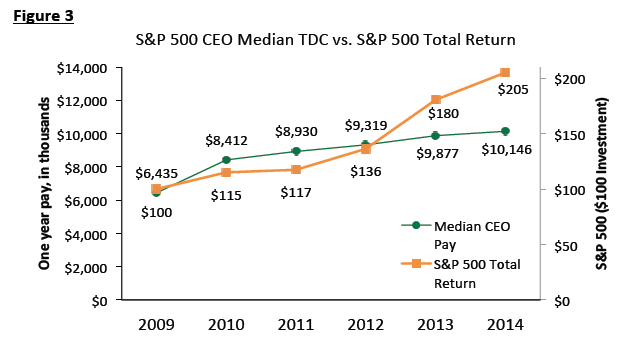
S&P 500 CEO TDC and the return of the S&P 500 have both increased since 2009, with the S&P 500 performance increasing at a faster rate than CEO pay. More recent CEO TDC increases have been relatively moderate compared to the overall S&P 500 achievements.
CEO Pay Projections
- We expect that overall 2015 actual pay (reported in 2016 proxies) will be flat to up in the low single digits for many executives in most industries as profits will likely increase only slightly from 2014 levels.
- Our research suggests that CEO TDC increases are decelerating (also noted in Figure 1)
- Aggregate S&P 500 company YoY earnings for 2015 are forecasted to be up flat at best; further, S&P 500 2015 calendar year performance has been 3% through 11/30/15 which is relatively weak compared to the double-digit gains and 15% annualized TSR gain over the last five years.
- S&P 500 earnings are forecasted to be up again in 2016, which, if achieved, may influence higher actual pay levels for next year if earnings growth starts to accelerate again.
- In certain industries such as healthcare and biotechnology, executives may experience continued faster growth in total compensation in 2015 while executives in other industries such as energy, particularly oil & gas, might see a contraction or flat executive pay as stock and oil prices have remained low.
- We expect general industry executive target pay TDC levels to be up only modestly in 2016, due to economic uncertainty, possibly a slow growth earnings environment going forward and stock market uncertainty. The exception would be for executives who outperform their peers and exceeded the annual goals in 2015—those CEO’s might see larger pay increases than the norm.
The above pay projections do not account for any potential market setbacks i.e., the nervousness about geopolitical uncertainty, dramatic changes in the economic environment, unexpected changes in the U.S. Federal Reserve’s policies on interest rates, or significant drops in the overall stock market.
Methodology
The CEO TDC analysis consists of 180 S&P 500 CEOs who have been CEO since 2009. Pay data includes base salaries and bonuses paid for each year, as well as the reported grant date fair value of long-term incentive awards. Our analysis of consistent incumbent CEOs was designed to highlight true changes in CEO compensation (as opposed to changes in pay driven by the hiring of a new CEO or internally promoted CEOs who typically experience ramped-up pay over a two to three period).
Conclusion
It is important to note that our methodology used year-over-year CEO TDC and was based on accounting value of LTI as reported in proxy summary compensation tables. These amounts are more akin to pay opportunity and quite different from realizable pay, which includes in-the-money value of stock options, ending period value of restricted stock and estimated value of performance shares. Pay Governance’s past research has shown there is a very strong correlation between realizable pay and TSR performance. While we have shown that there is a positive correlation between CEO annual pay increases and TSR performance, our past research has shown that there is a higher correlation between realizable pay and TSR increases.
The upcoming year will be challenging for some Compensation Committees as they will struggle with how much, if any, to increase CEO target pay in 2016. It might be still too early to predict that CEO pay increases are a thing of the past, at least for next year, just as it is speculative to say that equities are already in a long-term bear market.