 Print
PrintShui Yu is a senior executive compensation analyst at Willis Towers Watson. This post is based on a Willis Towers Watson publication by Ms. Yu, Chris Kozlowski, and Steve Kline, originally published on Willis Towers Watson’s Executive Pay Matters blog and reprinted here with permission. © Willis Towers Watson 2016. Related research from the Program on Corporate Governance includes: Paying for Long-Term Performance by Lucian Bebchuk and Jesse Fried (discussed on the Forum here).
Financial and stock performance throughout the S&P 1500 deteriorated in 2015 as summarized in Figure 1. (For a more detailed analysis, see Year-end 2015 pay-for-performance update for the S&P 1500: Incremental improvement for 2016?, Executive Pay Matters, April 21, 2016.) Our review of proxy statement disclosures that were filed this spring reveals the impact those results had on CEO pay, namely, for the bonus payouts and “compensation actually paid” under long-term incentive plans.
Figure 1. Recap of 2015 S&P 1500 scorecard

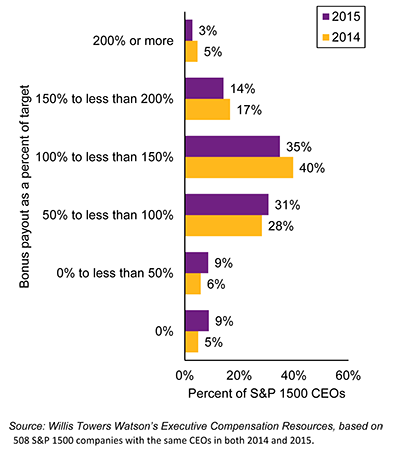
While the overall financial trends might suggest relatively weak bonuses for 2015, the result was far more neutral: the median payout for S&P 1500 CEOs was 102% of target. Just under half (49%) of the 508 CEOs in our sample earned at- or below-target payouts, and the rest were above target. This contrasts with the more robust payouts we saw for 2014, in which the median payout was 110% of target and only 39% of the sample earned at- or below-target awards. On balance, the decline in CEO bonus payouts from 2014 to 2015 would appear to have been warranted. See Figure 2 for a comparison of the distribution of bonus payments for 2015 versus 2014.
Figure 2. Distribution of CEO bonus payouts in the S&P 1500
What’s interesting is that this payout trend was replicated in most business sectors, although two sectors (health care and utilities) reported substantially higher bonuses and fewer instances of below-target payouts. The weakest bonuses actually came in the materials sector, with below-target bonuses being the norm. Notably, the beleaguered energy sector fell within the neutral trend, with bonus payouts reflecting a combination of reduced expectations (goals), use of nonfinancial measures and/or unplanned adjustments to payouts.
The takeaway is that companies in every sector tend to calibrate annual incentive plan goals around the prevailing economic conditions, hence the neutral pay-for-performance outcomes in 2015 despite fairly modest performance in comparison to timeless standards. Even so, each sector produces its own winners and losers with respect to incentive payments.
As Executive Pay Matters readers know, the Securities and Exchange Commission’s proposed rules for disclosing pay versus performance were issued more than a year ago, but have yet to be finalized. Nevertheless, with an eye toward the new disclosure possibly taking effect as soon as next spring, we evaluated “compensation actually paid” for the S&P 1500 CEOs within our sample. To recap, compensation actually paid starts with Summary Compensation Table pay, with the following adjustments:
- Stock awards are valued at the time they vest based on the price at vesting (rather than at grant).
- Stock options also are valued upon vesting using a fair value (e.g., Black-Scholes) that considers stock price movements since the grant date.
- The increase in accrued benefits under pension plans is replaced by the actuarially determined service cost.
As context, the S&P 1500 index was up about 49% over the three years ending 2015, and long-term incentives (LTIs) among the companies in our sample were roughly allocated 50% to performance plans, 25% to restricted stock (or units) and 25% to stock options.
When we consider the value of these LTI awards upon vesting in 2015, we again see a fairly neutral outcome if we compare the vested value to the target awards granted in 2015. This is because the rise in the stock price, largely due to strong market gains in 2013, enhanced the value of LTI upon vesting and on balance was enough to offset performance awards that were not fully earned. As a result, most sectors showed compensation actually paid that approximated the target values. Health care and retail are two positive exceptions, while energy and materials are two negative exceptions.
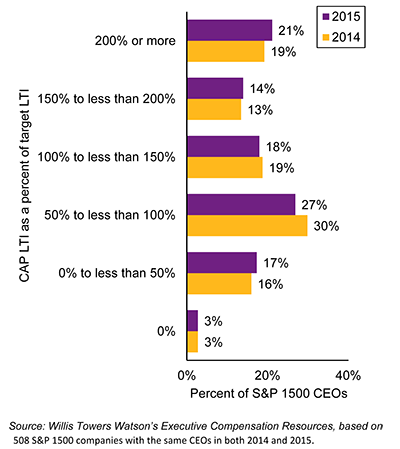
Figure 3 compares compensation actually paid (CAP) LTI to target LTI. In both 2014 and 2015, there was a rather wide dispersion among S&P 1500 CEOs, with the two largest buckets being “from 50% of target up to target” and “more than 200% of target.” While the split of above/below target in each year is about 50/50, there are clearly some high outliers in the data, as the average values of our sample in each of 2014 and 2015 were 134% and 143%, respectively. The robust LTI outcomes generally benefit from above-target performance results coupled with an elevated stock price.
Figure 3. CAP LTI as a percent of target LTI in the S&P 1500
With pay-for-performance alignment near the top of most compensation committees’ agendas and with the economy continuing to challenge many sectors, it strikes us that the distribution of incentives and compensation actually paid will increasingly become a focal point as companies seek to set challenging but attainable goals. While the past distribution of pay does not predict future performance, the era of big data and analytics is coming to executive compensation and Willis Towers Watson is working with a growing number of clients to model future compensation payable under financial- and market-based incentive plans. Predictive modeling can be an effective tool to help companies strike the right balance between the need to set attainable goals that motivate management and holding management accountable to shareholders for performance.
