 Print
PrintLaarni T. Bulan is a Principal at Cornerstone Research. This post is based on a Cornerstone publication by Ms. Bulan, Ellen M. Ryan, and Laura E. Simmons.
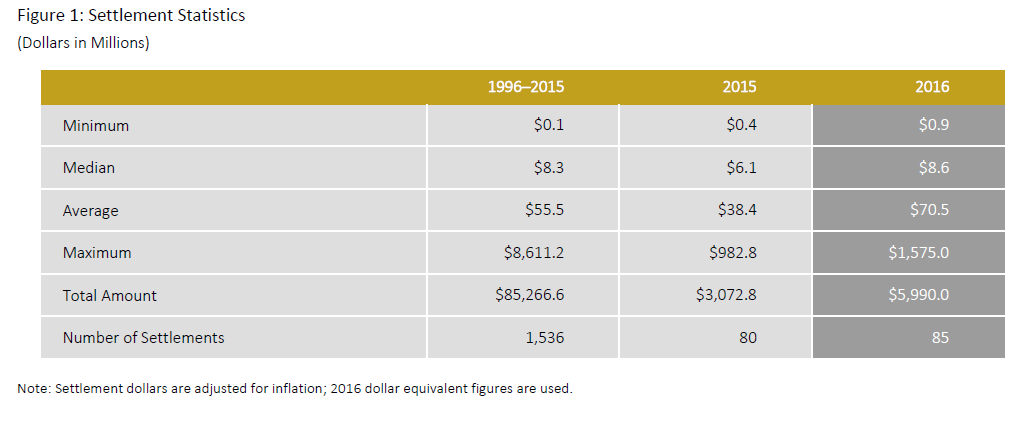
Continuing the growth observed in the prior year, the number of settlements approved in 2016 increased to 85—substantially higher than the levels in 2011 through 2014. This escalation can be attributed to the recent increase in case filings.
Mega Settlements
Ten mega settlements in 2016—the highest number over the last 10 years—contributed to an almost twofold increase in the average settlement amount from 2015 to 2016. Two of the mega settlements exceeded $1 billion. This was the first year since 2006 with multiple settlements over $1 billion.
“Estimated Damages”
To understand the latest settlement trends, it is helpful to consider the important determinants of settlement amounts. The most important factor in explaining settlement amounts is a proxy (“estimated damages”) for shareholder damages. For settlements approved in 2016, average “estimated damages” reached the second-highest amount over the last 10 years. Settlements as a percentage of “estimated damages” also increased over 2015, indicating that other factors likely contributed to the rise in settlement amounts as well. In particular, the percentage of settlements with public pension plans as lead plaintiffs and the number of restatement cases increased in 2016. In addition, the size of the issuer defendant (as measured by total assets) was substantially higher in 2016 as compared to 2015. All of these factors are associated with higher settlement amounts.
Developing Trends
The record number of case filings in 2016, coupled with four consecutive year-over-year increases, may continue to fuel growth in the number of settlements into the coming years.
While the number of settlements may increase, the most recent data on case filings, however, indicate a potential decline in very large cases, as measured by market capitalization losses. This suggests that, at some point in the next few years, a drop in mega settlements may follow.
Industry trends among securities class actions have fluctuated in the last 20 years but, according to Cornerstone Research’s Securities Class Action Filings—2016 Year in Review, healthcare and related industry sectors, such as biotech and pharmaceuticals, may play a growing role in both the number and total dollar amounts of settlements in securities class actions.
Total Settlement Dollars
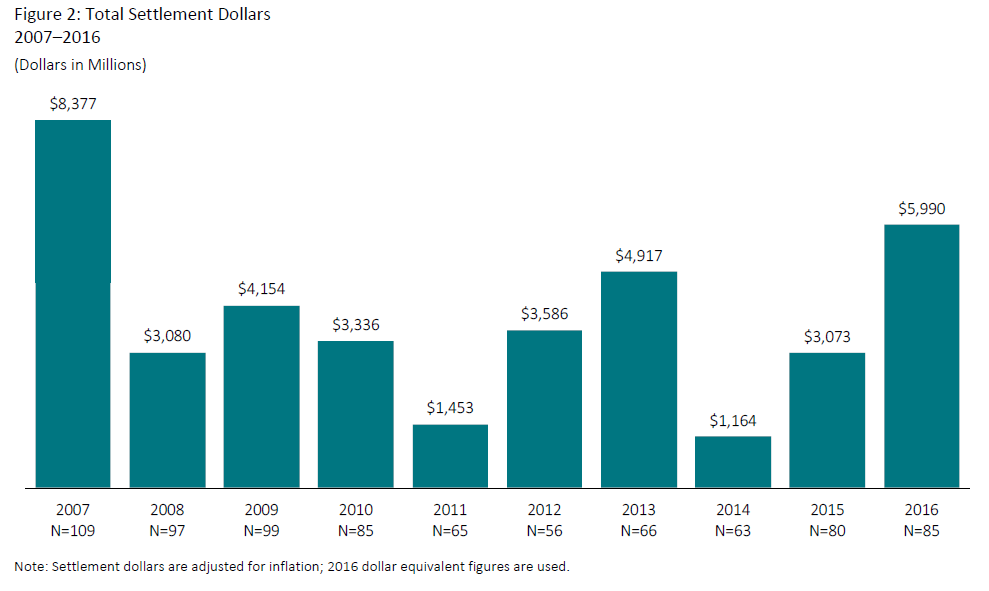
- The total value of settlements approved by courts in 2016 was more than $5.9 billion, almost double the amount approved in 2015.
- The number of settlements approved in 2016 increased only modestly from 2015, but grew substantially over the annual numbers from 2011 to 2014.
- The higher number of mega settlements in 2016 and the corresponding higher average settlement value for these cases contributed to the substantial increase in total settlement dollars.
Mega Settlements
- Four of the 10 approved mega settlements in 2016 were between $100 million and $250 million; four were between $250 million and $500 million; and two exceeded $1 billion. The last observed settlement over $1 billion was in 2013.
- The median mega settlement in 2016 was $318 million, almost twice the median in 2015.
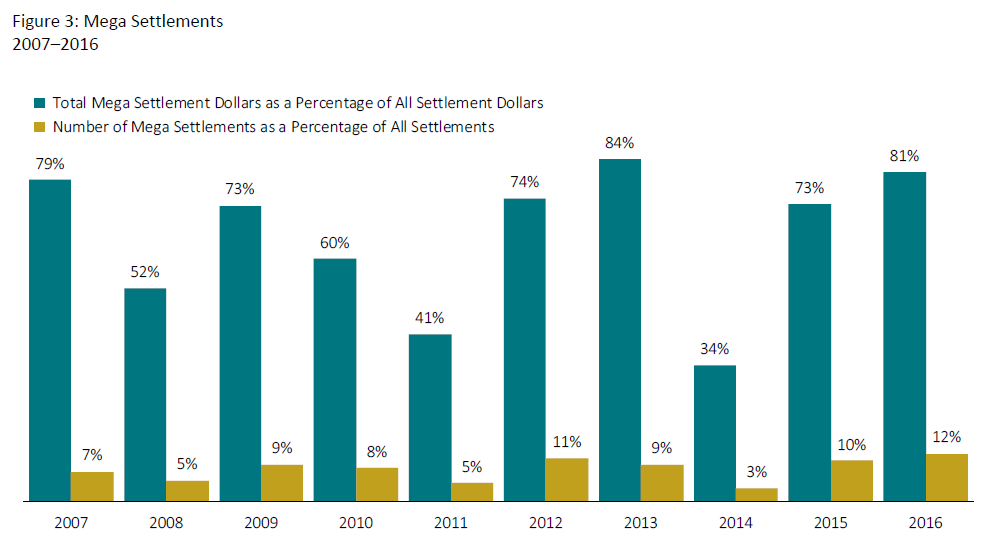
- In 2016, $4.8 billion of the total $6 billion settlement value came from mega settlements.
- The number of mega settlements as a percentage of all settlements in 2016 was the highest over the last 10 years.
- Mega settlements have accounted for 72 percent of all settlement dollars on average from 2007–2016.
Settlement Size
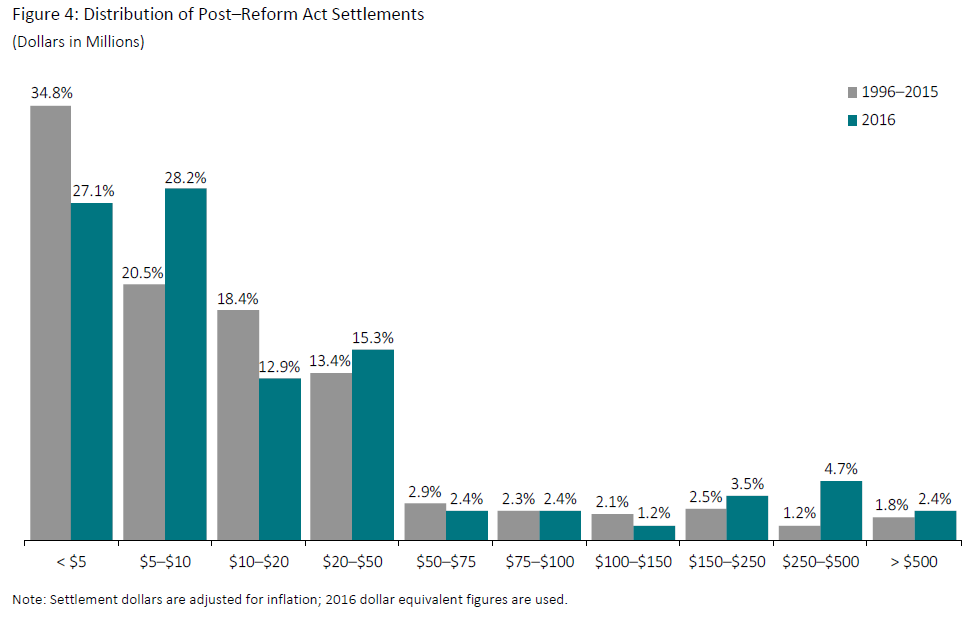
- The proportion of cases settling for $2 million or less (often referred to as “nuisance suits”) in 2016 was 12 percent (10 cases), a drop from 25 percent (20 cases) in 2015 and a return to 2013 and 2014 proportions.
- The percentage of cases settling for less than $5 million also decreased in 2016 compared to prior years.
- In 2016, 56 percent of settlements fell between $5 million and $50 million, 18 percent higher than the rate for all prior post-Reform Act years.
- Among all post-Reform Act settlements, 79 percent have been for amounts equal to or less than $25 million.
- The higher proportion of 2016 cases settling for $150 million or more reflects the record number of mega settlements compared to the last 10 years.
- Median total assets for issuer defendants settling in 2016 were more than 41 percent higher than the median asset value for 2015 settlements (adjusted for inflation) and 15 percent higher than the median total assets for issuers settling in the prior 10 years.
Damages Estimates and Market Capitalization Losses
“Estimated Damages”
“Estimated damages” are a simplified measure of potential shareholder losses that allows for use of a consistent method in this study and therefore the identification and analysis of potential trends. While “estimated damages” are found to be the most important factor in predicting settlement amounts, they are not necessarily linked to the allegations in the associated court pleadings. The damages estimates presented in this post are not intended to be indicative of actual economic losses borne by shareholders.
- Average and median “estimated damages” for 2016 increased modestly from 2015 (9 percent and 8 percent, respectively).
- Compared to the average and median values for the previous five years (2011–2015), however, 2016 average “estimated damages” were 30 percent higher while median “estimated damages” were 14 percent lower.
- Overall, higher “estimated damages” are associated with larger issuer defendants (measured by total assets of the issuer) and more mature firms (measured by the length of time publicly traded). In addition, plaintiffs are more likely to name third-party defendants in larger cases (as measured by “estimated damages”).
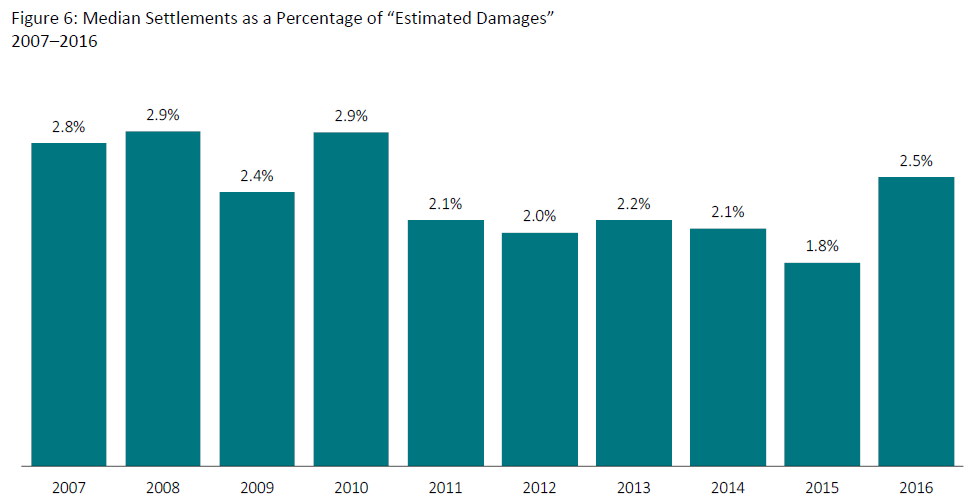
- In 2016, median settlements as a percentage of “estimated damages” increased 39 percent over 2015.
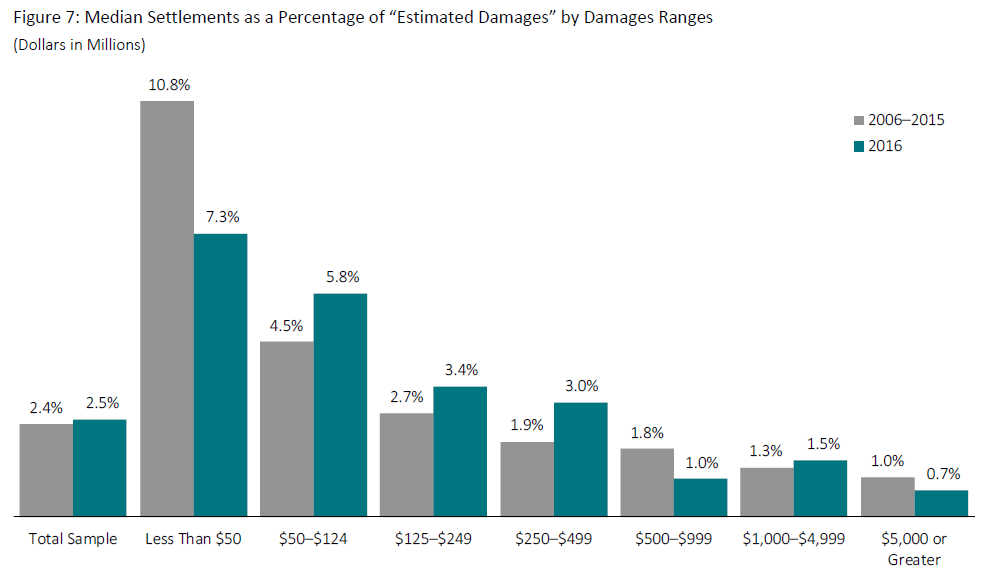
- While the median settlement as a percentage of “estimated damages” for mega settlements has often been lower than for non-mega settlements, in 2016 it was slightly higher (2.7 percent and 2.5 percent for mega settlements and non-mega settlements, respectively).
- Smaller cases settled for a lower percentage of “estimated damages” in 2016 relative to mid-range cases when compared to prior years.
- Median settlements as a percentage of “estimated damages” in 2016 increased 24 percent from the 2011–2015 median and were higher than any percentage in the last five years.

Damages Estimation Approaches
“Estimated Damages” vs. Tiered Damages
Tiered damages are an alternative damages measure based on the dollar value of stock price movements on dates detailed in the settlement plan of allocation. They provide an alternative measure of potential investor losses for more recent securities class action settlements.
As a measure that is based on specific company stock price declines (either at the end or during the class period), rather than daily deviations from movements in an index, tiered damages are conceptually more closely aligned with the approach typically followed by plaintiffs in recent years to estimate damages. The methodology for tiered damages also accounts for the U.S. Supreme Court’s 2005 landmark decision in Dura whereby damages cannot be associated with shares sold before information regarding the alleged fraud reaches the market.
Tiered damages, like “estimated damages,” are highly correlated with settlement amounts and are an important component in ongoing analyses of settlement outcome determinants.

Disclosure Dollar Loss
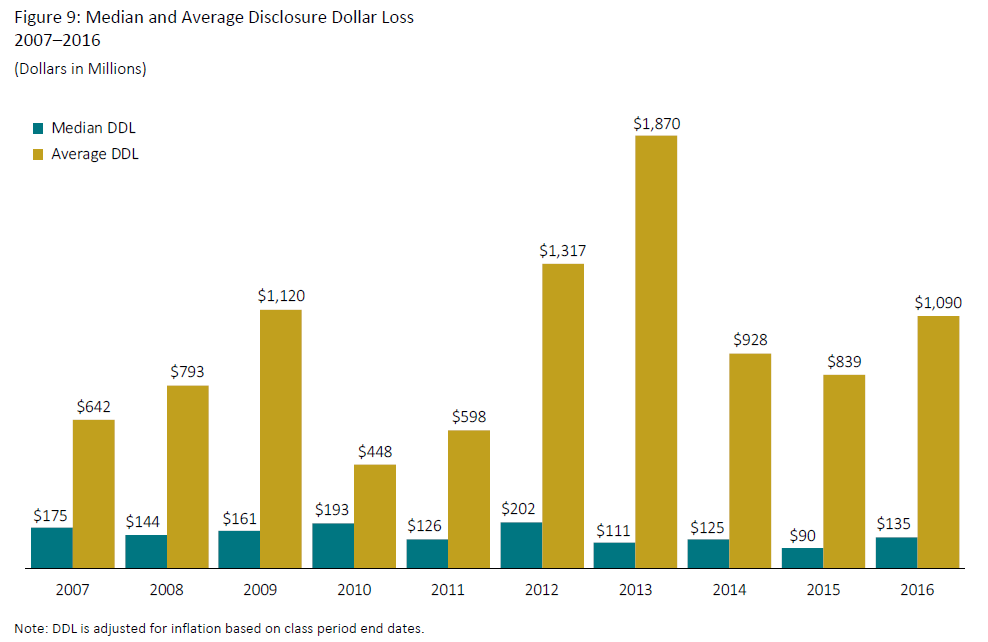
Disclosure Dollar Loss (DDL) captures the stock price reaction to the class-ending disclosure that resulted in the first filed complaint. DDL is calculated as the decline in the market capitalization of the defendant firm from the trading day immediately preceding the end of the class period to the trading day immediately following the end of the class period and, as such, does not incorporate any estimate of the number of shares traded during the class period.
- With an increase in both the average and median DDL over 2015, the trend in DDL for cases settled in 2016 follows a pattern similar to that for “estimated damages.”
- While the aggregate trends in DDL and “estimated damages” are often similar, for individual cases, the two measures typically differ substantially.
- Total DDL associated with settlements approved in 2016 was nearly $81 billion, 20 percent below the average from 2007 through 2015.
Analysis of Settlement Characteristics
Nature of Claims
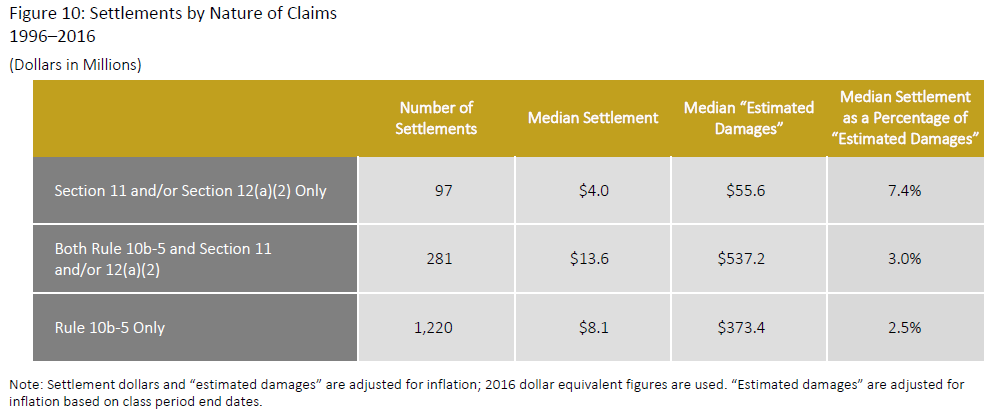
- In 2016, there were 10 settlements involving Section 11 and/or Section 12(a)(2) claims (’33 Act claims) that did not involve Rule 10b-5 allegations, the second most active year in the last decade.
- Cases settling in 2016 involving combined claims (Rule 10b-5 and Section 11 and/or Section 12(a)(2) claims) had, on average, twice as many federal docket entries as cases involving just Rule 10b-5 claims—indicating the more complex nature of such matters.
- As reported in Cornerstone Research’s Securities Class Action Filings—2016 Year in Review, the frequency of filings involving Section 11 claims in California state courts has increased in recent years.
- Four of the five state court settlements in 2016 were for California state cases with ’33 Act claims only.
Accounting Allegations
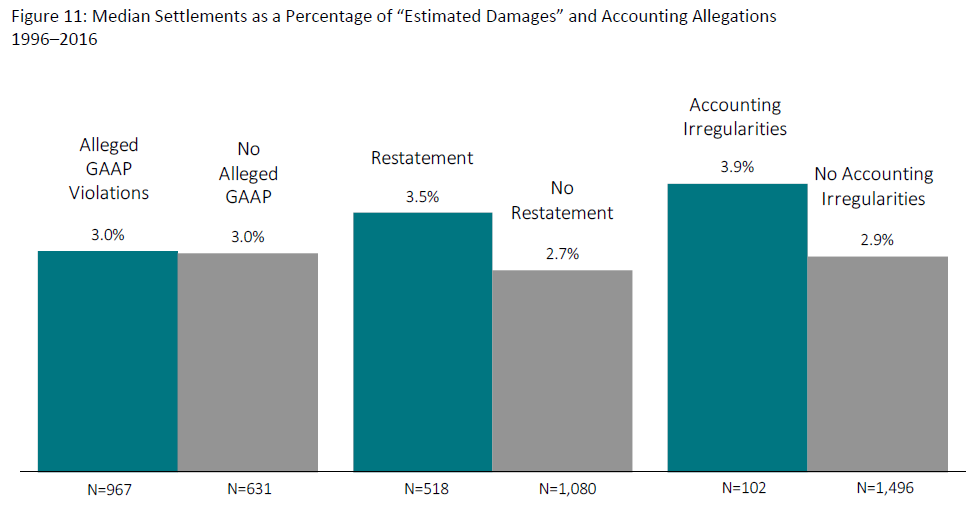
This research examines three types of accounting issues among settled cases: (1) alleged GAAP violations, (2) restatements, and (3) reported accounting irregularities. For further details regarding settlements of accounting cases, see Cornerstone Research’s annual report on Accounting Class Action Filings and Settlements.
- Among all post-Reform Act settlements, alleged GAAP violations are included in approximately 60 percent of cases. In 2016, however, the frequency of GAAP violation allegations was 54 percent.
- Restatements were involved in more than 30 percent of cases settled in 2016. These cases were associated with higher settlements as a percentage of “estimated damages” compared to cases without restatements.
- In 2016, no settlements involved reported accounting irregularities, and there was only one such case among 2015 settlements. Historically, approximately 6 percent of cases involve accounting irregularities.
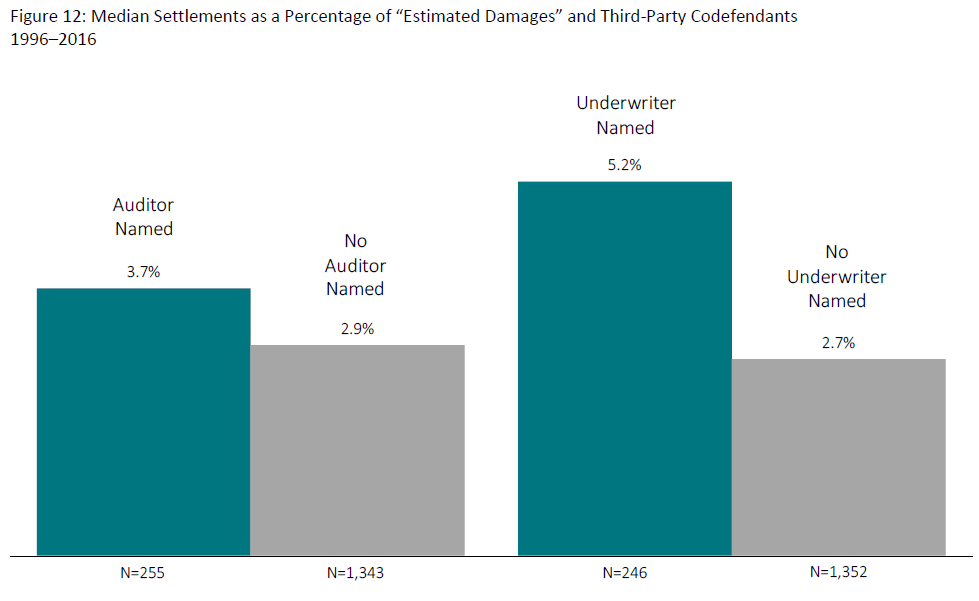
Third-Party Codefendants
- Third parties, such as an auditor or an underwriter, are often named as codefendants in larger, more complex cases.
- In 2016, however, the median settlement for cases with a third-party named defendant was 26 percent lower than for cases without a third-party named defendant.
- Only 17 percent of accounting-related case settlements in 2016 had a named auditor defendant.
- Underwriter defendants were named in 79 percent of cases with Section 11 claims in 2016.
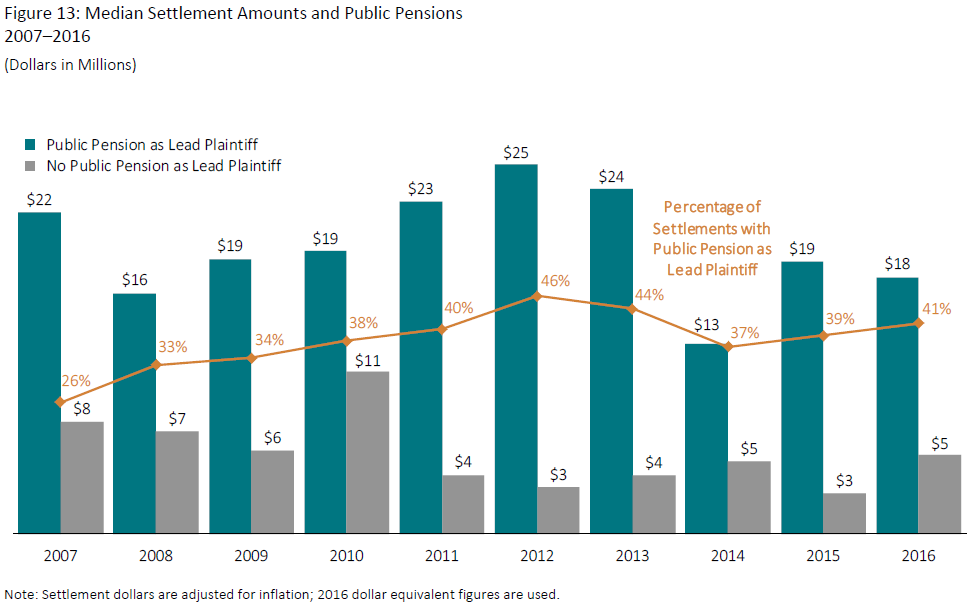
Institutional Investors
- In 2016, the median settlement amount for cases with institutional investor lead plaintiffs was more than two-and-a-half times that of cases with no institutional investor as a lead plaintiff, but settlements as a percentage of “estimated damages” were only slightly higher.
- Institutions, including public pension plans—a subset of institutional investors—tend to be involved as plaintiffs in larger cases (i.e., cases with higher “estimated damages”).
- In 2016, 55 percent of settlements with “estimated damages” greater than $500 million involved a public pension plan as lead plaintiff, compared to 30 percent for cases with “estimated damages” of $500 million or less.
- Cases in which public pension plans serve as lead or co-lead plaintiff also tend to involve larger issuer defendants, longer class periods, securities in addition to common stock, accounting allegations, and other indicators of more serious cases such as criminal charges. These cases are also associated with longer periods to reach settlement.
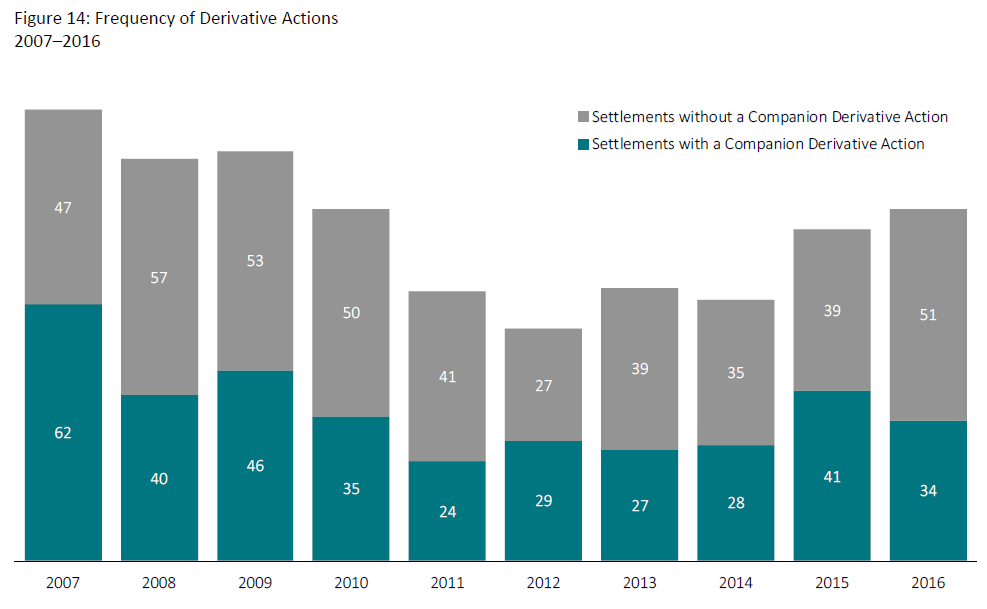
Derivative Actions
- In 2016, 40 percent of settled cases were accompanied by derivative actions, compared to 34 percent for all prior post-Reform Act years.
- Historically, accompanying derivative actions have been associated with relatively large securities class actions. In 2016, however, 38 percent of cases with “estimated damages” of $500 million or less involved a companion derivative action—just below the 42 percent of cases with “estimated damages” of more than $500 million.
- As a percentage of all derivative actions, the prevalence of companion derivative actions filed in California has increased annually from 14 percent in 2012 to 35 percent in 2016.
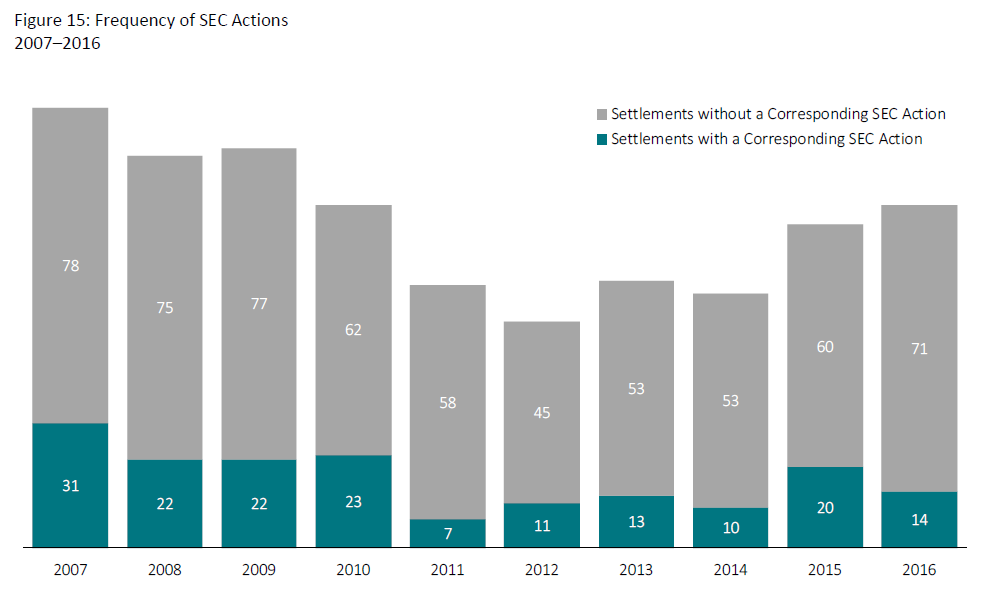
Corresponding SEC Actions
Cases with a corresponding SEC action related to the allegations (evidenced by the filing of a litigation release or administrative proceeding prior to settlement) are typically associated with significantly higher settlement amounts and have higher settlements as a percentage of “estimated damages.”
For related research on SEC enforcement activity, see the Securities Enforcement Empirical Database (SEED).
- In 2016, however, the median settlement for cases with an SEC action ($8.4 million) differed only slightly from the median settlement for cases without a corresponding SEC action ($8.6 million).
- Across all post-Reform Act cases, for settlements of cases involving accompanying SEC actions, the issuer defendant’s assets have averaged $65 billion, as compared to only $18 billion for settlements without accompanying SEC actions.
- While cases with accompanying SEC actions tend to involve larger issuer defendants, they are also more frequently associated with delisted firms. In addition, these cases often involve settlements prior to the first ruling on a motion to dismiss.
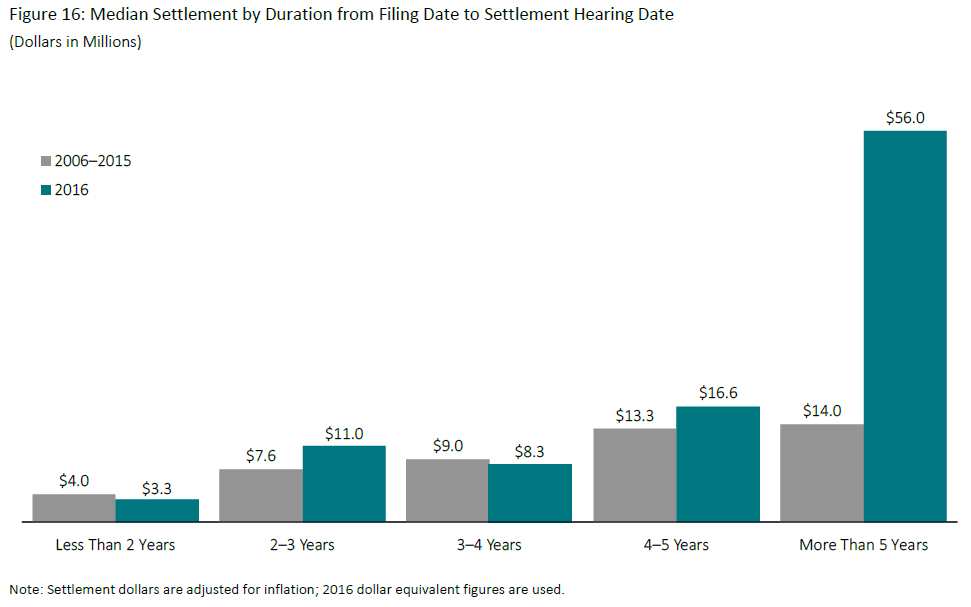
Time to Settlement and Case Complexity
- The percentage of settlements in 2016 occurring within two years after the filing date was at its highest level in the last 10 years.
- The median number of docket entries for cases settling within two years in 2016 was 19 percent higher than the median for the prior 10 years, indicating a relatively high level of activity during the tenure of these cases.
- In 2016, the median settlement for cases settling within two years was 70 percent lower than for cases taking longer to settle.
- The spike in the median settlement for 2016 cases settling after five years from filing is driven, in large part, by five mega settlements out of the 14 settlements in this category.
- Overall, the time to settlement tends to be longer for larger cases (as measured by issuer defendant size and “estimated damages”), cases involving third-party defendants, and cases with distressed issuer firms.
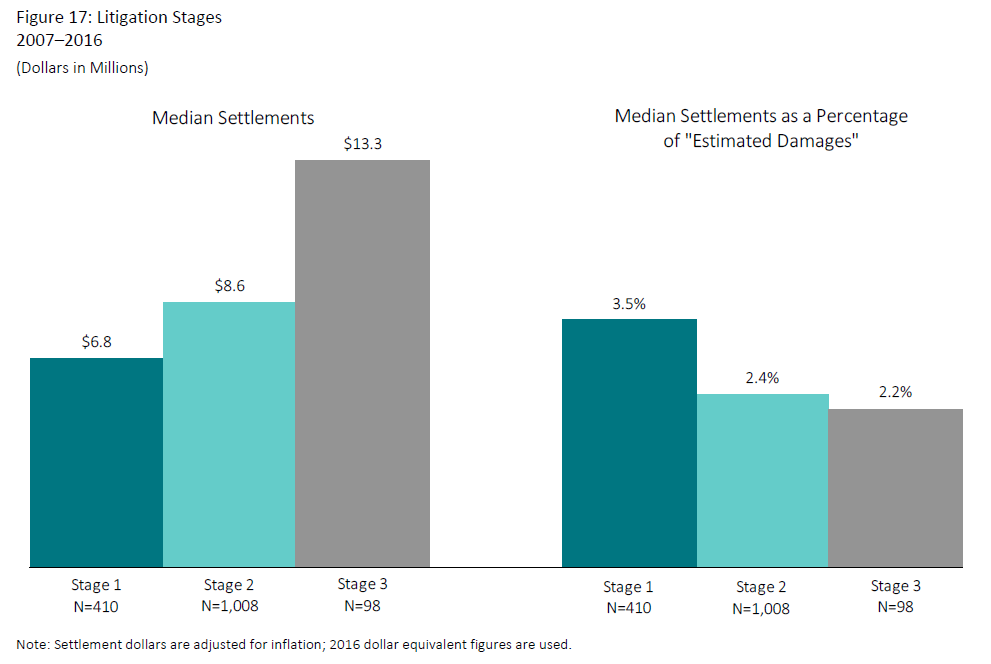
Litigation Stages
This post studies three stages in the litigation process that may be considered an indication of the strength of the merits of a case (e.g., surviving a motion to dismiss) and/or the time and effort invested by the lead plaintiff counsel:
Stage 1: Settlement before the first ruling on a motion to dismiss
Stage 2: Settlement after a ruling on motion to dismiss, but before a ruling on motion for summary judgment
Stage 3: Settlement after a ruling on motion for summary judgment
- In 2016, 25 percent of settlements occurred in Stage 1, an increase from 18 percent for cases settled in 2015.
- Among all post-Reform Act settlements, cases settling in Stage 1 have the smallest median “estimated damages” and the smallest median assets whereas Stage 3 settlements have the highest medians.
- Public pensions are involved as lead plaintiffs in 17 percent of cases that settle in Stage 1 and in 30 percent of cases that settle in Stage 3.
Cornerstone Research’s Settlement Prediction Analysis
This research applies regression analysis to examine which characteristics of securities cases were associated with settlement outcomes. The regression analysis is designed to better understand and predict the total settlement amount, given the characteristics of a particular securities case. This analysis can also be applied to estimate the probabilities associated with reaching alternative settlement levels as well as to explore hypothetical scenarios, including, but not limited to, the effects on settlement amounts given the presence or absence of particular factors found to significantly affect settlement outcomes.
- Settlements were higher when “estimated damages,” DDL, defendant asset size, or the number of docket entries were larger.
- Settlements were also higher in cases involving intentional misstatements or omissions in the issuer’s financial statements, financial restatements, a corresponding SEC action, a codefendant underwriter and/or auditor, an accompanying derivative action, a public pension involved as lead plaintiff, a noncash component to the settlement, filed criminal charges, or securities other than common stock alleged to be damaged.
- Settlements were lower if the settlement occurred in 2009 or later, if the issuer was distressed, or if the issuer traded on a non-major exchange.
Determinants of Settlement Outcomes
Based on the research sample of post-Reform Act cases that settled through December 2016, the factors that were important determinants of settlement amounts included the following:
- “Estimated damages”
- Disclosure Dollar Loss (DDL)
- Most recently reported total assets of the defendant firm
- Number of entries on the lead case docket
- The year in which the settlement occurred
- Whether the issuer reported intentional misstatements or omissions in financial statements
- Whether a restatement of financials related to the alleged class period was announced
- Whether there was a corresponding SEC action against the issuer, other defendants, or related parties
- Whether the plaintiffs named an auditor and/or underwriter as a codefendant
- Whether the issuer defendant was distressed
- Whether a companion derivative action was filed
- Whether a public pension was a lead plaintiff
- Whether noncash components, such as common stock or warrants, made up a portion of the settlement fund
- Whether the plaintiffs alleged that securities other than common stock were damaged
- Whether criminal charges/indictments were brought with similar allegations to the underlying class action
- Whether the issuer traded on a non-major exchange
Research Sample
- The database used in this post focuses on cases alleging fraudulent inflation in the price of a corporation’s common stock (i.e., excluding cases with alleged classes of only bondholders, preferred stockholders, etc., and excluding cases alleging fraudulent depression in price and M&A cases).
- The sample is limited to cases alleging Rule 10b-5, Section 11, and/or Section 12(a)(2) claims brought by purchasers of a corporation’s common stock. These criteria are imposed to ensure data availability and to provide a relatively homogeneous set of cases in terms of the nature of the allegations.
- The current sample includes 1,621 securities class actions filed after passage of the Reform Act (1995) and settled from 1996 through 2016. These settlements are identified based on a review of case activity collected by Securities Class Action Services LLC (SCAS).
- The designated settlement year, for purposes of this report, corresponds to the year in which the hearing to approve the settlement was held. Cases involving multiple settlements are reflected in the year of the most recent partial settlement, provided certain conditions are met.
Data Sources
In addition to SCAS, data sources include Dow Jones Factiva, Bloomberg, the Center for Research in Security Prices (CRSP) at University of Chicago Booth School of Business, Standard & Poor’s Compustat, court filings and dockets, SEC registrant filings, SEC litigation releases and administrative proceedings, LexisNexis, and public press.
The complete publication, including footnotes and Appendix, is available here.
