 Print
PrintDavid Larcker is James Irvin Miller Professor of Accounting at Stanford Graduate School of Business; Brian Tayan is a Researcher with the Corporate Governance Research Initiative at Stanford Graduate School of Business. This post is based on a paper authored by Professor Larcker; Mr. Tayan; G. Mason Morfit, Partner and President of ValueAct Capital; D. Robert Hale, Partner at ValueAct Capital; and Alex Baum, Vice President at ValueAct Capital. Related research from the Program on Corporate Governance includes: Paying for Long-Term Performance by Lucian Bebchuk and Jesse Fried (discussed on the Forum here).
We recently published a paper on SSRN, An Activist View of CEO Compensation, that explains a framework developed by activist fund ValueAct Capital for evaluating executive compensation plans.
Understanding CEO compensation plans is a continuing challenge for boards of directors and investors. Disclosure rules and general industry practices rely heavily on calculating the “fair value” of compensation awards as of the grant date. The problem with this approach is that the fair value of awards is a static (expected) number that does not reflect how a plan scales to performance. The relation between pay and performance can sometimes be discerned from the details of SEC filings but they are not made explicit and often do not make it into the analyses upon which boards of directors make compensation decisions.
To this end, activist fund ValueAct Capital developed a framework that strips down and systematically reconstructs the compensation figures in the annual proxy. Their approach allows for a step-by-step evaluation of the conditions under which variable compensation is paid to the CEO and the relation of this pay to operating and stock price performance. This framework can also be employed to compare CEO pay packages across companies within an industry.
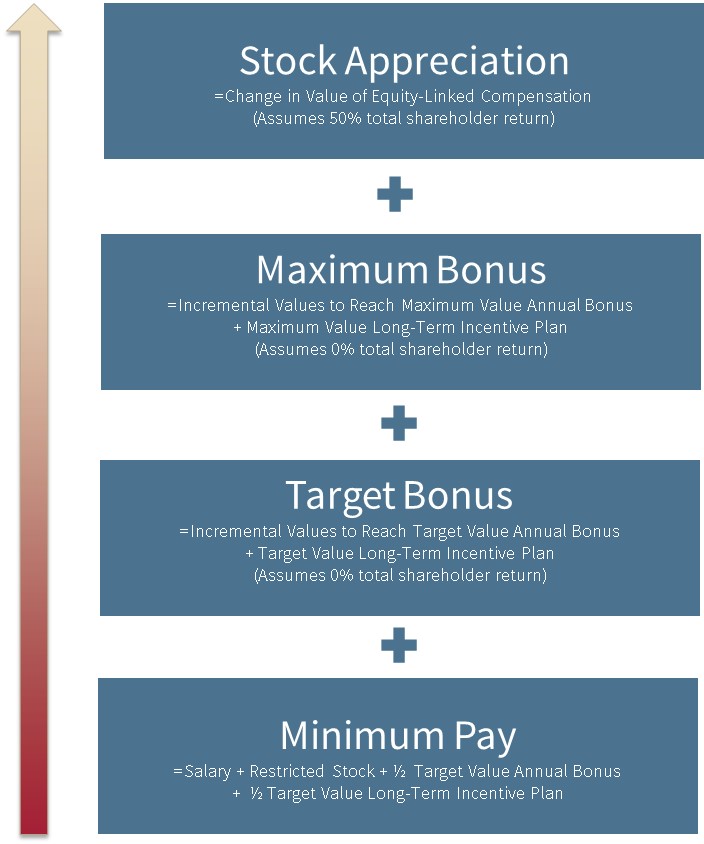
The four steps of the framework are as follows:
1. Calculate the “minimum” payout that a CEO is expected to receive in a given year. One might expect that the minimum payment a CEO receives is equal to his or her salary. Typically, however, this is not the case. A CEO will retain time-vested restricted stock without regard to performance. Furthermore, CEOs almost always receive some portion of their annual bonus. Targets are set low enough to be achievable, and a zero payout almost never occurs in practice. Most plans set a lower threshold (hurdle amount) equal to 50% of the target, and we include this figure in the minimum payout. Taking this all together, we assume the “minimum” payout to a CEO as equal to the CEO’s salary, plus restricted stock, plus 50% of the target value of the annual bonus.
2. Calculate how much incremental pay the CEO will receive if he or she achieves target-level performance. This amount equals the incremental compensation assuming the annual bonus and long-term incentive plans are paid out at the target level. (We assume no change in stock price, so that all of this incremental compensation comes from additional payments and not change in value of equity awards due to stock price change).
3. Calculate incremental pay if maximum bonuses are paid. This amount equals the incremental compensation for achieving the high end of the annual bonus and the high end of the long-term incentive plan. (Again, we assume no change in stock price).
Steps 2 and 3 highlight how much upside potential is available to the CEO for achieving performance milestones, even if shareholders see no appreciable return. They also illustrate the potential disconnect that can occur between the financial outcomes of shareholders and the CEO.
4. Add the incremental compensation the CEO will receive assuming some reasonable stock-price appreciation. We assume a 50 percent increase, although higher or lower return scenarios are equally valid. This calculation adds the incremental payout from stock options and the appreciation of restricted stock and performance shares. Treating stock-price appreciation as an independent analytical variable allows us to see how equity awards add leverage to the pay package and the degree to which CEO pay outcomes and shareholder interests are aligned.
Taken together, this framework provides a foundation for analyzing the scale and structure of CEO pay. It provides a rigorous and systematic method for evaluating critical issues, such as:
- The degree to which pay is “guaranteed” or “at-risk”;
- The degree to which payouts are driven by operating versus stock-price performance;
- The sensitivity of CEO compensation to stock-price returns;
- The importance and rigor of performance metrics;
- The potential risk embedded in the CEO pay package.
Large incremental payouts can be indicative of strong “pay for performance” depending on how aggressively targets are set. However, very high levels of contingent pay might also encourage the CEO to take risks that are not consistent with increasing shareholder value. The compensation committee will need to determine whether these risks are appropriate given the constraints of the firm’s risk tolerance. This will lead to second-order considerations, such as the degree to which performance measures are verifiable and subject to possible manipulation. The board might be willing to accept a risky compensation scheme, but it might want to increase monitoring to assure that performance outcomes are appropriately achieved without subjecting the organization to excessive risk.
By contrast, compensation plans with a large minimum component might be indicative of a disconnect between pay and performance. This can lead to questions about governance quality and whether a CEO is given sufficient motivation to perform.
This framework also easily lends itself to comparison across companies within an industry. Pay presented according to the framework above allows the reader to quickly understand the degree to which pay is fixed and variable, how pay scales with the achievement of operating and share-price results, and how these compare across competitors. It also allows the investor or director to assess the degree to which compensation is aligned with the interest of shareholders.
The complete paper is available for download here.
Exhibit 1
Source: The authors.
Exhibit 2

* Assumes 0% stock appreciation and multipliers pay out at 50% of target
** Assumes 0% stock price appreciation and multipliers pay out at 100% of target
*** Assumes 0% stock price appreciation and all multipliers pay out at max (including relative TSR)
**** Assumes 50% stock price appreciation and multipliers pay out at max
Source: Forms DEF 14A filed with the Securities and Exchange Commission (most recent as of August 1, 2016). Research by the authors.
