 Print
PrintStefan Boettrich and Svetlana Starykh are Senior Consultants at NERA Economic Consulting. This post is based on a NERA publication by Mr. Boettrich, Ms. Starykh, and Dr. David Tabak.
The pace of securities class action filings [in 2016] was the highest since the aftermath of the 2000 dot-com crash. Growth in filings was dominated by federal merger objections, which reached a record high, and followed various state court decisions restricting “disclosure-only” settlements, the most prominent being the 2016 Trulia decision in the Delaware Court of Chancery. Filings alleging violations of Rule 10b-5, Section 11, or Section 12 grew for a record fourth straight year and reached levels not seen since 2008.
NERA-defined Investor Losses, a proxy for filed case size, reached a record $468 billion in 2016, 44% of which arose from securities cases claiming damages due to regulatory violations. Of those, several large securities cases stemmed from a US Department of Justice (DOJ) probe into alleged price collusion in generic pharmaceuticals. Those cases contributed to a high concentration of filings in the Health Technology and Services sector.
In 2016, a total of 262 securities class actions were resolved, but for the first time since passage of the Private Securities Litigation Reform Act (PSLRA), more cases were dismissed than settled. This is due to a record number of dismissals, at an especially fast pace post-filing, coupled with a settlement rate that remains close to an all-time low. The average settlement amount grew 36% in 2016, marking the second consecutive year of strong growth, partially driven by settlements in two longstanding large cases: Household International and Merck.
Trends in Filings
Number of Cases Filed
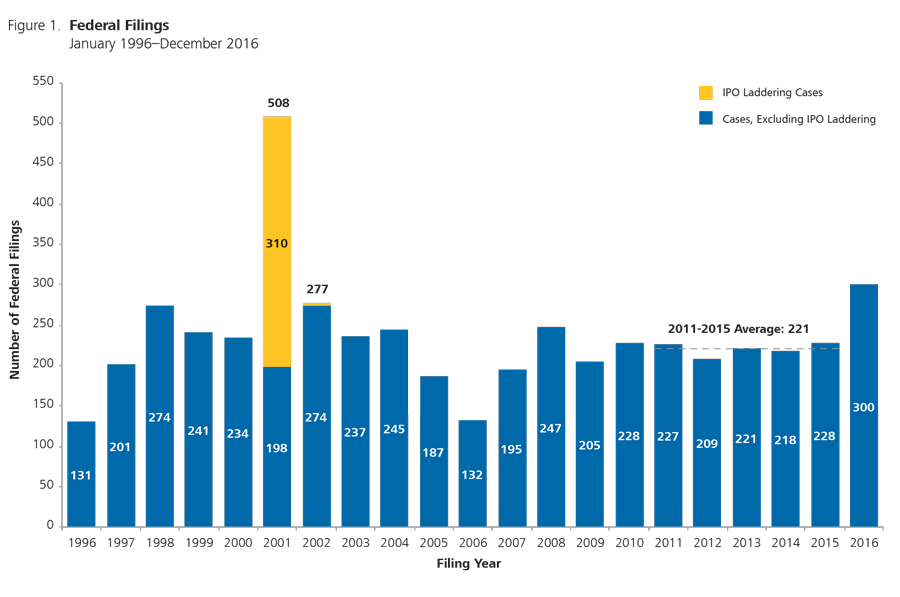
In 2016, 300 securities class actions were filed in federal courts, the highest of any year since the aftermath of the 2000 dot-com crash (see Figure 1). The number of filings in 2016 was 32% higher than in 2015 and 36% higher than the average rate over the prior five years, marking a departure from the remarkably stable rate of filings from 2010 to 2015, following the financial crisis. The level of 2016 filings was also well above the post-PSLRA average of approximately 217 cases per year, excluding IPO laddering cases.
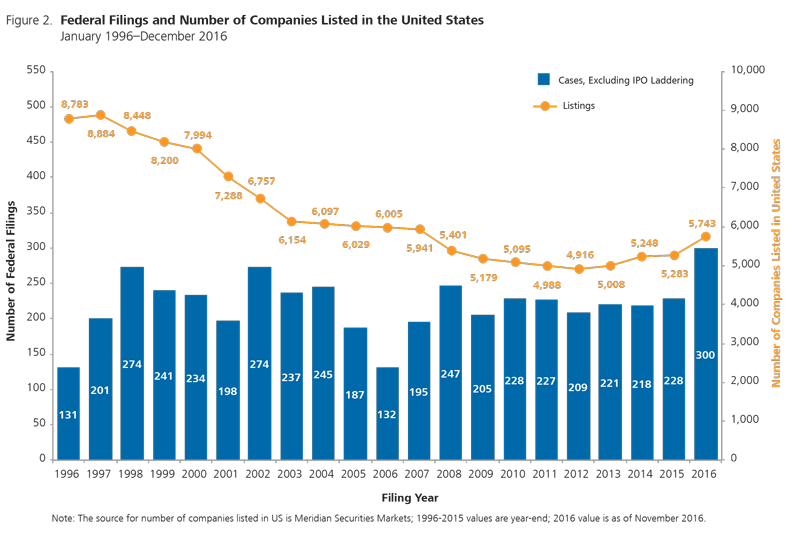
As of November 2016, 5,743 companies were listed on the major US securities exchanges, including the NYSE and Nasdaq (see Figure 2). The 300 federal securities class action suits filed in 2016 involved approximately 5.2% of publicly traded companies.
While the number and composition of securities class actions have fluctuated historically, the number of listed companies at risk of such actions has dropped considerably. Over the past 20 years, the number of publicly listed companies in the US has steadily declined by more than a third, or by about 3,000 listings. Recent research attributed this decline to fewer new listings and an increase in delistings, mostly through mergers and acquisitions, while ruling out the regulatory reforms of the early 2000s as the explanation.
Despite the large drop in the number of listed companies, the average number of filings of securities class actions over the preceding five years, about 221 per year, is higher than the average number of filings over the first five years after the PSLRA went into effect, about 216 per year.
The long-term trend in the number of listed companies coupled with the number of class actions filed imply that the average probability of being sued has increased from 3.2% for the 2000-2002 period to 5.2% in 2016.
The average probability of a firm being targeted by what is often regarded as a “standard” securities class action—one that alleges violations of Rule 10b-5, Section 11, and/or Section 12— was only 3.4% in 2016 and only slightly higher than the average probability of 3.0% between 2000 and 2002.
Filings by Type
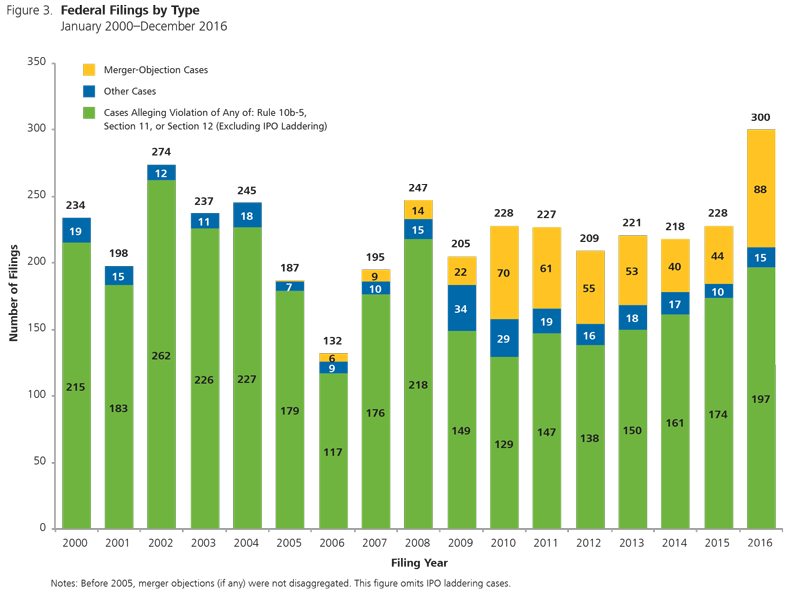
Overall, the considerable growth in filings in 2016 was driven by dramatic growth in federal merger-objection cases, which typically allege a breach of fiduciary duty by directors and officers, and also driven by steady growth in standard securities class actions (see Figure 3). Despite fluctuating near record lows during the 2010-2012 period, the number of standard case filings has increased moderately in each of the previous four years, the longest expansion on record. In 2016, 197 standard cases were filed.
While standard filings still dominate federal dockets, the record number of filings this year was largely attributable to new merger-objection cases, which numbered 88. The jump likely stemmed from federal merger-objection suits that would have been filed in other jurisdictions but for various state-level decisions limiting “disclosure-only” settlements, with the most prominent being the 22 January 2016 Trulia decision in the Delaware Court of Chancery. Mergers and acquisitions (M&A) activity does not appear to be the primary driver of federal merger-objection case counts because the number of federal merger-objection filings generally fell between 2010 and 2015, despite increased M&A activity over this period. In 2016, notwithstanding a 13% year-over-year drop in M&A deals targeting US companies, merger-objection suits doubled from 2015 levels.
Rounding out the total counts of federal filings in 2016 were a variety of other cases alleging breach of fiduciary duty, management self-dealing, and violation of security-holder contractual rights, among other improper actions.
Merger-Objection Filings
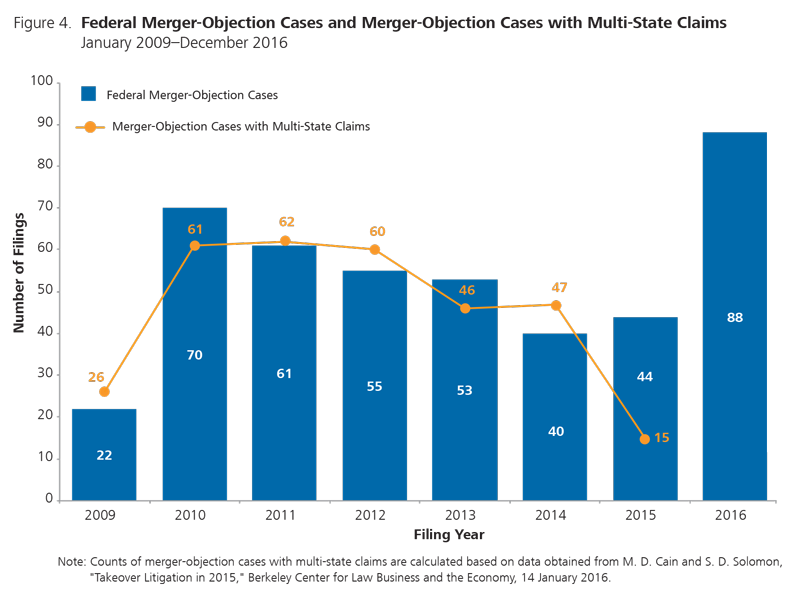
In 2016, federal merger-objection filings grew at the fastest rate since 2010, although recent growth was more likely due to court decisions than due to increased M&A activity (see Figure 4). The 2010 spike in federal merger-objection cases coincided with a doubling of M&A deals and growth in the rate of merger objections, contrasting with a 2016 slowdown in dealmaking.
Historically, state courts, rather than federal courts, have been the primary jurisdiction of merger-objection cases. Between 2010 and 2015, the slowdown in federal merger-objection filings largely mirrored the slowdown in multi-state merger-objection filings (those filed in multiple state courts), which researchers have indicated may be due to the increased use and effectiveness of forum selection corporate bylaws that limit the ability of plaintiffs to file claims outside of stipulated jurisdictions.
The increased adoption of forum selection bylaws coincided with various state court decisions in 2015 and 2016, particularly those against “disclosure-only” settlements, the most prominent being the 22 January 2016 Trulia decision in the Delaware Court of Chancery. Delaware attracted about half of eligible merger-objection cases prior to the Trulia decision, and researchers have suggested that, as a result of the decision, there may be a trend toward litigating merger objections in courts outside of Delaware. While the full extent of such a shift remains to be seen, early signs of a contemporaneous slowdown in merger-objection filings in Delaware and a spike in federal merger-objection filings support such a conjecture.
Whether any apparent shift in merger-objection suits out of Delaware continues will likely depend on the extent to which other jurisdictions adopt the Delaware Court of Chancery’s lead on disclosure-only settlement disapproval, as well as on the rate of corporate adoption of forum selection bylaws. In 2015, multiple opinions in New York Superior Court rejected disclosure-only settlements, and in 2016, the Seventh Circuit also ruled against a disclosure-only settlement in the case, In re: Walgreen Co. Stockholder Litigation.
Filings by Issuers’ Country of Domicile
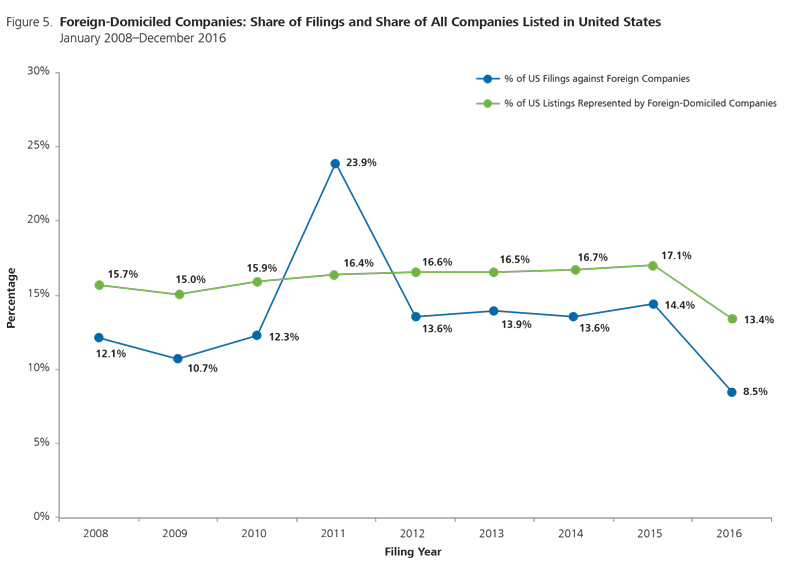
In 2011, mostly due to a surge in filings against companies domiciled (or with principal offices) in China, a record 23.9% of cases were filed against foreign issuers (see Figure 5). That year marked the only recent period in which foreign domiciled companies were disproportionally targeted by securities class actions; in other years, the proportion of class actions against foreign-domiciled companies was less than the proportion of foreign listings.
While the proportion of filings against foreign issuers remained above historic levels for a few years following the wave of Chinese cases, the foreign issuer filing rate in 2016 dropped well below levels seen since at least before 2008. This is partially explained by a decline in the percent of overall US listings represented by foreign-domiciled companies. The decline also coincides with a 50% increase in the proportion of filings involving merger-objection claims, which less frequently target non-US companies.
The drop in filings against Chinese-domiciled companies in 2016 was especially pronounced, with the fewest filings against such companies since 2009. This may be due to a record number of Chinese companies delisting in the United States and relisting their shares in Chinese markets, “hoping to benefit from higher valuations” there. In addition to reducing the overall count of listed Chinese companies in the United States, the relisting mechanism is more likely to be taken advantage of by firms with relatively weaker accounting or disclosure practices.
Section 11 Filings
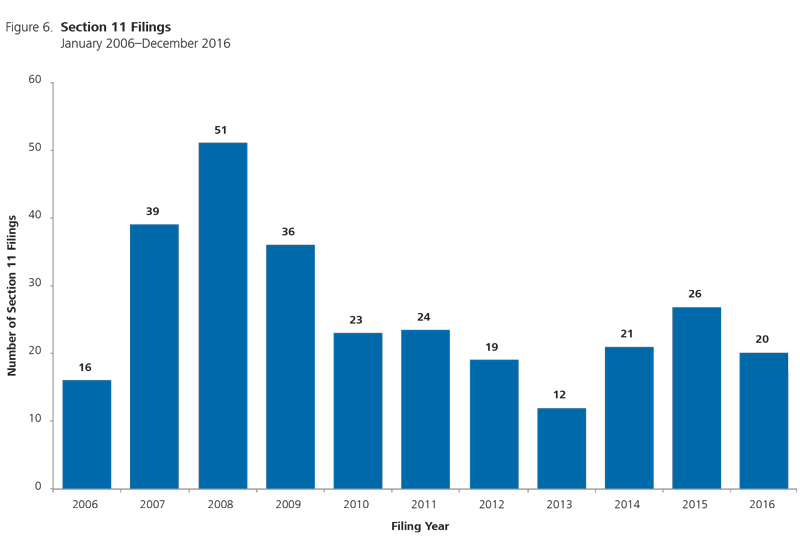
In 2016, there were 20 filings alleging violations of Section 11, which is approximately equal to the average rate since 2010 though 23% lower than the rate of such filings in 2015 (see Figure 6). Section 11 filings more than doubled between 2013 and 2015, largely mirroring growth in initial public offerings (IPOs) in prior years. Following what the Financial Times cited as a “bumper IPO year” in 2014, offerings slowed by almost 40% in 2015, which, in turn, was followed by a slowdown in Section 11 filings in 2016. Section 11 filings in 2016 spanned many economic sectors and were roughly equally split among the Second, Ninth, and all other Circuits.
Aggregate NERA-Defined Investor Losses
In addition to the number of cases filed, we also consider the total potential size of these cases using a metric we label “NERA-defined Investor Losses.”
We do not compute NERA-defined Investor Losses for all cases included in this publication. For instance, class actions in which only bonds and not common stock are alleged to have been damaged are not included. The largest excluded groups are IPO laddering cases and merger-objection cases. Some previous NERA reports on securities class actions did not include Investor Losses for cases with only Section 11 allegations, but such cases are included here.
For each year since 2005, we calculate NERA-defined Investor Losses at the time of filing for each case for which losses can be computed. Yearly Investor Losses are grouped by magnitude and aggregated, as shown in Figure 7.
In 2016, aggregate NERA-defined Investor Losses jumped to a record $468 billion, more than 2.75 times the 2015 rate and exceeded the level of losses in 2008, at the height on the financial crisis. While Investor Losses in each stratum increased from 2015, the 2016 level of losses was driven to a record due to a dramatic increase in (and record amount of) losses attributable to cases with very large Investor Losses (over $10 billion, shown in dark green in Figure 7). This year marked the first time since 2012 during which Investor Losses stemming from large cases made up most of the total loss for the year.
Claims related to regulatory violations (i.e., those alleging a failure to disclose a regulatory issue) made up a record 44% of NERA-defined Investor Losses in 2016, totaling about $220 billion. Much of this loss stemmed from price collusion cases spanning the pharmaceutical and poultry industries. Several pharmaceutical companies were caught up in a long-running DOJ probe into alleged generic drug price collusion. In September 2016, a leading poultry distributor sued several poultry producers, alleging price fixing of broiler chickens. Our data includes nine securities class actions related to such investigations in the pharmaceutical industry and four securities class actions related to such investigations in the poultry industry. These account for more than $173 billion in Investor Losses, or about 57% of the growth from 2015 levels. Securities class actions stemming from these investigations also make up more than a third of 2016 aggregate Investor Losses and 60% of losses in the high Investor Losses category.
Even excluding cases stemming from the described allegations of price collusion, 2016 NERA-defined Investor Losses jumped substantially to more than $295 billion. More than $109 billion of those losses may be traced to six cases with very large Investor Losses, half of which are in the Health Technology and Services sector. The largest of the six, representing about 8.8% of aggregate Investor Losses, was brought against Wells Fargo, in the Finance sector.

Filings by Circuit
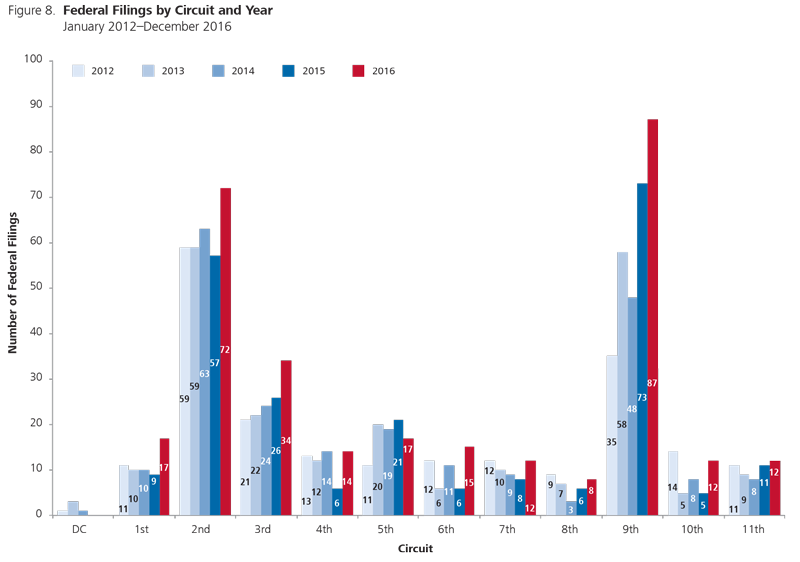
Filings continued to be concentrated in the Second and Ninth Circuits, where more cases were filed than in all other circuits combined (see Figure 8).
In the Ninth Circuit, the number of filings grew nearly 20%, to 87. Filings of merger-objection cases were a major growth factor, tripling to 27. Filings alleging violations of Rule 10b-5, Section 11, and/or Section 12, fell 11% to 55. Of these, seven cases alleged violations of Section 11, down marginally from 2015 but remaining near a five-year high and constituting about a third of all Section 11 cases.
Filings in the Second Circuit have grown over the past five years and reached an all-time high of 72 in 2016. As in 2015, the Second Circuit accepted disproportionately fewer merger-objection cases in 2016—while about a quarter of all securities class actions were filed in that Circuit, only about nine percent of merger-objection cases were filed there. Merger-objection suits may be less common in the Second Circuit, as multiple 2015 opinions in New York Superior Court rejected disclosure-only settlements either as “relatively worthless settlements” or discounted them as “merger tax suits.”
Filings of “standard” securities class actions in the Second Circuit made up the difference; despite lagging behind the overall filing load of Ninth Circuit, six more standard cases were filed in the Second Circuit than in the Ninth Circuit.
Recent steady growth in filings in the Third Circuit, which includes Delaware, continued in 2016. Third Circuit filings reached 34, up from 21 in 2012. As in the Ninth Circuit, growth of merger-objection cases was a factor. The number of such cases increased by nearly 43% in 2016, representing a bit less than a third of all filings in the Circuit. In the Fifth Circuit, 17 securities class actions were filed, the fewest in four years, and standard cases outnumbered merger objections by two-thirds.
Filings by Sector
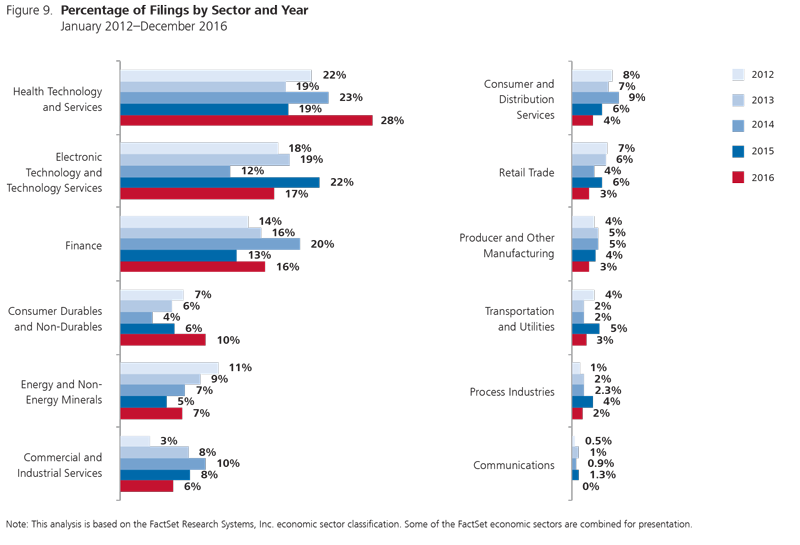
In 2016, 28% percent of securities class action cases were brought against firms in the Health Technology and Services sector (see Figure 9). Other than Finance sector filings between 2007 and 2009, filings have not been so concentrated in a single sector since at least 2005. There were 85 filings in the Health Technology and Services sector, almost doubling from 2015 levels. While the nine securities class actions stemming from DOJ probes into generic pharmaceutical price collusion contributed to the growth of cases in the sector, most cases in the sector were driven by claims related to financial performance or other regulatory actions.
The rate of filings against firms in the Electronic Technology and Technology Services sector was approximately equal to the five-year average rate and was a reversion from a large upward movement observed last year. Filings against firms in this sector would have fallen even more but for a jump in merger-objection cases, which made up nearly 45% of filings and possibly resulted from the technology sector’s lead over other industries in 2016 M&A activity.
Finance sector filings made up 16% of total filings, reverting to approximately the five-year average rate after a large downward movement last year.
Defendants in the Finance Sector
In addition to being targeted as primary defendants, companies in the Finance sector are often named as co-defendants, potentially as underwriters of the securities at issue.
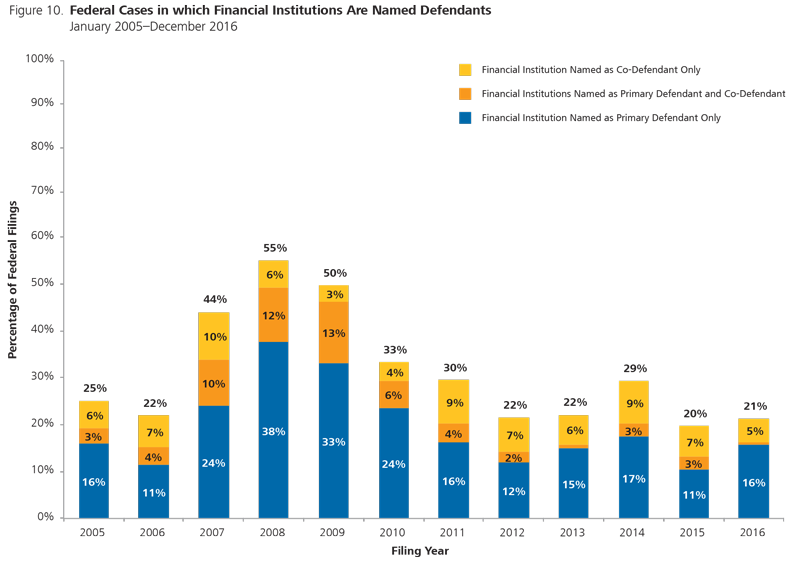
In 2016, 21% of securities class actions filed had a defendant in the Finance sector (whether a primary defendant or co-defendant) (see Figure 10). The concentration of filings in the sector peaked to more than 50% of all filings during the financial crisis and has tailed off since then. Although filings listing Finance sector firms as the primary defendant ticked up last year, the rate of filings in the sector is roughly equal to that in the 2005 and 2006 pre-crisis period.
Thirteen of the 15 cases filed in 2016 with financial institution co-defendants were Section 11 cases with an underwriter co-defendant, a rate consistent with previous years.
Accounting Co-Defendants
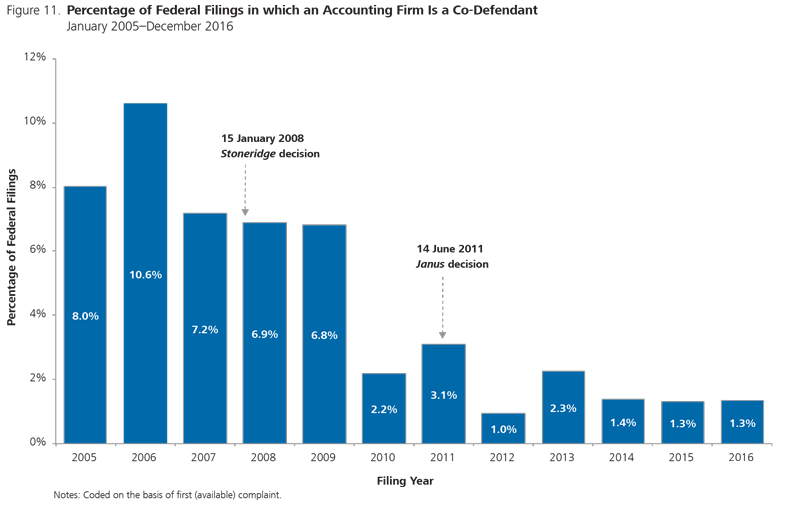
Accounting firms were co-defendants in only four securities class actions in 2016, three of which included allegations against a Big Four accounting firm.
Despite a marginal increase in the number of federal filings with an accounting firm co-defendant in 2016, such filings are still much rarer than in the years prior to the financial crisis. This trend is likely the result of two factors: (1) fewer cases that include accounting allegations being filed and (2) changes in the legal environment related to accounting co-defendants.
First, since 2005, the percent of filings with accounting claims dropped from about 56% to about 20% in 2016, while the percent of cases with an accounting co-defendant dropped from 8% to less than a fifth of that (see Figure 11).
Second, the drop in the relative percent of filings with an accounting co-defendant, however, exceeded the decline of filings with accounting allegations, potentially due to changes in the legal environment, which was affected by two US Supreme Court rulings over the period. The Supreme Court’s Janus decision in 2011 restricted the ability of plaintiffs to sue parties not directly responsible for misstatements. Along with the High Court’s Stoneridge decision in 2008, which limited scheme liability, the Janus decision may have made accounting firms less appealing targets for securities class action litigation.
Allegations
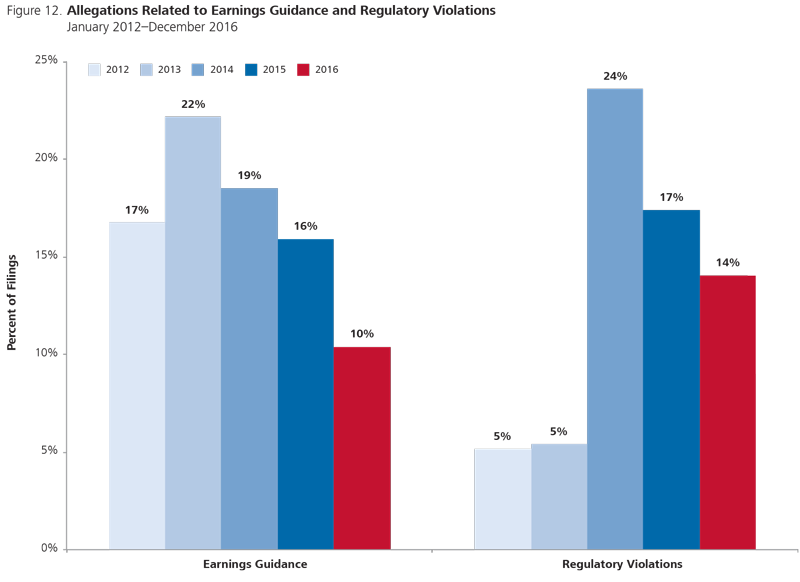
In 2016, only about one in 10 filings contained allegations related to misleading earnings guidance, a continuation of the precipitous fall in such allegations in recent years (see Figure 12). The decline is partially explained by an increase in merger-objection cases, which don’t generally include claims of misleading guidance. The decline also correlates with a decline in technology sector 10b-5s, which historically constituted about a third of all earnings guidance cases. In 2016, the number of cases in the technology sector claiming misleading earnings guidance fell by more than 60% and constituted only about 16% of all earnings guidance cases. Nearly 60% of 10b-5 filings in the technology sector alleged accounting or regulatory violations.
In 2014, there was a dramatic increase in the number of securities class actions related to regulatory violations. Since then, most securities cases with regulatory violations have been concentrated in the Finance sector and the Health Technology and Services sector, with the latter driving filings in 2016; at least partially due to generic drug price collusion cases. In 2016, securities cases stemming from price collusion allegations in the market for broiler chickens resulted in filings against Tyson Foods, Pilgrim’s Pride Corporation, and Sanderson Farms.
Most complaints include a wide variety of allegations, not all of which are depicted here. Due to multiple types of allegations in complaints, the same case may be included in both the earnings guidance and regulatory violations categories.
Alleged Insider Sales
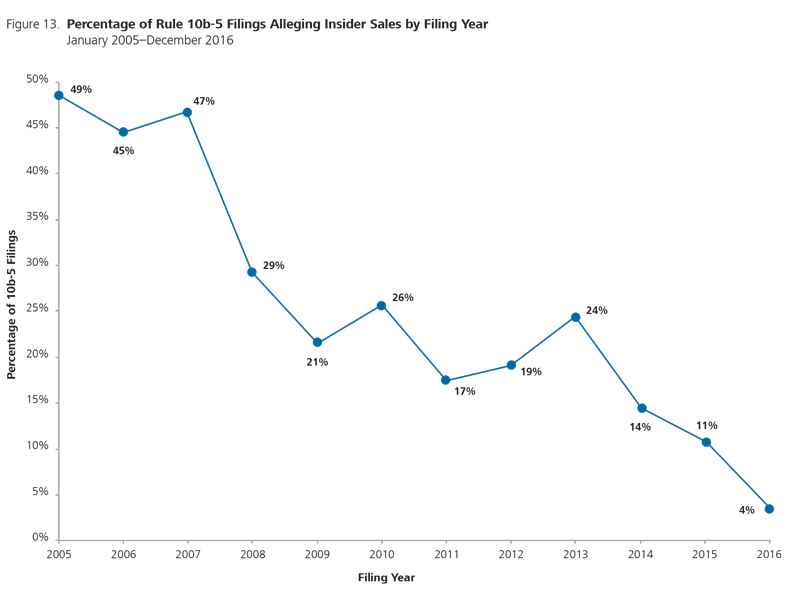
The percentage of 10b-5 class actions that also alleged insider sales decreased in 2016, dropping to 4% and marking a second consecutive record low. Cases alleging insider sales were much more common prior to the financial crisis, having peaked at 49% in 2005 (see Figure 13).
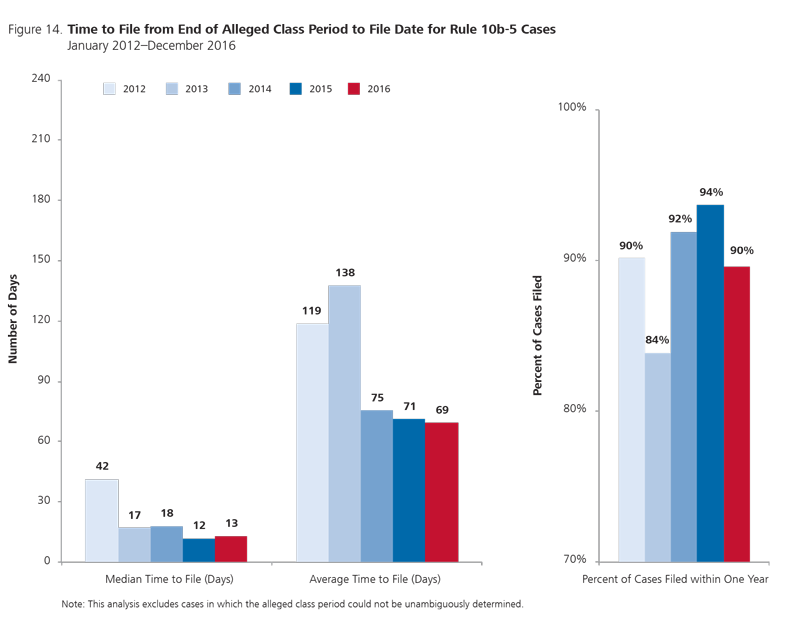
Time to File
The term “time to file” denotes the time that has elapsed between the end of the alleged class period and the filing date of the first complaint. Figure 14 illustrates how the median time and average time to file (in days) have changed over the past five years.
The time to file in securities cases remained near record-low levels for a second consecutive year in 2016. The average time to file was 69 days, while half of all cases were filed within 13 days or less. We also observe that the percent of complaints filed within one year of the end of the class period remained at approximately 90% in 2016. These metrics indicate a trend toward a lower frequency of cases with long periods between the date when an alleged fraud was revealed and the date a related claim is filed.
Mid-2017 Flash Update
[In the first portion of this post,] we noted that the “pace of securities class action filings was the highest since the aftermath of the 2000 dot-com crash” and that the growth “in filings was dominated by federal merger objections.”
We can now report that the surge in securities class-action filings has continued in the first half of 2017. Total securities class-action filings rose from 140 in the first half of 2016 to 160 in the second half of the year. That number has increased to 246 in the first half of 2017. This represents a 76% increase over the same period last year and a 54% increase over the second half of 2016.
Filings of each of the two major categories of securities class actions have also risen. The number of “standard” cases alleging violations of SEC Rule 10b-5 or of Section 11 or 12 of the 1933 Securities Act fell from 102 in the first half of 2016 to 95 in the second half of 2016, but the number of filings of such cases has risen to 135 in the first half of 2017.
The number of merger-objection cases filed rose from 30 in the first half of 2016 to 58 in the second half of the year. The number of such filings has now increased to 100 in the first half of 2017. Compared to standard cases, the number of merger-objection cases has grown more quickly in the first half of 2017 versus the first half of 2016 (233% growth for merger-objection cases versus 32% growth for standard cases), and in the first half of 2017 versus the second half of 2016 (72% growth for merger-objection cases versus 42% growth for standard cases). Still, however one looks at it, the greater number of filings in both categories of cases that were seen in 2016 has not just been maintained, but increased substantially in the first half of 2017.
The complete publication, which was recently cited by the US Supreme Court (California Public Employees’ Retirement System v. ANZ Securities, Inc., 582 U.S. ___ (2017)), provides more details on filings and settlements in 2016, and we will provide similar analyses for 2017 early next year.
* * *
The complete publication, including footnotes, is available here.
