Print
PrintMatthew Goforth is Senior Governance Advisor at Equilar, Inc. This post is based on an Equilar publication by Mr. Goforth. The full report, with commentary from BarkerGilmore, can be downloaded at Equilar’s website.
General Counsel Pay Trends, an Equilar publication, examines the compensation of General Counsel (GC) disclosed in SEC filings by public companies for the fiscal years 2016 and 2015. Companies that filed a proxy statement (DEF 14A) or disclosed compensation information in an amended 10-K filing (10-K/A) by May 1, 2017 were included in the fiscal 2016 year—2015 was defined similarly. Analysis of GC compensation is divided by company revenue ranges for the larger sample of all public companies in the Equilar database.
In addition, industry sector breakdowns are included for the Equilar 500, an index which tracks the 500 largest, by reported revenue, U.S.-headquartered companies trading on one of the major U.S. stock exchanges (NYSE, Nasdaq or NYSE MKT (formerly AMEX)), adjusted to approximate the industry sector mix of similar large-cap indices. The Equilar 500 was chosen for this analysis to normalize by company size and type. Industry sectors are based on Yahoo! Finance classifications, and conglomerates were excluded from charts throughout the report due to small sample size, but these companies are included in the overall figures. The sample sizes are detailed in the tables below.
| Less than $1B | Between $1B and $5B | Between $5B and $15B | Over $15B | |
|---|---|---|---|---|
| FY 2015 | 552 | 386 | 138 | 58 |
| FY 2016 | 539 | 385 | 144 | 55 |
| Equilar 500 | |
|---|---|
| FY 2015 | 176 |
| FY 2016 | 180 |
Total compensation is defined as the sum of summary compensation table (SCT) reported salary, bonus, non-equity incentive plan compensation, stock awards, option awards and all other compensation—change in pension value and non-qualified deferred compensation was excluded to omit changes in actuarial value. The term “stock” used throughout the report comprises al full-value shares, including restricted stock awards and restricted stock units. Similarly, stock options and stock-appreciation rights (SARs) are combined under “options.”
The narrative portion of this post identifies compensation trends for general counsel. BarkerGilmore has offered independent commentary in the complete publication (available at http://www.equilar.com/) to provide color and context to how companies recruit and compensate their GCs.
- Median total direct compensation (TDC) for GCs increased moderately from 2015 to 2016, except at companies above $15 billion in revenue, which fell slightly.
- The median ratio of CEO-to-GC compensation was greatest at companies with revenues between $1 billion and $15 billion, at about 3.7-to-1, and smallest for companies under $1 billion in revenue where the median ratio was less than 3-to-1.
- Median GC base salary ranged from about $325,000 among the smallest companies to $650,000 at the largest—meanwhile, median stock grants at the largest companies were more than seven times those awarded at the smallest.
- Stock grants represented the largest pay component at the median for GCs across all Equilar 500 sectors—basic materials companies granted the highest median value of compensation in stock, at about $1.2 million, almost twice the value of stock granted within the industrial goods sector, which offered the least amount.
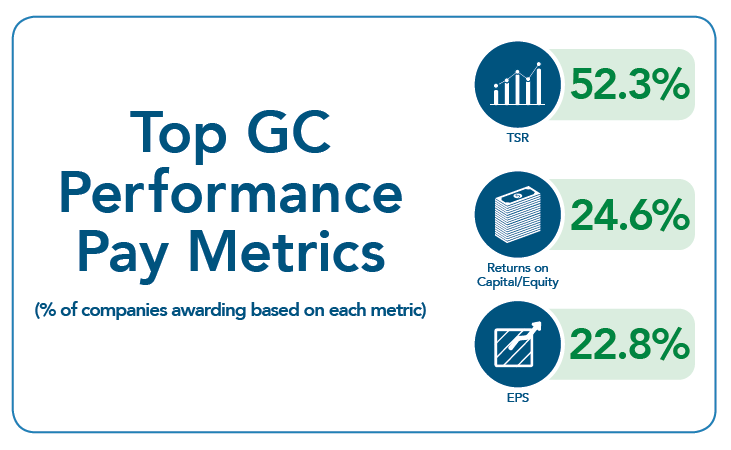
- At least 60% of all companies above $1 billion in revenue granted performance-based stock awards, and awards were most commonly linked to relative TSR performance.
- Performance bonuses for more than 30% of GCs in 2016 were measured by revenue, non-financial and EBITDA metrics.
Executive Summary
The General Counsel acts as a company’s top legal officer, but this role is also expanding into corporate strategy and risk management and response. Alongside an expanded senior management role, GC pay packages are exposed to similar influences affecting compensation for C-suite executives and are evolving similarly.
Since shareholders gained the ability to approve executive pay packages through Say on Pay votes in 2011, compensation of the C-suite has continued to grow on an absolute basis. For example, median pay for CEOs at the 500 largest U.S. companies by revenue (Equilar 500) grew more than 6% between fiscal years 2015 and 2016. Meanwhile, long-term incentive (LTI) awards are being granted more frequently as performance-vesting stock, contingent on hitting pre-determined goals, rather than as stock options. At the smallest companies by revenue (less than $1 billion), nearly half of the reported compensation of GCs was in the form of equity awards that vest over a number of years rather than cash in the form of salary or bonus. At the largest companies by revenue (over $15 billion), about 62% of the average GC pay package was granted as either stock options or restricted stock.
GCs at Smaller Companies Saw Biggest Pay Increases
From fiscal 2015 to 2016, GCs at public companies below $5 billion in revenue saw a greater increase in total compensation compared to GCs at larger companies. While the GCs at larger companies were awarded packages that far exceeded their colleagues at smaller companies, the GCs at smaller companies saw pay rise at higher rates, and in some cases, in higher absolute values. GCs at companies reporting revenues between $1 billion and $5 billion were awarded a median $1.5 million in total compensation, up over 8% from the year prior—an absolute increase of approximately $111,000. GCs at companies with revenues of less than $1 billion experienced a 6.6% (or $56,000) increase in median pay to nearly $918,000 in 2016.
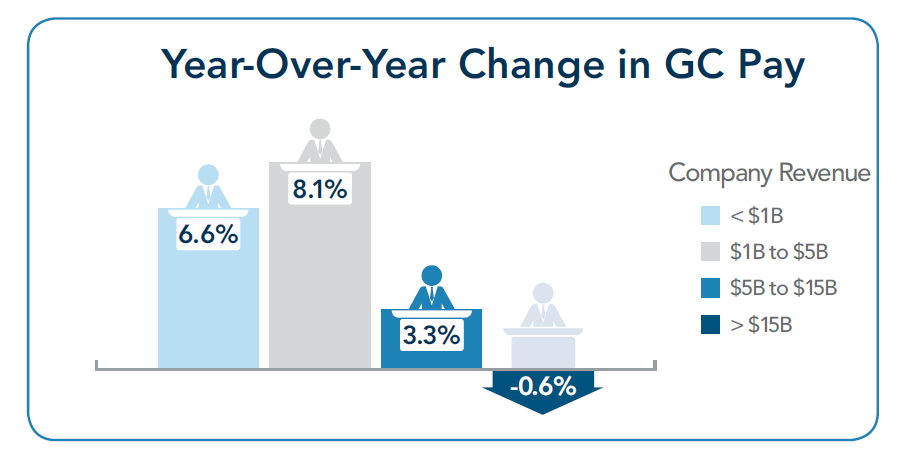
Meanwhile, GCs at companies reporting revenue over $15 billion received a median $3.8 million in total compensation in 2016, down 0.6% from 2015. GCs at companies reporting revenues between $5 billion and $15 billion saw total compensation rise 3.3% to a median $2.4 million in 2016, an absolute increase of about $75,000.
Stock Awards Bolstered GC Pay at Largest Companies
Stock-based awards granted in 2016 were largest for GCs at companies over $15 billion in revenue at a median $1.6 million, nearly twice that of GCs at companies with revenues between $5 billion and $15 billion. By comparison, GCs at the smallest companies (less than $1 billion revenue) in the study received a median $235,000 in stock awards.
On average, 46% of GC pay at the largest companies was delivered in stock, outpacing GCs at the smallest companies who received about one-third of total compensation in stock.
Among Equilar 500 companies, GCs serving in the technology sector received 63% of average 2016 total compensation in stock, the highest proportion of any sector. No other sector granted over 50% of total pay in stock, the closest being basic materials companies at nearly 49%. In terms of cash-based pay, the financial sector paid GCs the highest proportion of total compensation in salary and annual bonus, covering nearly 45% of the average pay package.

Relative TSR Most Commonly Determined Performance Award Payouts
The metrics used to measure goals for performance-vesting long-term incentives (LTI) of GCs closely mirrored performance metrics commonly utilized for CEOs. Of the GCs that received performance LTI, 52.3% had relative total shareholder return (TSR) linked to an award in 2016.
Similarly, about half of CEOs received awards in the same year tied to TSR performance, according to previous Equilar studies. Moreover, as investors voice a preference for return on invested capital (ROIC), companies have responded by leveraging the metric more frequently than years past. Performance LTI awards were linked to ROIC metrics for nearly one-quarter of GCs. Earnings per share (EPS) and revenue were also included for at least 20% of GCs, while earnings before interest, tax, depreciation and amortization (EBITDA) was the fifth most common metric in 2016 awarded to 17% of GCs.