 Print
PrintJessica Phan is a research analyst at Equilar, Inc. This post is based on an Equilar publication by Ms. Phan.
The introduction of the CEO Pay Ratio has created interest not only in how CEO compensation compares against pay for a company’s median employee, but also how employee pay compares across companies and industry sectors. The SEC required companies with a fiscal year beginning on or after January 1, 2017 to disclose their CEO pay ratio for the first time, and with the proxy filing deadline for these companies passing on April 30, a critical mass of data is now available for analysis.
The Equilar CEO Pay Ratio Tracker aggregates weekly and provides cumulative results on the lowest, median, and highest CEO pay ratios. With over 2,000 data points available as of May 10, 2018, the median pay ratio was 70:1 for all Russell 3000 companies and 166:1 for all Equilar 500 companies.
There are some outliers at the lowest and highest end of the pay ratio spectrum. Among Russell 3000 companies, 10 companies had a pay ratio of 0—including Twitter, Inc. (TWTR), RE/MAX Holdings, Inc. (RMAX), and Fossil Group, Inc. (FOSL)—due to the fact that these companies’ CEOs declined compensation. On the flip side, Weight Watchers International Inc. (WTW) disclosed the highest pay ratio of 5,908:1. The CEO’s compensation for 2017 was $35,524,002 while Weight Watchers’ median employee received $6,013. The company identified its median employee as a receptionist service provider who worked on average 10.7 hours per week. The company disclosed the reason for the CEO’s particularly high compensation, low employee pay and resulting ratio as follows:
“Ms. Grossman’s annual total compensation in fiscal 2017 included several one-time compensation awards and benefits, which the Company does not expect to provide in future years, including equity hiring awards of RSUs and stock options (the aggregate value, as calculated in accordance with the requirements of the Summary Compensation Table, of these awards was $26,324,630) and reimbursement of certain temporary housing and moving expenses in connection with her relocation and related tax gross-up payments.”
Of all Equilar 500 companies, Alphabet Inc. (GOOGL) disclosed the lowest pay ratio of 0.000005:1, as the CEO was paid $1 while the median employee was paid $197,274. Conversely, McDonald’s Corp (MCD) disclosed the highest pay ratio for Equilar 500 companies at 3,101:1, with CEO compensation of $21,761,052 and median employee salary of $7,017. McDonald’s defined the median employee as a part-time restaurant crew employee located in Poland.
CEO Pay Ratio by Company Size
In addition to breaking down pay ratio trends by index, company size in a variety of forms also tells different stories for the CEO pay ratio. When examining the CEO pay ratios based on market capitalization, as company market cap increased, the median CEO pay ratio increased as well. The median ratio for companies with a market cap above $25 billion was 213:1, in comparison to 32:1 for those with market cap below $1 billion.
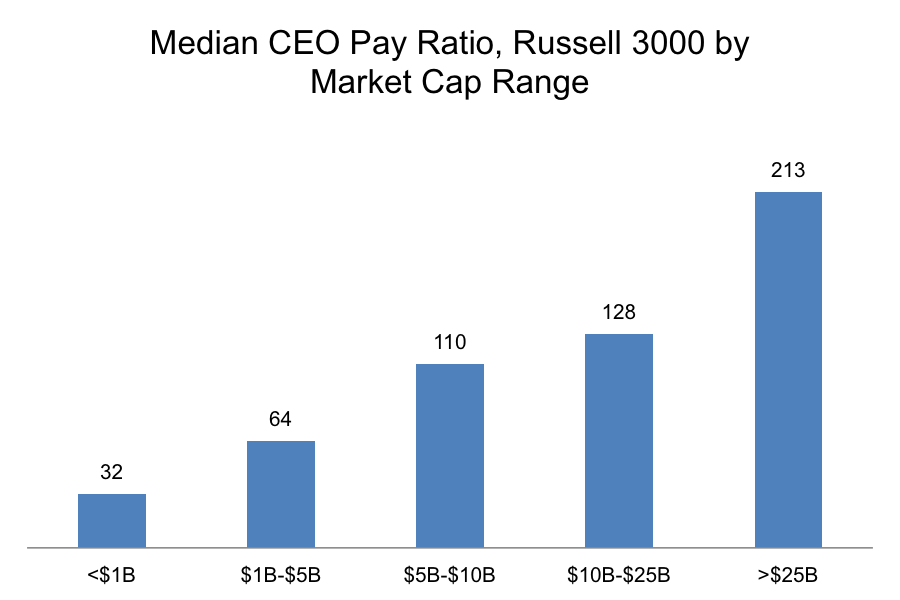
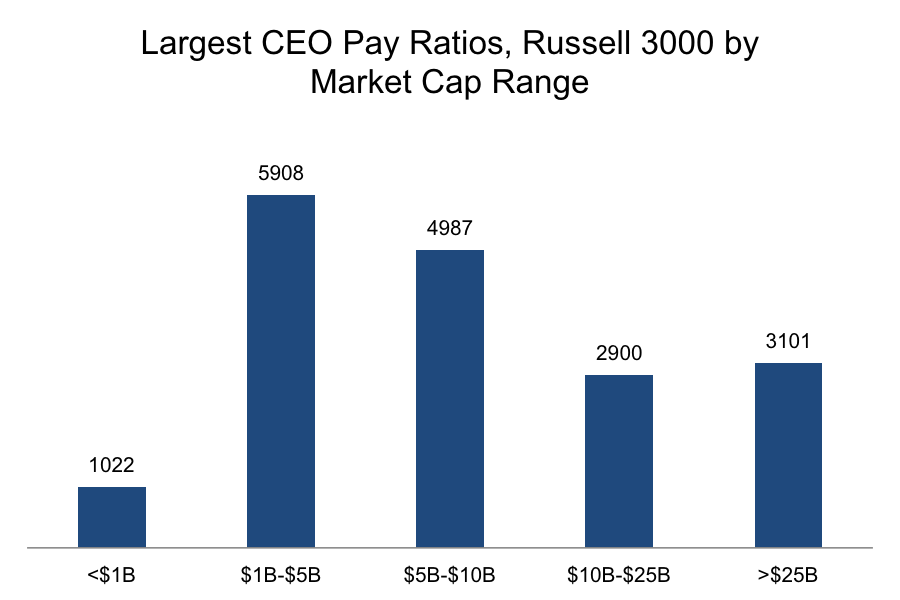
For example, in the financial sector, American Express (AXP) had market capitalization of $86.2 billion in fiscal year 2017, and its CEO pay ratio was 327:1. By comparison, CNB Financial Corp (CCNE) had a market capitalization of $401.1 million and a CEO pay ratio of 32:1. However, though the median increased with market capitalization, the highest CEO pay ratios were not from companies with the largest market caps. In fact, the largest CEO pay ratio when broken down by market cap range was in the $1 billion to $5 billion range.
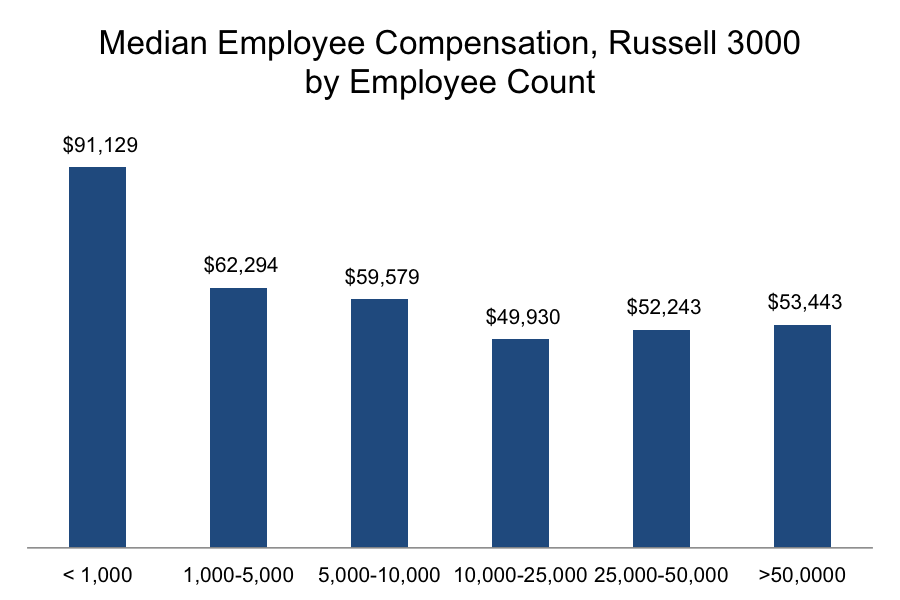
As shown in the market capitalization analysis, as the number of employees at a company increased, median employee pay was generally lower and the ratio was generally higher. The median employee pay across all Russell 3000 companies was $64,024, which was most closely aligned to companies with 1,000 to 5,000 employees. For companies above 10,000 employees, median employee compensation was around $50,000. Given that CEOs at large companies also tend to earn more on average, the CEO pay ratio increased at companies with a higher number of employees.

CEO Pay Ratio by Industry
Breaking down the data by sector shows a wide range between industries. Prior to proxy statements for fiscal year 2017 being filed, many expected the consumer goods and services sectors to have the highest CEO pay ratios, due to the fact that a large portion of the workforces in these two sectors are often part-time employees. The actual disclosures confirmed this suspicion, as the CEO pay ratios for consumer goods and services sectors were higher compared to other sectors at 142:1 and 127:1 respectively.

CEO Pay Ratio Disclosure Design
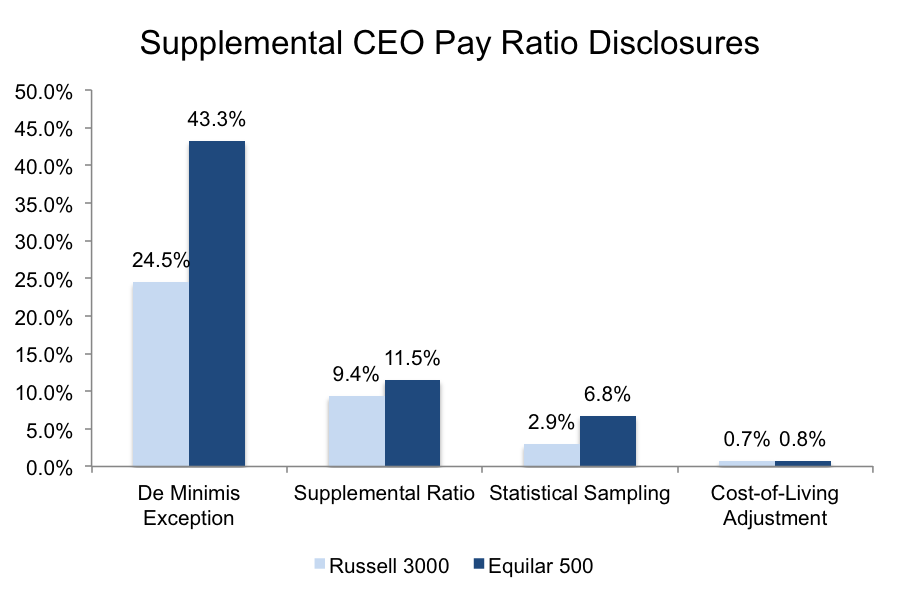
The SEC provided a wide variance in guidelines to disclose the ratio, and companies have decision-making power to provide pay ratio disclosure, various calculations and any additional information they want to add. According the SEC, companies only have to provide the median pay, CEO pay and CEO pay ratio. Companies are also allowed to exclude up to 5% of their employee population under the de minimis exception to exclude non-domestic employees from the ratio and make any appropriate cost-of-living adjustments to account for compensation for employees outside the area of the CEO’s residence.
About 24.5% of all Russell 3000 companies utilized the de minimis exception, while less than 1% of all Russell 3000 companies made a cost-of-living adjustment. Due to various reasons such as one-time equity awards or one-time sign-on bonuses, 9.4% of all Russell 3000 companies and 11.5% of all Equilar 500 companies disclosed a supplemental ratio to explain the high CEO pay ratio. Additionally, 2.9% of Russell 3000 companies and 6.8% of Equilar 500 companies utilized statistical sampling to determine their median employee.
Finally, companies were also allowed any company-specific supplemental ratios. For example, Nu Skin Enterprises Inc. (NUS) disclosed two additional supplemental ratios—one for its non-cost-of-living adjusted pay ratio and one that excluded 87% of its workforce.
Notably, a combined 36.7% of all companies that used a de minimis exception, 57.1% of all companies that used a cost-of-living adjustment and 31.8% of all companies that included a supplemental ratio came from companies in the consumer goods and services sectors.
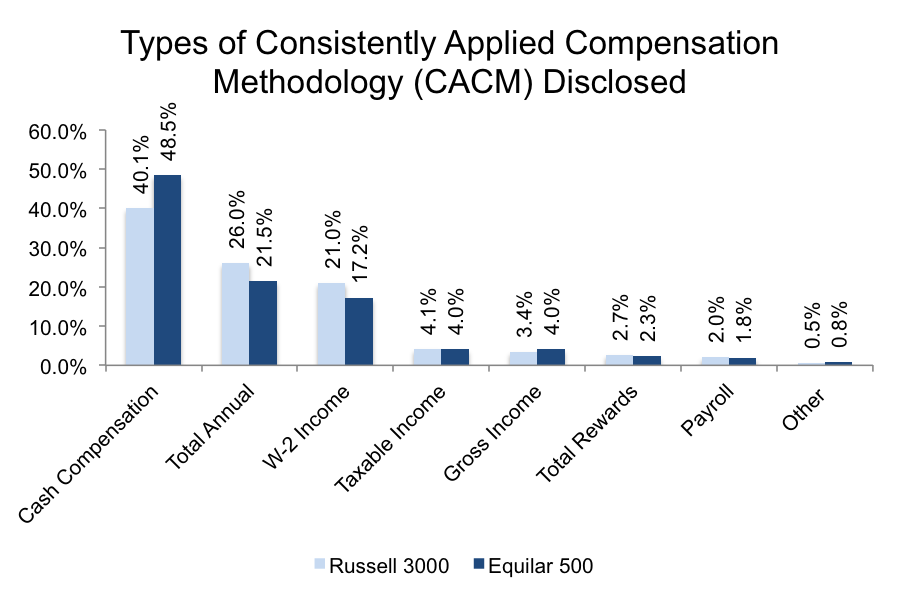
The most used Consistently Applied Compensation Methodology (CACM) from both Russell 3000 companies and Equilar 500 companies was cash compensation. Just over 40% of Russell 3000 companies and 48.5% of Equilar 500 companies used cash to determine of median employee population. Meanwhile total annual compensation, which includes cash compensation and any type of equity or stock, was used by 26.1% and 21.5% of Russell 3000 and Equilar 500 companies, respectively.
While the most recent proxy season provided insight into how companies approached the new implementation of the CEO pay ratio, it doesn’t allow for the entire landscape to be analyzed. With only one year of data, a waiting game will be played over the next few years in order to see if there are any strong correlations between ratio and material company performance.
