 Print
PrintAriel J. Deckelbaum, Scott A. Barshay, and Robert B. Schumer are partners at Paul, Weiss, Rifkind, Wharton & Garrison LLP. This post is based on a Paul, Weiss memorandum authored by Messrs. Deckelbaum, Barshay, Schumer, Jeffrey D. Marell, Angelo Bonvino, and Taurie M. Zeitzer. Related research from the Program on Corporate Governance includes Why Have M&A Contracts Grown? Evidence from Twenty Years of Deals, and M&A Contracts: Purposes, Types, Regulation, and Patterns of Practice, both by John C. Coates, IV.
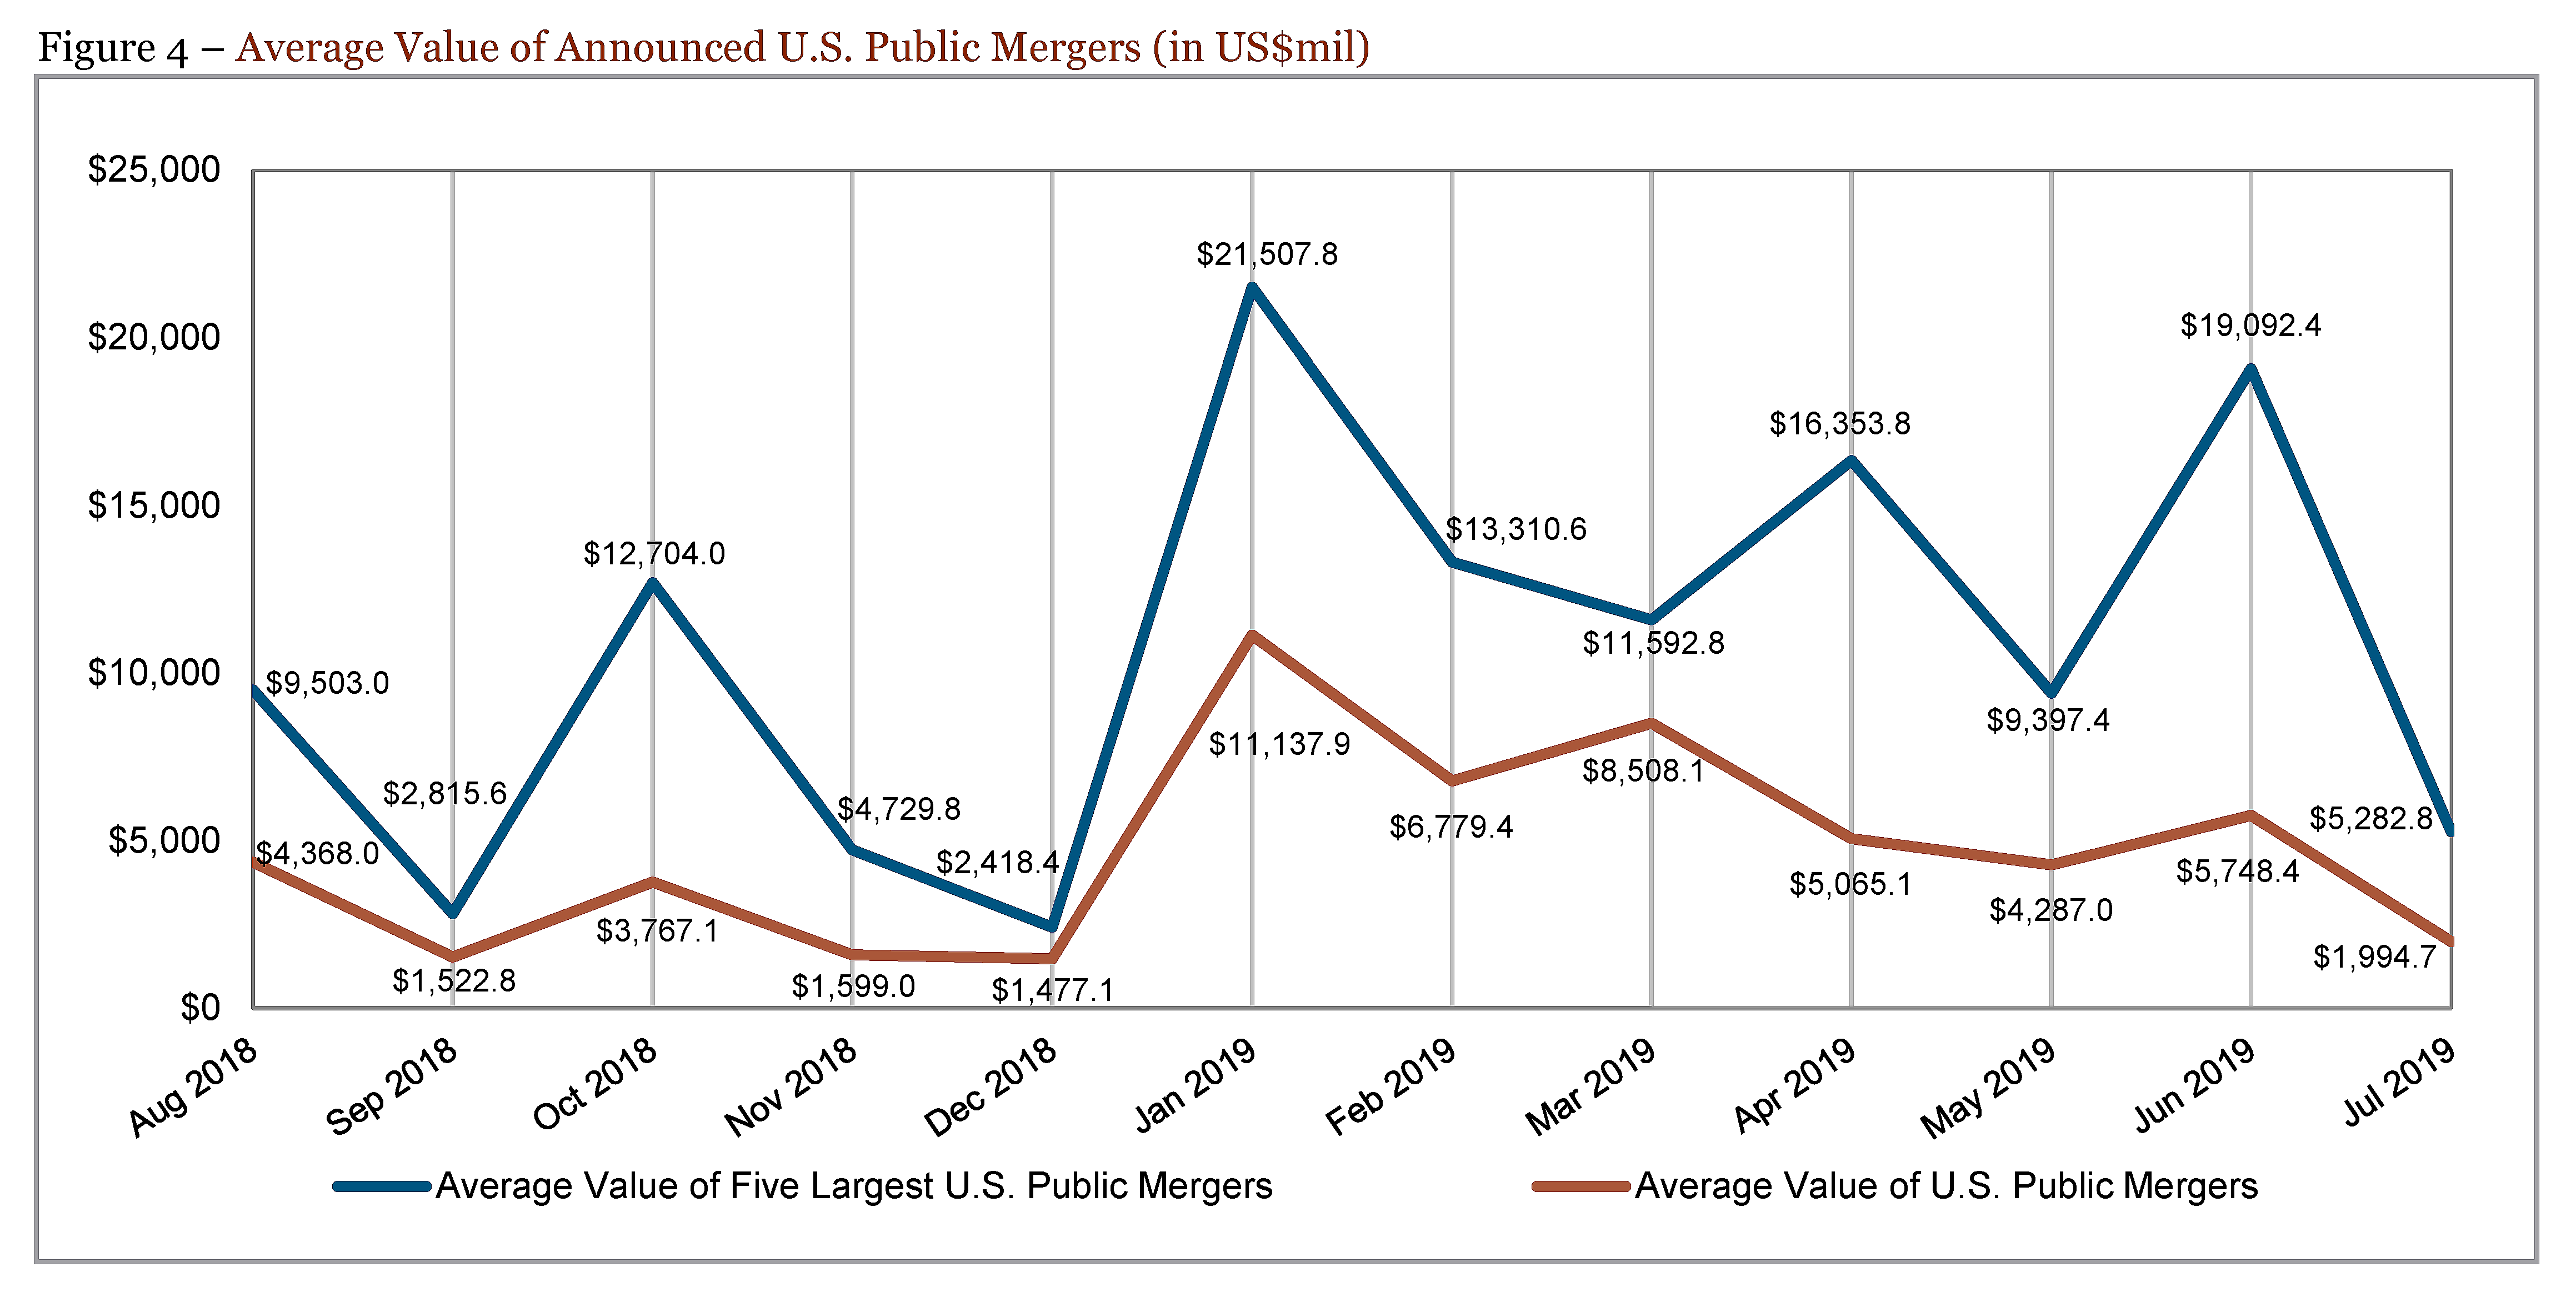
M&A activity in the U.S. and globally generally weakened in July. The only bright spots were an increase in the number of deals globally, by 6.9%, to 2,893 deals and an increase in certain sponsor-related and crossborder activity (see below). Meanwhile, the U.S. saw an 8.0% decrease in the number of deals, to 676 deals. The total value of deals* fell in the U.S. by 57.4%, to $138.63 billion, and globally by 34.9%, to $322.40 billion. Finally, average deal value decreased in the U.S. by 53.6%, to $205.1 million, and globally by 39.1%, to $111.4 million. Figure 1. The average value of the five largest announced U.S. public mergers decreased significantly by 72.3%, to $5.28 billion. Figure 4.
Strategic vs. Sponsor Activity
Strategic versus sponsor activity was a bit more mixed. The number of strategic deals decreased in the U.S. by 6.4% to 528, but increased globally by 5.4% to 2,487. Figure 1 and Annex Figures 1A-4A. However, strategic deal volume as measured by dollar value decreased significantly in the U.S. by 71.8% to $78.77 billion and globally by 48.2% to $209.92 billion. The number of sponsor-related deals decreased in July 2019 by 13.5% to 148 in the U.S. but increased by 17.0% to 406 globally, respectively. Sponsor-related volume by dollar value increased by 31.7% to $59.85 billion in the U.S. and by 24.4% to $112.47 billion globally. Figure 1 and Annex Figures 1A-4A.
Crossborder Activity
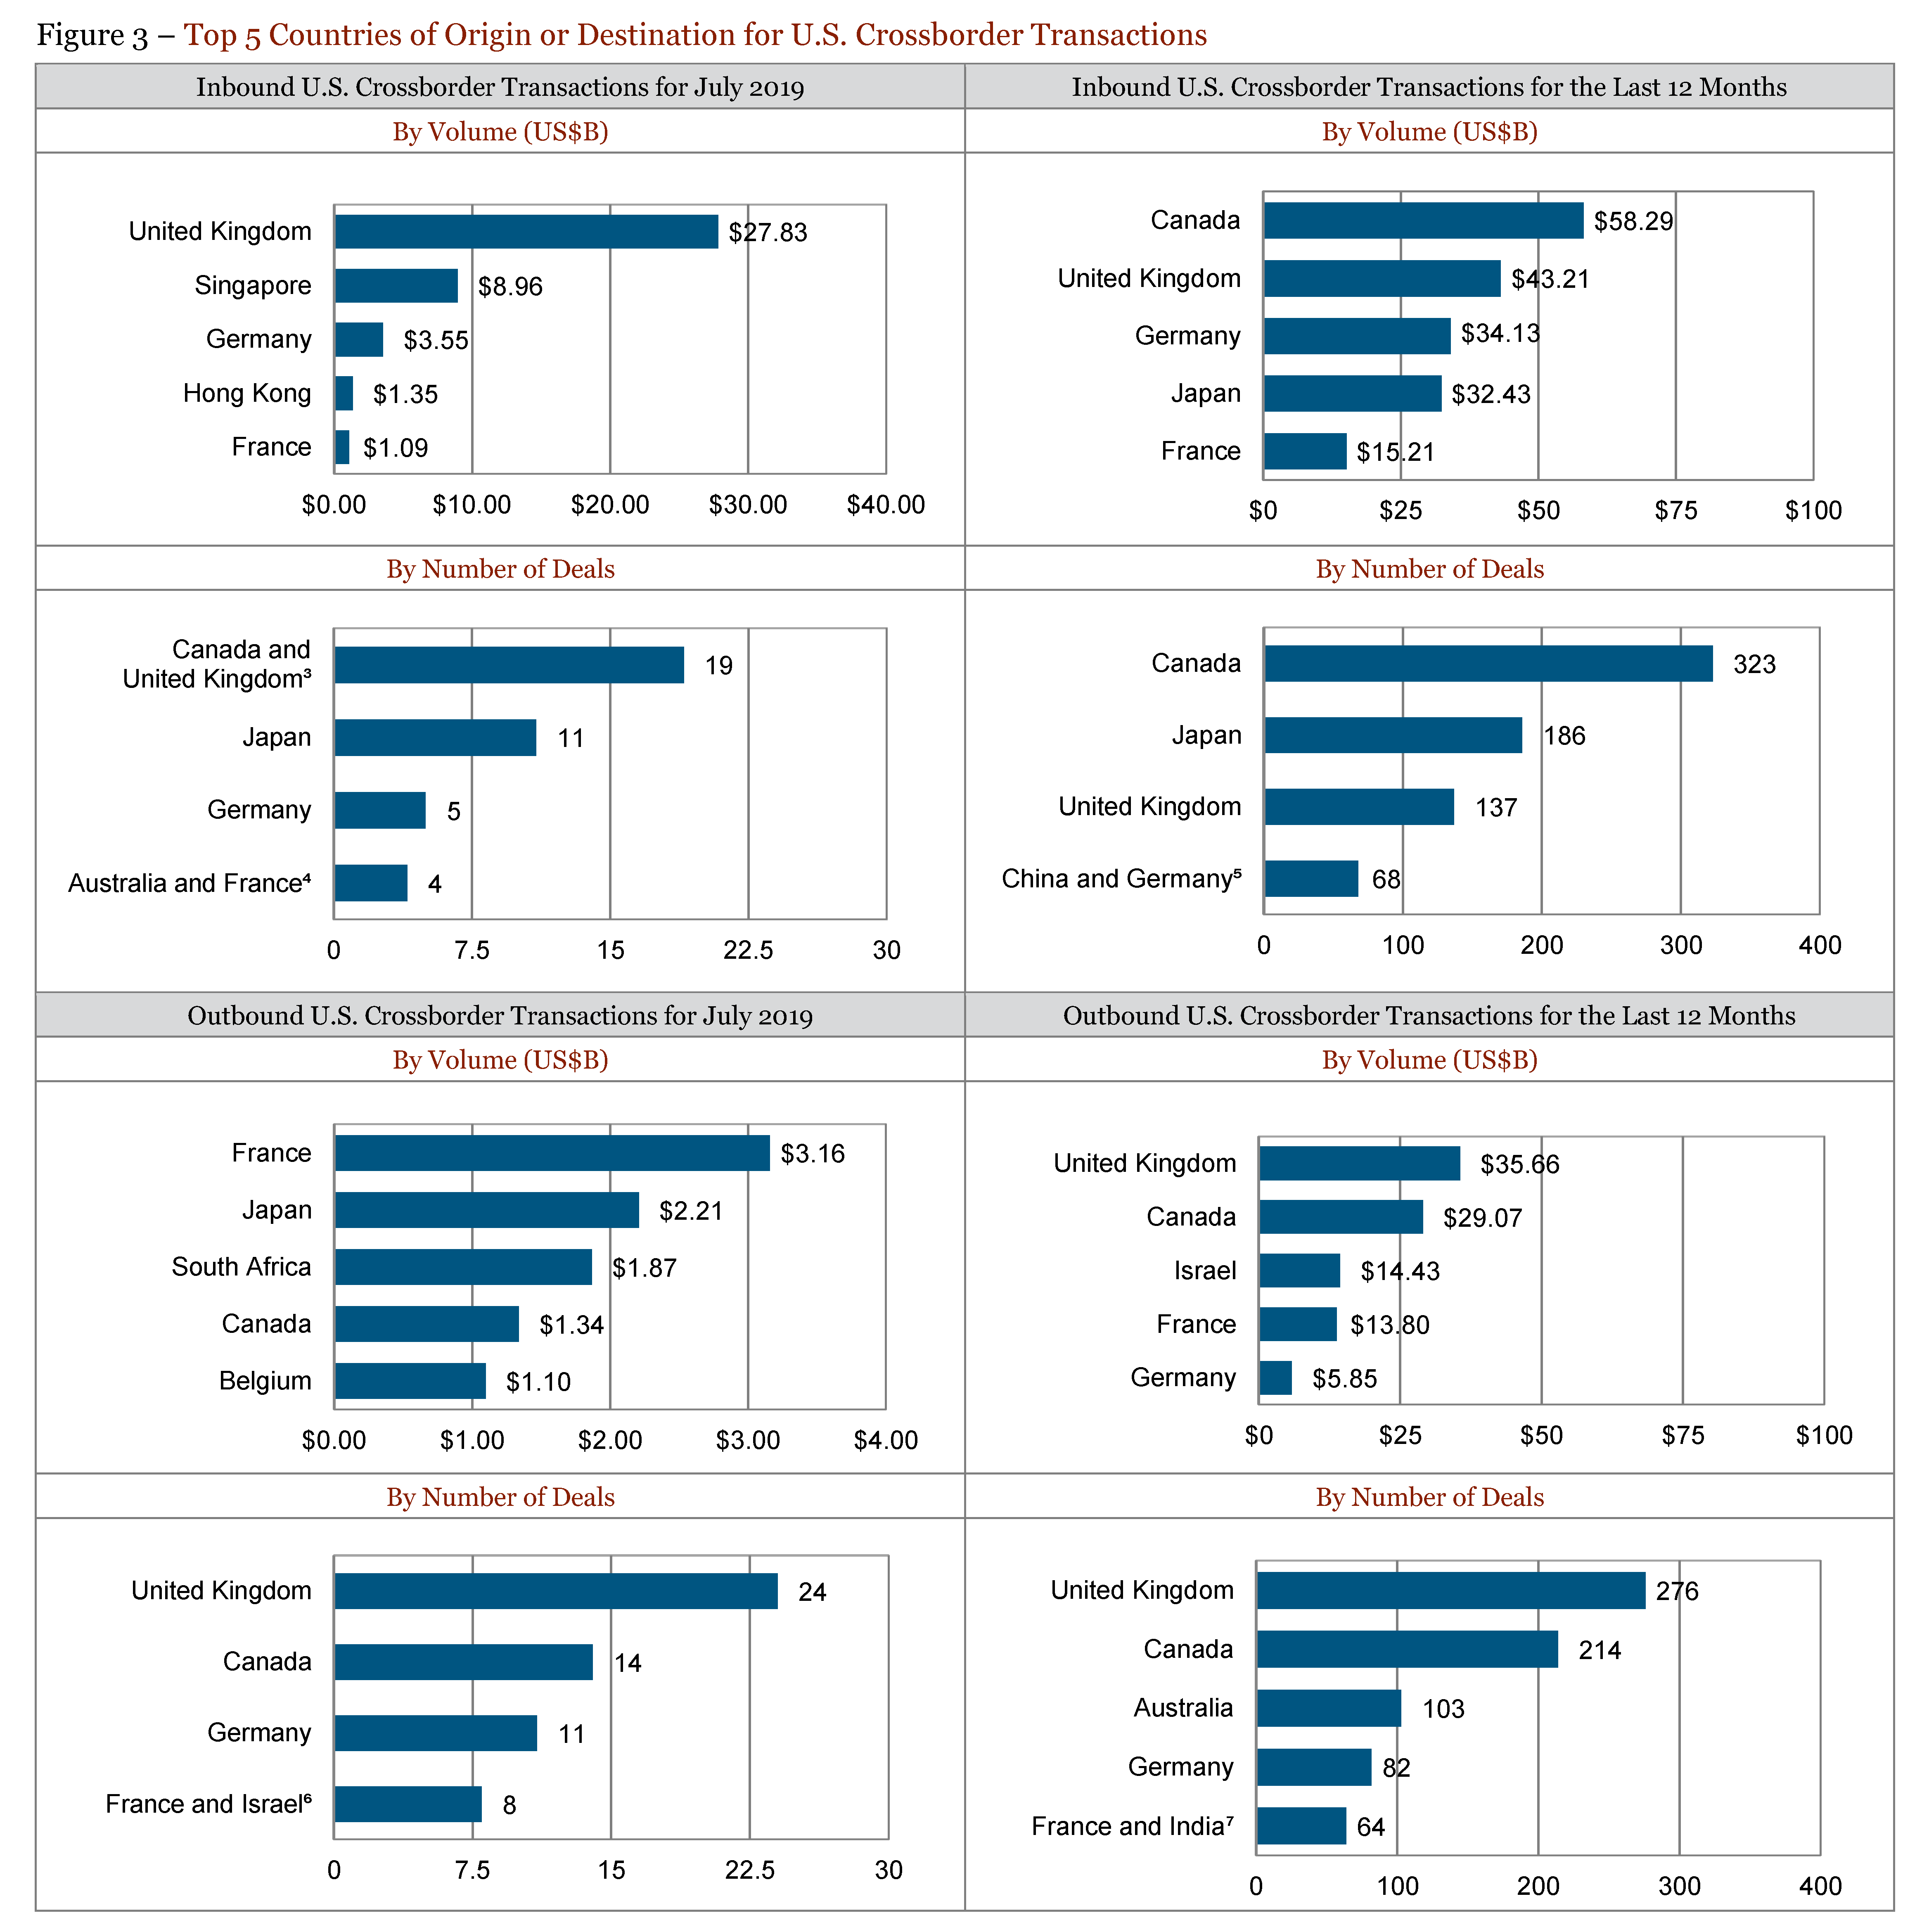
Crossborder deal volume by dollar value increased by 55.5% to $125.13 billion and the number of crossborder deals increased globally by 14.6% to 697. The number of U.S. inbound crossborder deals decreased in July by 14.1% to 85, while the number of U.S. outbound crossborder deals increased by 2.3% to 136. U.S. inbound activity as measured by dollar value increased significantly by 78.4% to $45.36 billion and U.S. outbound activity as measured by dollar value increased by 88.2% to $14.62 billion. Figure 1 and Annex Figures 5A—7A.
The U.K. was the leading country for U.S. inbound activity in July by total dollar value, while Canada was the leading country for U.S. inbound activity over the last 12-month period ($27.83 billion and $58.29 billion, respectively). Canada and the U.K. tied as the leading countries for U.S. inbound activity in July by number of deals (19), although Canada was the leading country for U.S. inbound activity over the last 12-month period by number of deals (323). France was the leading country of destination for U.S. outbound activity in July by total dollar value ($3.16 billion). The U.K. remained the leading country of destination for U.S. outbound activity over the last 12 months by activity as measured by dollar value ($35.66 billion) and the leading country of destination for U.S. outbound activity in July and over the last 12 months by number of deals (24 and 276, respectively). Figure 3.
U.S. Deals by Industry
Computers and Electronics was the most active target industry in July and over the last 12 months by all measures, including by number of deals (245 and 2,605, respectively) and by dollar value ($44.02 billion and $448.23 billion, respectively). Figure 2.
U.S. Public Mergers
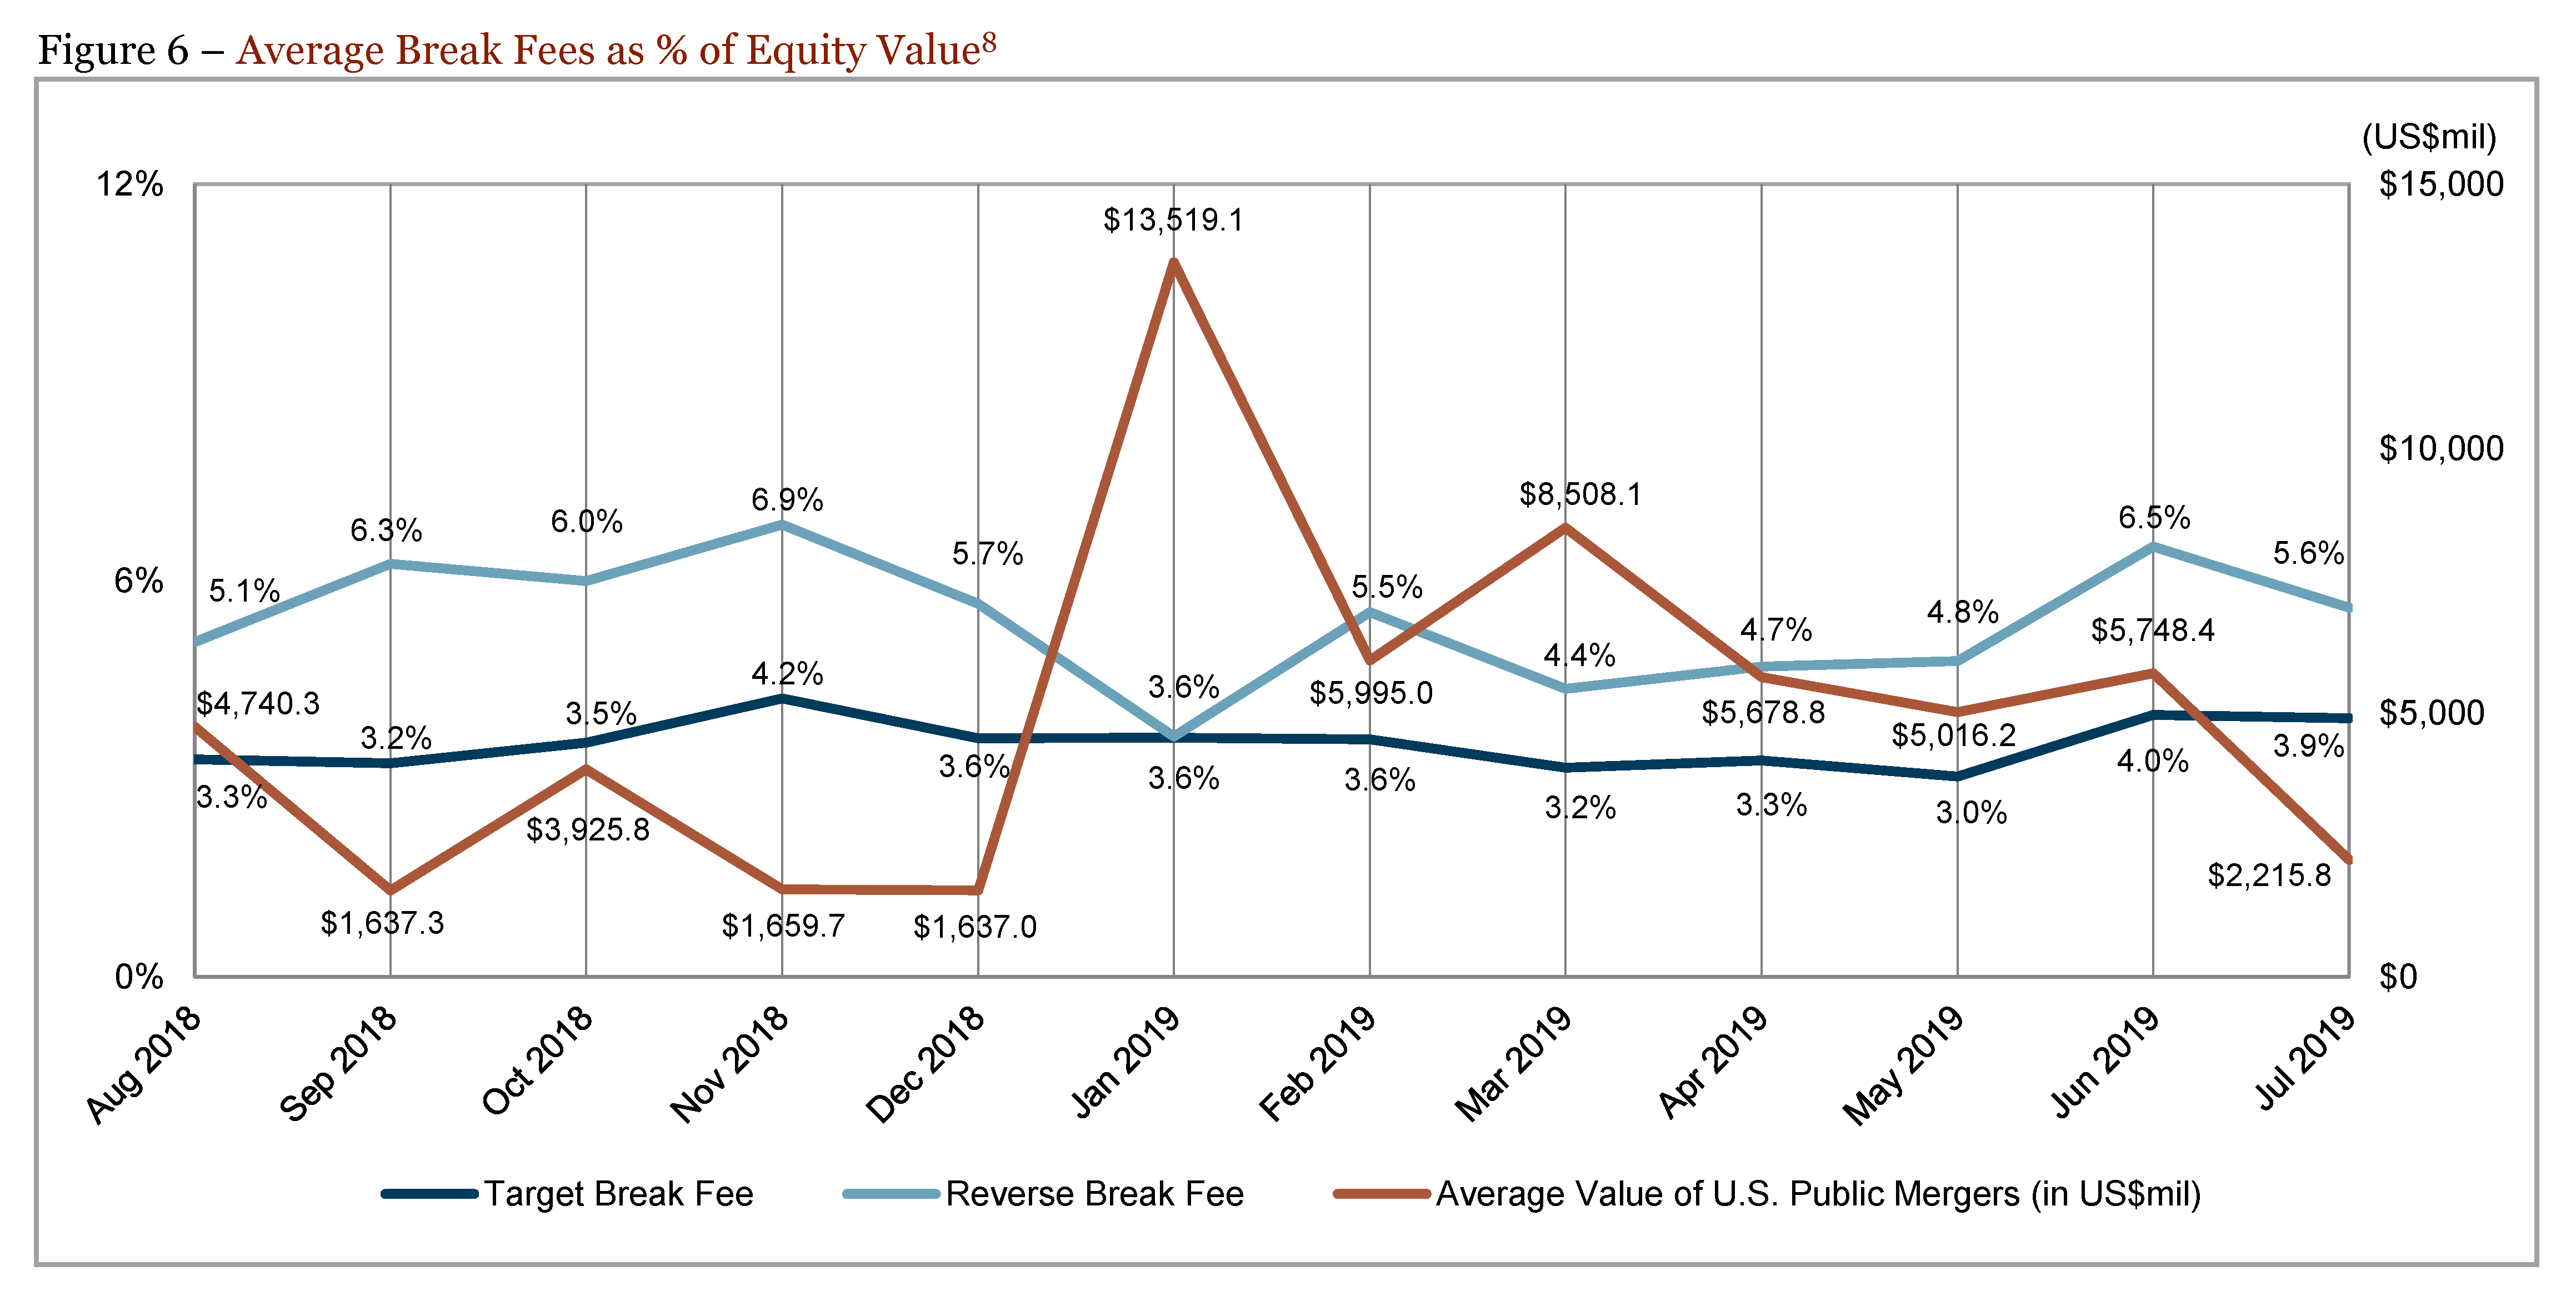
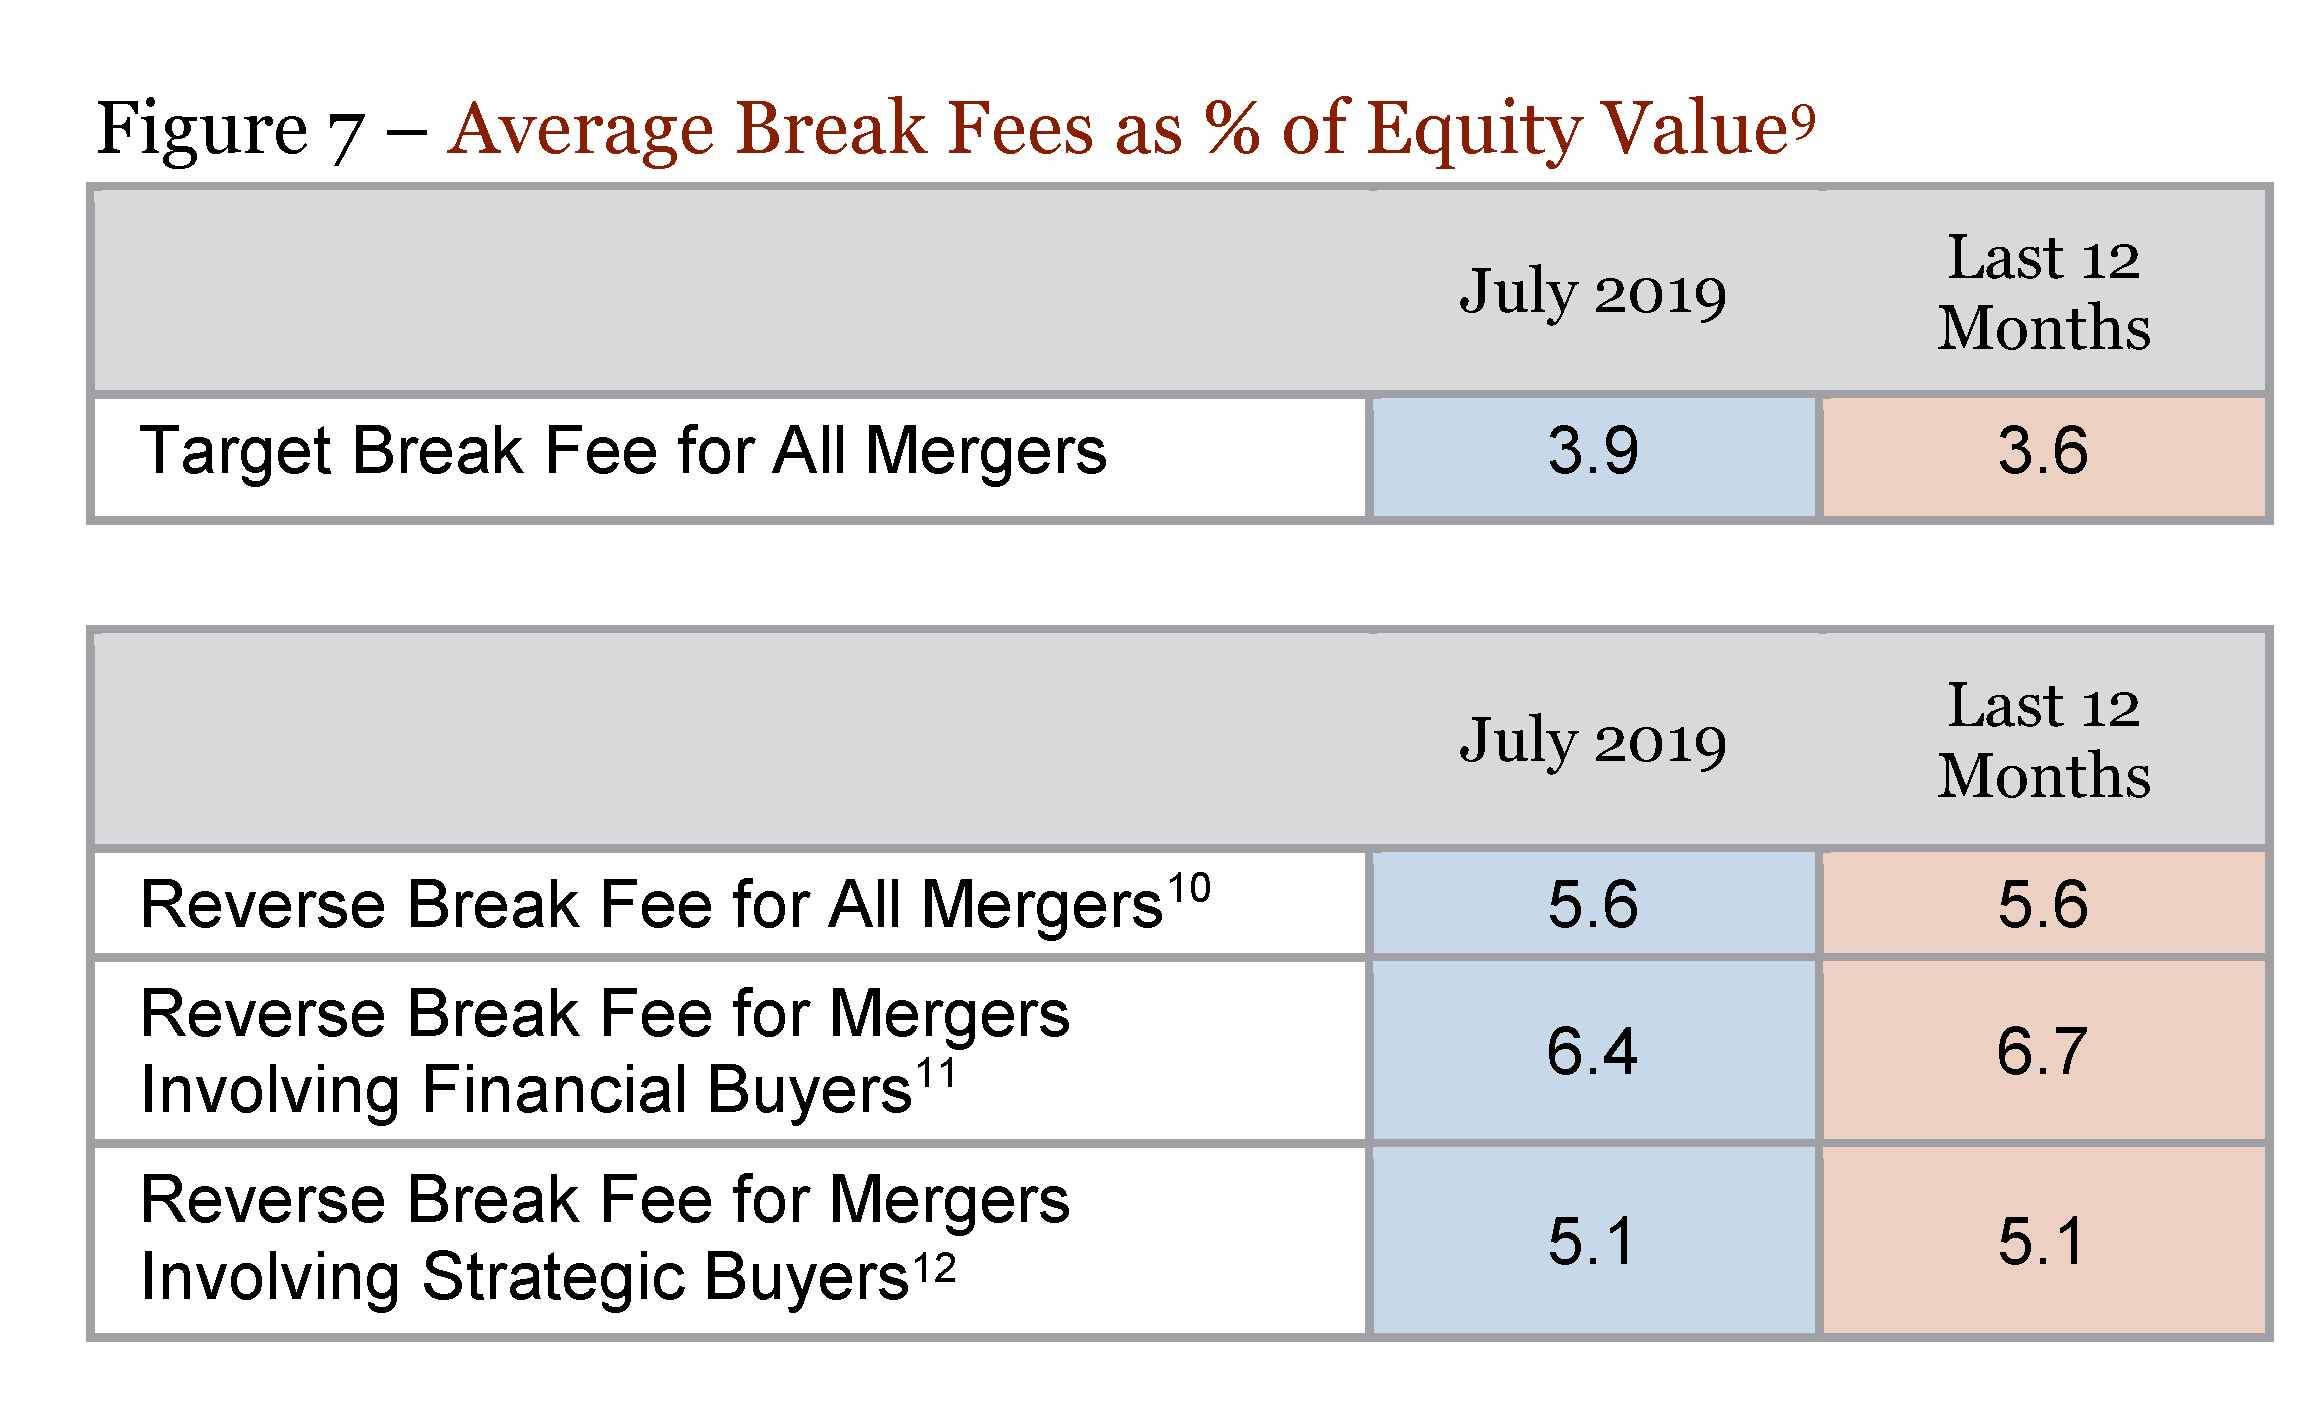
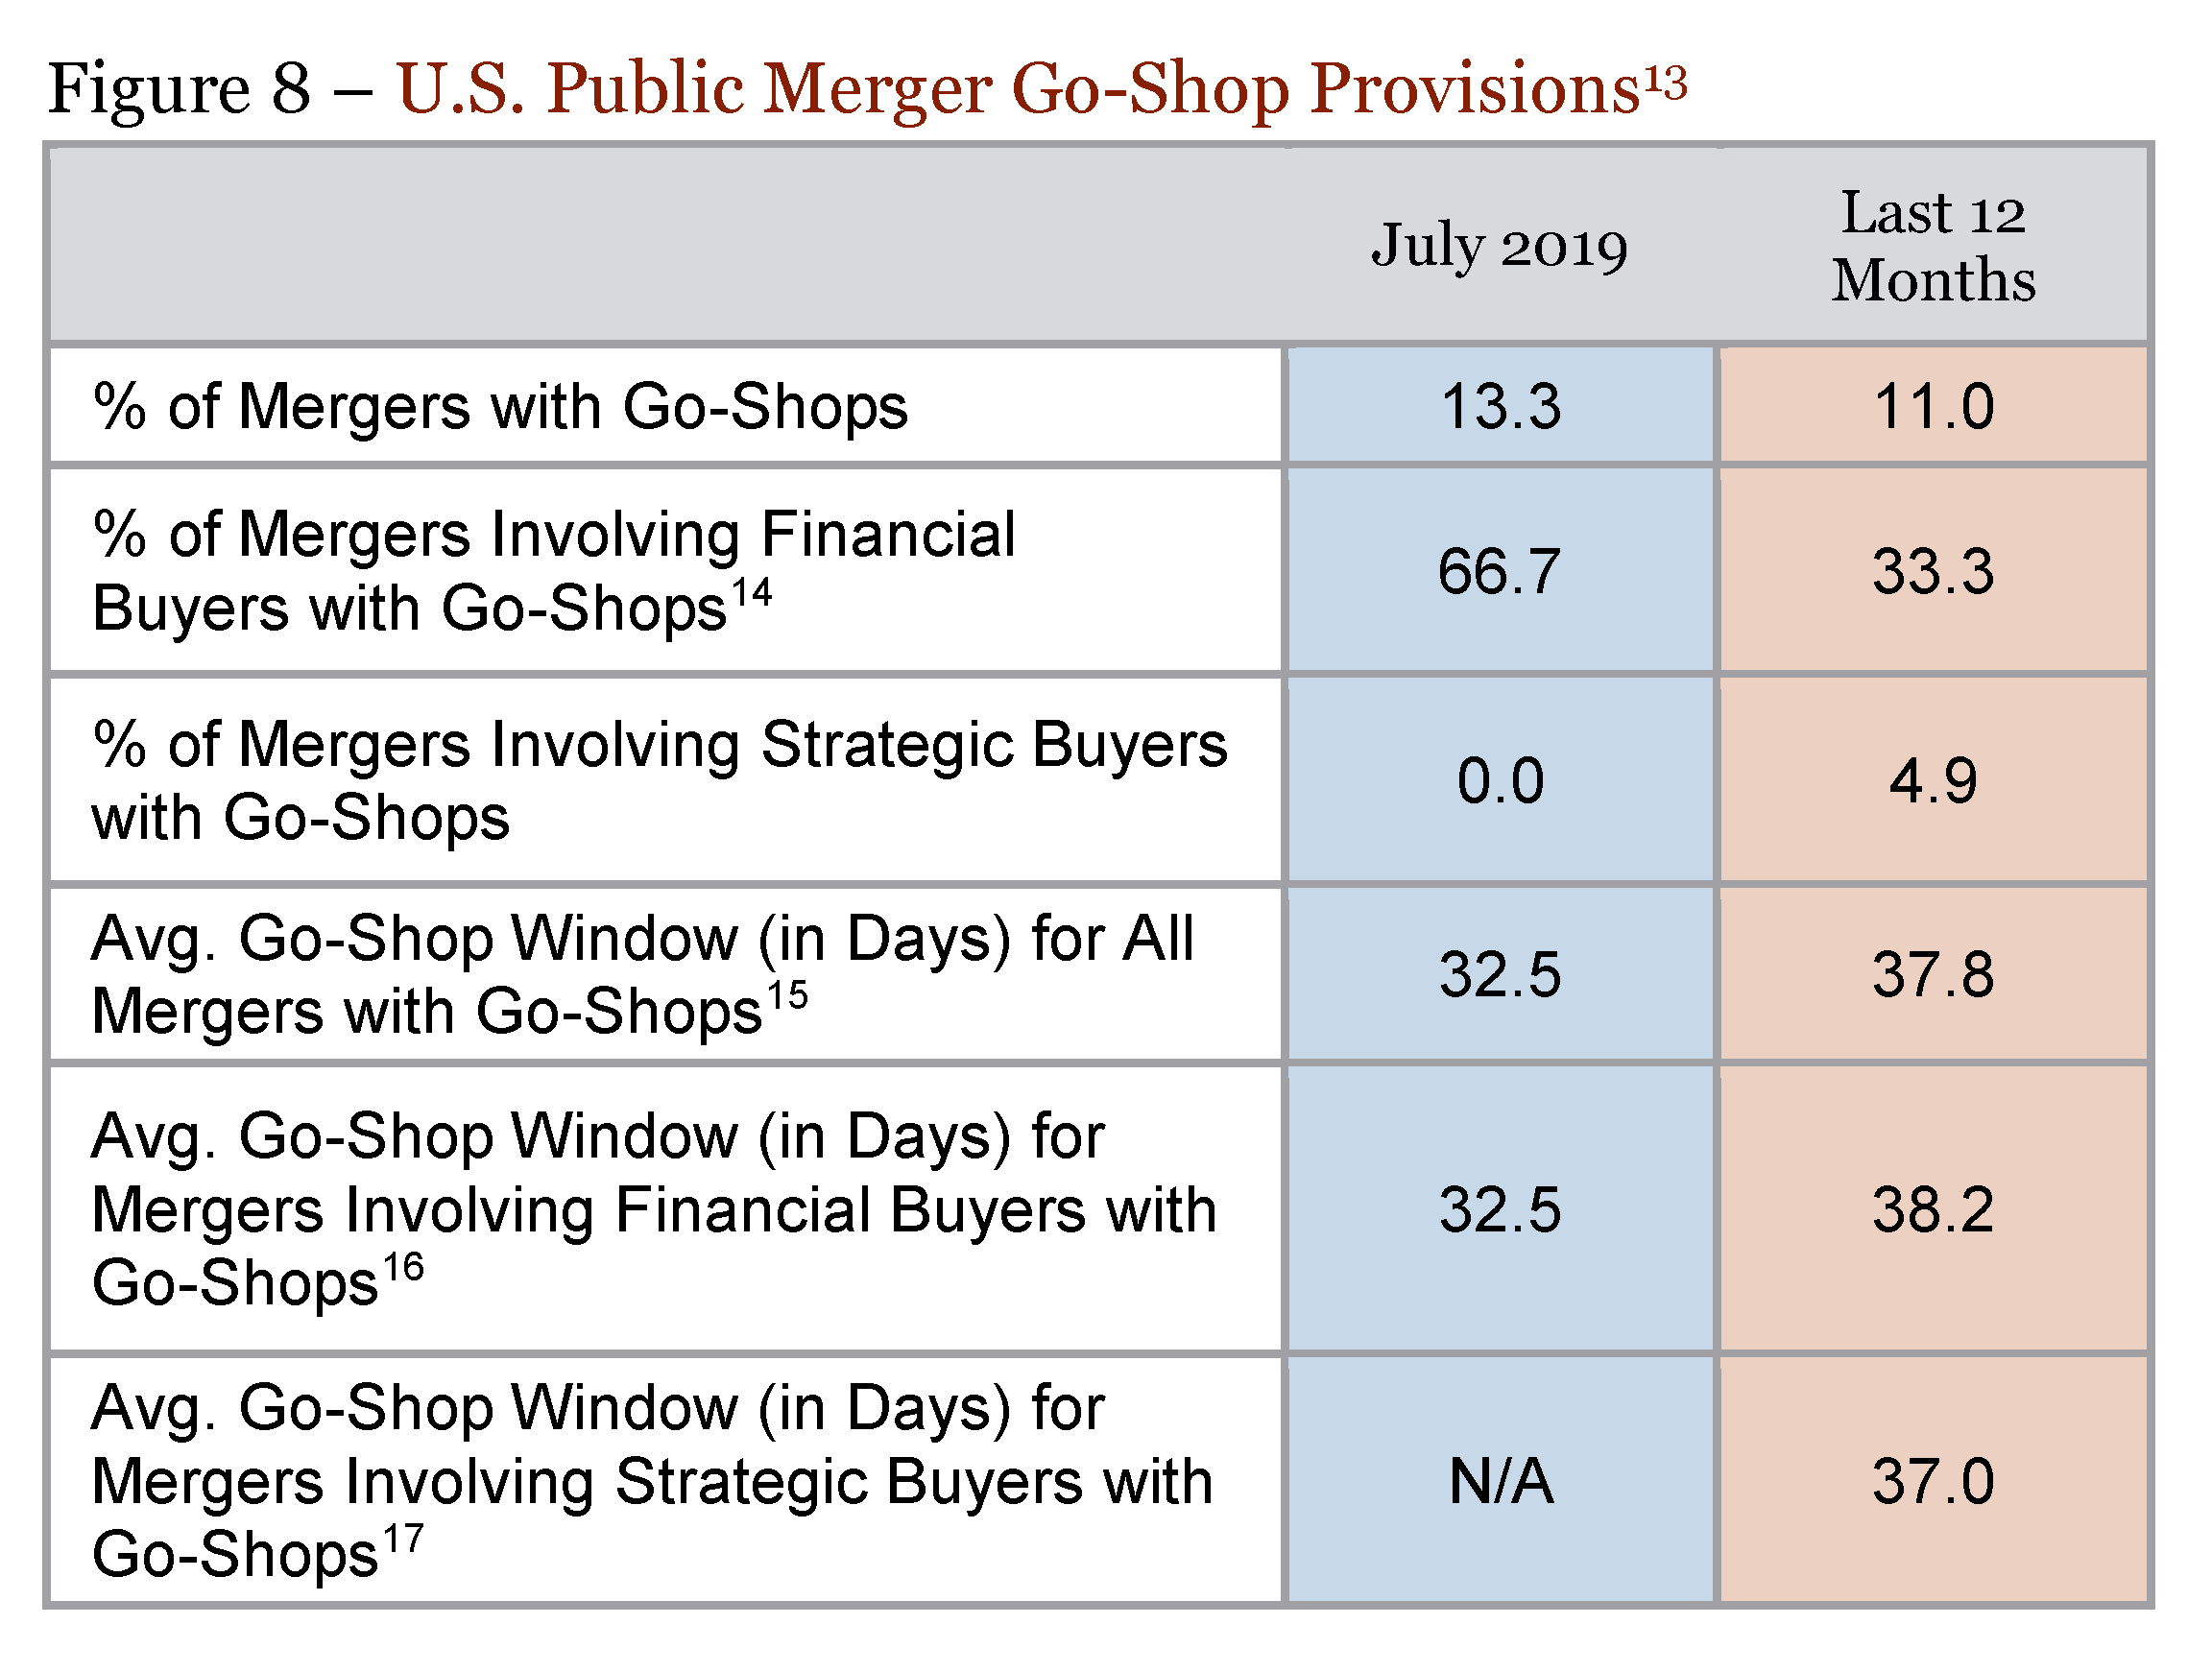
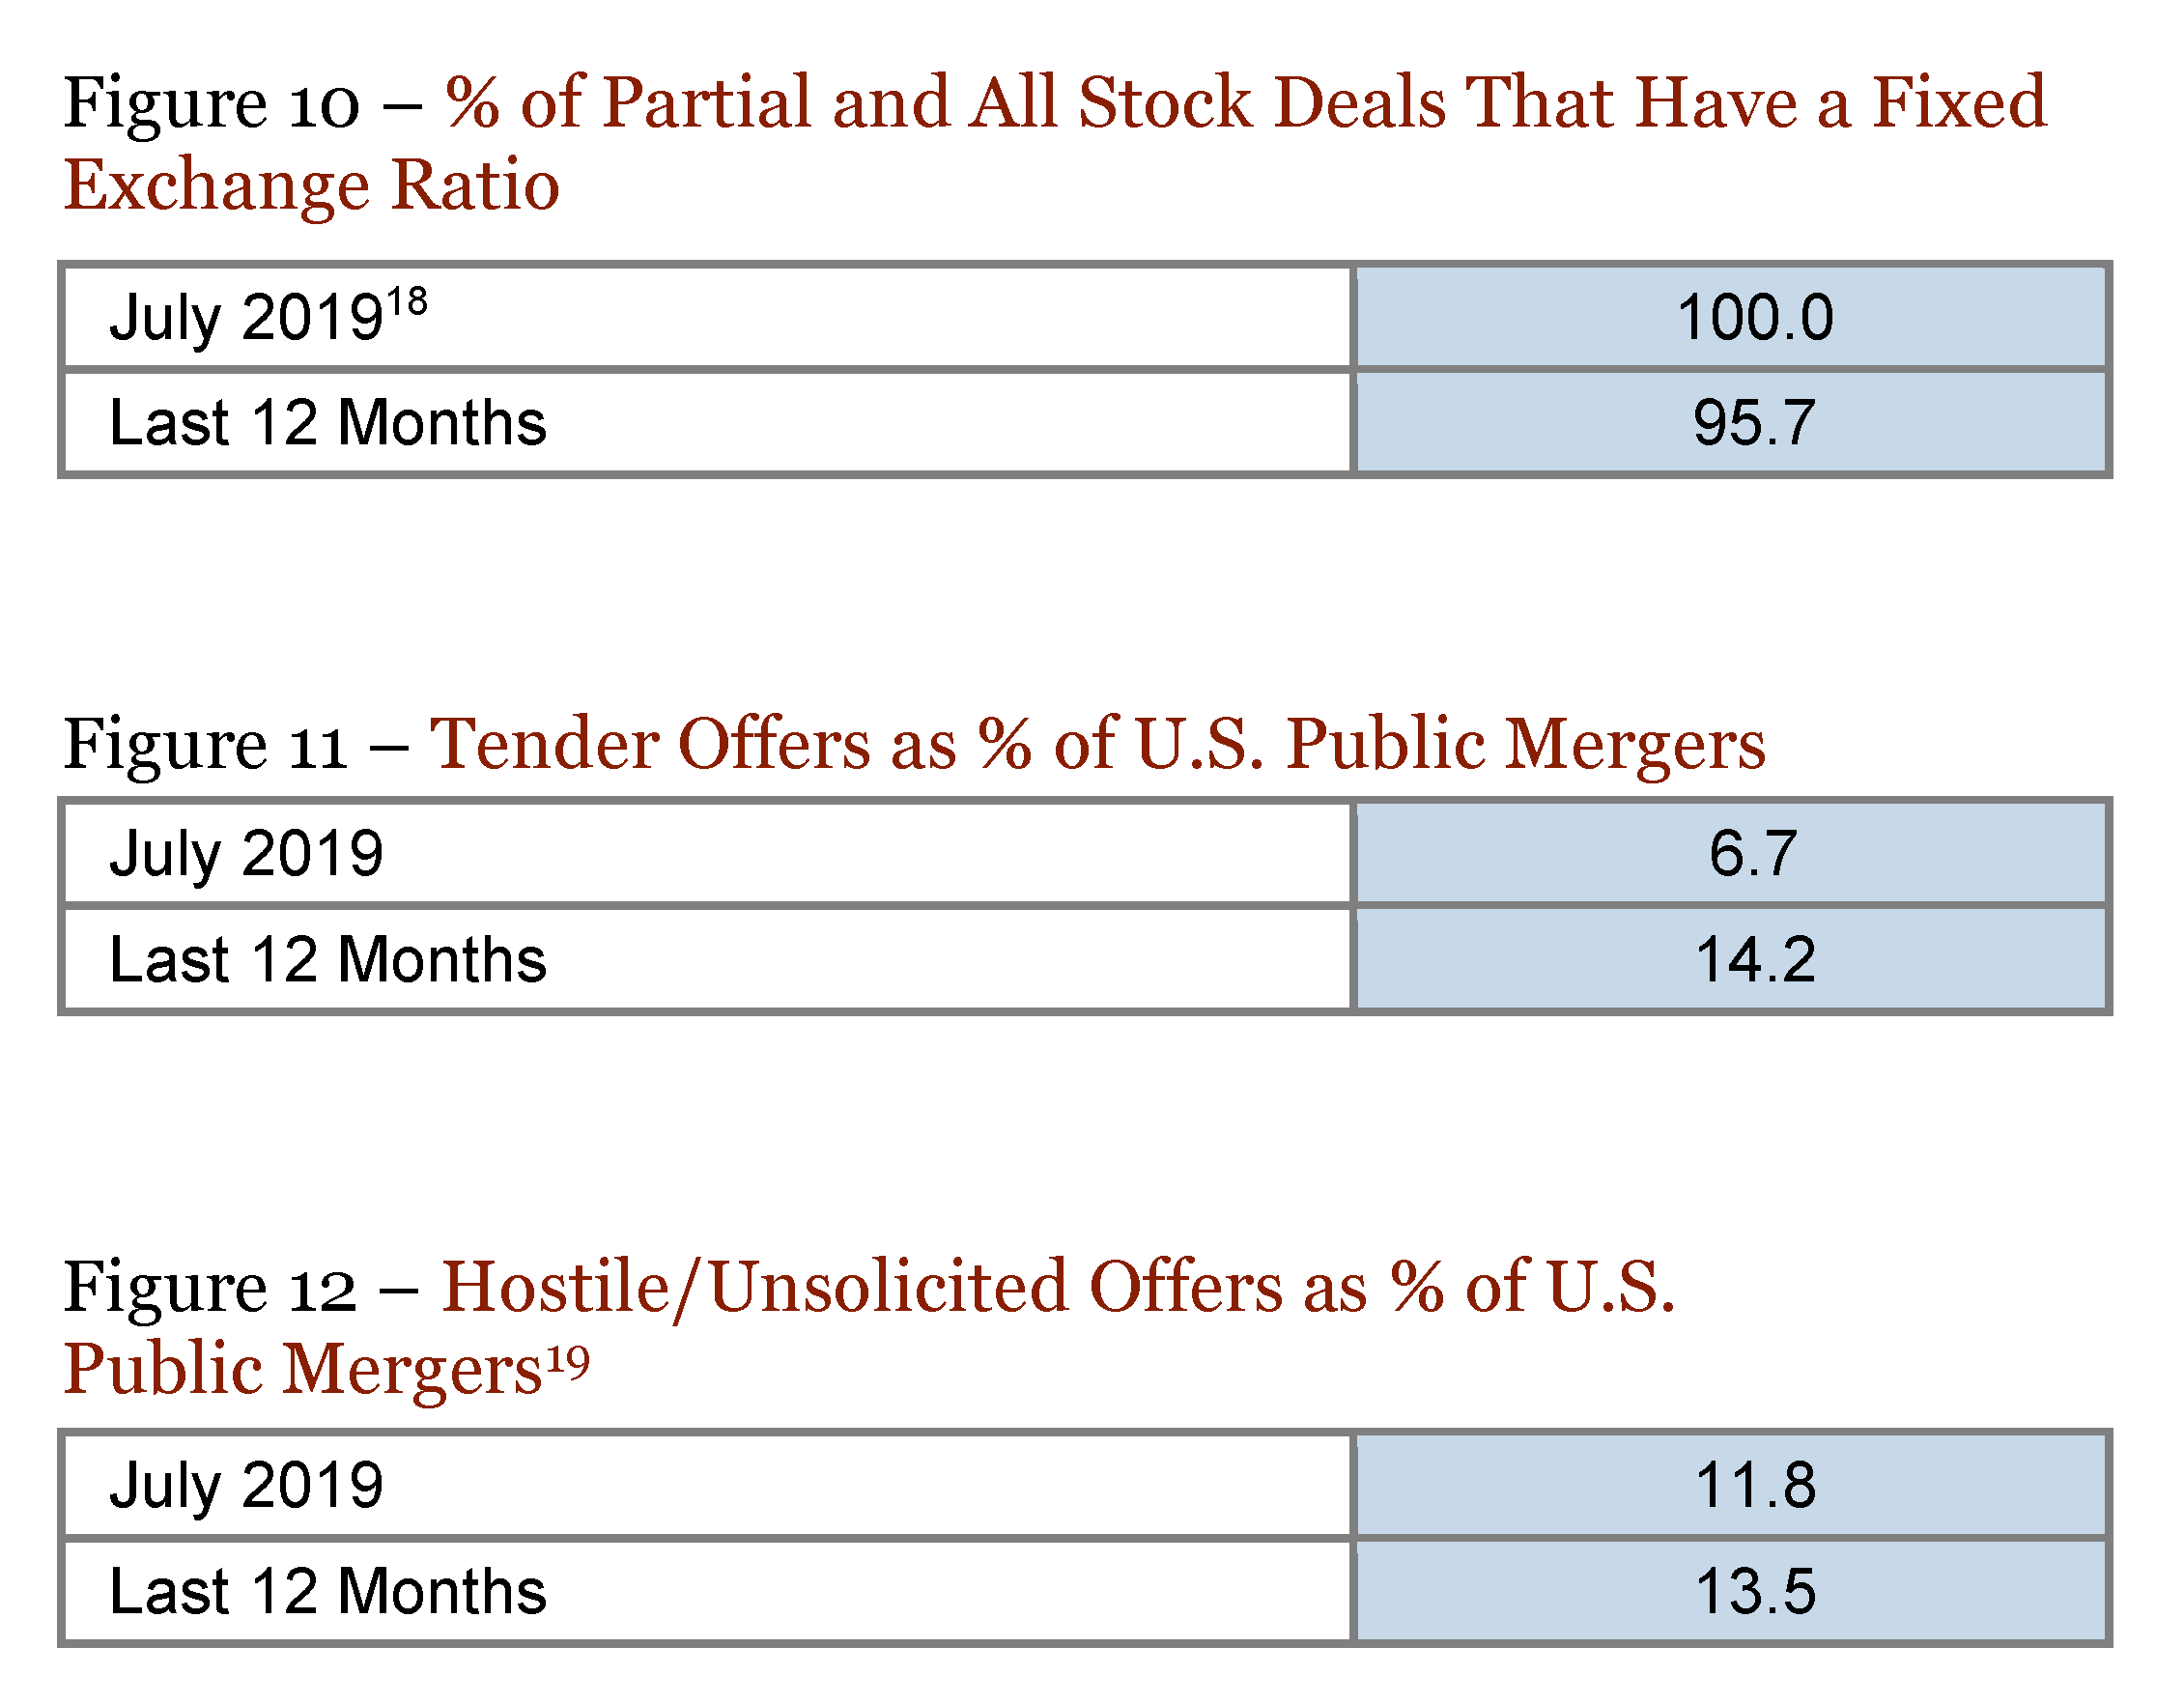
As for U.S. public merger deal terms in July 2019, average target break fees were above their 12-month levels (at 3.9% compared to 3.6%), and average reverse break fees were at their 12-month levels (at 5.6%). Two deals contained a go-shop provision. Figures 6, 7 and 8. Cash transactions comprised 60.0% of U.S. public mergers, above the 52.3% 12-month average. Figure 9. Hostile and unsolicited transactions represented 11.8% of announced U.S. public mergers in July 2019, compared to the 12-month average of 13.5%. Figure 12.
*Each metric in this post that references deal volume by dollar value is calculated from the subset of the total number of deals that includes a disclosed deal value.


Figures 1-3 were compiled using Cortex, and are for the broader M&A market, including mergers of any value involving public and/or private entities. Deal volume by dollar value and average value of deals are calculated from the subset of the total number of deals that include a disclosed deal value. Figures 4 and 5 were compiled using Deal Point Data, and include acquisitions seeking majority or full control of U.S. targets valued at $100 million or higher announced during the period indicated regardless of whether a definitive merger agreement was reached and filed or withdrawn. All data is as of August 12, 2019 unless otherwise specified. “Last 12 Months” data is for the period from August 2018 to July 2019 inclusive. Data obtained from Cortex and Deal Point Data has not been reviewed for accuracy by Paul, Weiss.
Figures 6-12 were compiled using Deal Point Data, and include acquisitions seeking majority or full control of U.S. targets valued at $100 million or higher announced during the period indicated and for which a definitive merger agreement was reached and filed (unless otherwise indicated). Data obtained from Deal Point Data has not been reviewed for accuracy by Paul, Weiss.

The complete publication, including footnotes and annex is available here.
