 Print
PrintJoseph Bachelder is special counsel at McCarter & English LLP. This post is based on a memorandum by Mr. Bachelder. Andy Tsang, a senior financial analyst with the firm, assisted in the preparation of this post. Related research from the Program on Corporate Governance includes The Growth of Executive Pay by Lucian Bebchuk and Yaniv Grinstein; The CEO Pay Slice by Lucian Bebchuk, Martijn Cremers and Urs Peyer (discussed on the Forum here); and Paying for Long-Term Performance by Lucian Bebchuk and Jesse Fried (discussed on the Forum here).
One of the methodologies used to assess the reasonableness of CEO pay is a comparison of the growth rate in CEO pay with the company’s total shareholder return (TSR) over a period of time. TSR generally represents (a) the change in stock price of the company over the period of time being measured plus dividends paid during such period divided by (b) the stock price at the beginning of the period. In 2015 the SEC proposed a new rule that would require each issuer to disclose in its proxy statements over a period of five years (initially, over three years) (a) the levels of CEO pay (as well as that of the other NEOs) and (b) the TSR of the issuer (as well as the TSR of a peer group of companies). See Pay Versus Performance, SEC Release No. 34-74835; File No. S7-07-15 (April 29, 2015), 80 Fed. Reg. 26329 (May 7, 2015).
Today’s column takes a look at the growth rate of CEO pay and TSR over the five-year period 2014-2018 for the following groups: (i) the S&P 500 companies and (ii) large companies in three industries: commercial banking, retail sales and computer software.
Following is a chart, Chart A, showing the growth rate of CEO pay and TSR for each of the groups as noted.
Chart A
|
| CEO Pay Growth (b) TSR (c)
S&P 500 Companies 23 percent 50 percent Industries Examined: Commercial Banking (d) 31 percent 40 percent Retail Sales (e) 1 percent 49 percent Computer Software (f) 59 percent 141 percent |
| (a) All figures shown for the three industries represent medians for the 10 companies included as to each industry (see notes (d)-(f) below). For companies with a fiscal year other than a calendar year we used the fiscal year ending within six months of the end of the calendar year. (For each such case, the fiscal year chosen was the fiscal year ending closest to the end of the calendar year. For example, if a company had a fiscal year ending August 31 that company would be grouped with calendar companies whose calendar year ended the following December 31. On the other hand, if the fiscal year ended March 31, it would be grouped with calendar year companies whose calendar year ended in the preceding December 31.)
(b) CEO pay growth figures for the industries are based on CEO pay figures as reported in the Summary Compensation Table of proxy statements. CEO pay growth for the S&P 500 companies represents the change in the median CEO pay for the S&P 500 companies in 2013 (taken from Equilar’s “2014 CEO Pay Strategies Report”) and the median CEO pay for the S&P 500 companies in 2018 (taken from the Wall Street Journal’s article “The WSJ CEO Pay Ranking: An analysis of 2018 compensation for S&P 500 leaders” (May 16, 2019)). (c) TSR figures for companies in the three industries examined are based on annual “total return” data provided by Morningstar. TSR for the S&P 500 companies represents the total return for the S&P 500 Index and is based on annual “total return” data provided by SlickCharts. (d) The statistics for the commercial banking industry are based on the following 10 companies: JPMorgan Chase & Co., Bank of America Corporation, Wells Fargo & Company, Citigroup, U.S. Bancorp, The PNC Financial Services Group, The Bank of New York Mellon Corporation, Capital One Financial Corporation, BB&T Corporation and SunTrust Banks. (e) The statistics for the retail sales industry are based on the following 10 companies: The Home Depot, Costco Wholesale Corporation, Lowe’s Companies, CVS Heath Corporation, TJX Companies, Target Corporation, Walgreens Boots Alliance, The Kroger Co., Best Buy Co., and Macy’s. (f) The statistics for the computer software industry are based on the following 10 companies: Adobe, Salesforce.com, Intuit, VMware, Autodesk, Synopsys, Cadence Design Systems, Symantec Corporation, Citrix Systems and PTC. |
Chart A shows that the growth rate of CEO pay for the five-year period 2014-2018 trails the TSR for that period. The five-year growth rate in CEO pay for the S&P 500 companies is 23 percent compared with the five-year TSR for the S&P 500 companies of 50 percent. In each of the three industries examined CEO pay growth likewise trails TSR for the five-year period 2014-2018.
Examining the Alignment of CEO Pay Growth and TSR Performance
We examined the alignment (correlation) of CEO pay growth and TSR during the five-year period 2014-2018 for each of the 10 companies in each of the three industries. We did this as follows:
First, we ranked CEO pay growth over the five-year period for each of the 10 companies in each of the three industries. (A “1” represented the lowest growth and a “10” represented the highest growth.)
Second, we ranked TSR over the five-year period for each of the 10 companies in each of the three industries. (Again, ranking was on a scale of “1” (the lowest TSR) to “10” (highest TSR).)
Third, and last, for each of the 10 companies in each industry, we compared its ranking (1 to 10) in CEO pay growth over the five-year period to its ranking (1 to 10) in TSR over the five-year period.
After the third step, we calculated the difference for each company between its ranking in the industry for the five-year period for (i) CEO pay growth and (ii) TSR (in each case, a number between 1 and 10).
To illustrate, if a company’s ranking in the industry was number 4 in CEO pay growth and number 4 in TSR there would be “perfect” correlation between that company’s CEO pay growth and its TSR relative to the other nine companies in the industry. On the other hand, if the company in question was number 2 in CEO pay growth and number 9 in TSR, a difference of 7, there would be poor alignment. (The same conclusion as to poor alignment would apply if the reverse occurred: a ranking of number 9 in CEO pay growth and a ranking of number 2 in TSR.)
Following is a chart, Chart B, comparing the CEO pay growth rankings and TSR rankings, as discussed, for the 10 companies in each of the three industries. As noted in the chart, we defined good alignment as a difference of 2 “points” or less between the ranking of a company in its industry in CEO pay growth and its ranking in TSR.
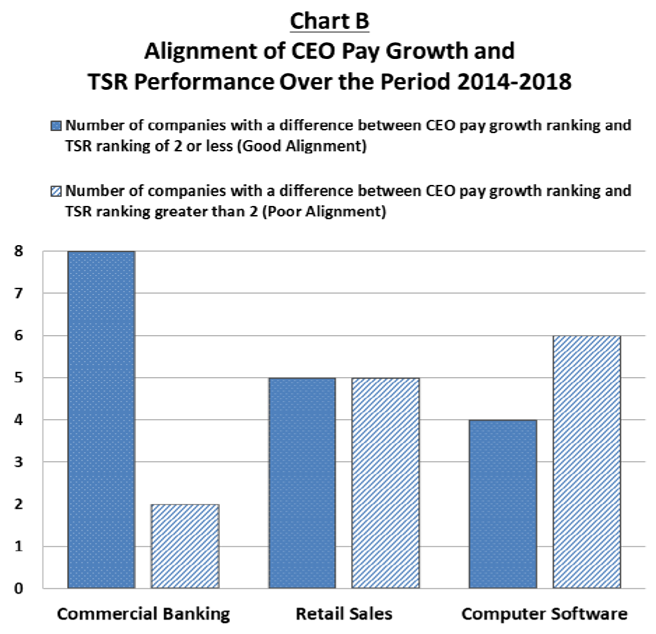
Chart B shows that, for the companies examined in the commercial banking industry, 80 percent (eight out of 10) have a good alignment (as we defined it) of CEO pay growth and TSR performance, compared to 50 percent and 40 percent for the retail sales industry and computer software industry, respectively.
There are numerous factors that contribute to the alignment of CEO pay growth with TSR performance and numerous factors that can cause misalignment. Factors that contribute to the alignment of CEO pay growth with TSR performance are as follows:
- In making CEO pay decisions each company (meaning the Board of Directors and/or the Compensation Committee of the Board) takes a look at that company’s pay and performance and compares that pay and performance with the pay and performance of companies it considers “peer” companies. In the process of making those comparisons the company necessarily makes its decision as to the CEO’s pay in the context of TSR performance (as well as other measures of company performance including operating performance).
- Employers (again, meaning Boards and/or Compensation Committees) have available to them data showing what peer companies are paying and how those companies are performing relative to their own company.
- In addressing the pay of its CEO a company must take into account the competitive market for CEO talent which, in most cases, reflects the relative performance of the companies in that market. (The meaningfulness of comparing CEO pay among companies will be lessened to the extent the companies in question are in different industries.)
In contrast to factors contributing to alignment as just noted, there are numerous factors that work against the alignment of CEO pay growth with TSR performance.
- A new CEO may have been hired during the time period being examined (g., the most recent five years). The new CEO’s compensation likely will not represent the same change in pay that would have applied to a CEO continuing in the position. Different factors are taken into account with a new CEO including the “price” it takes, in many cases, to get the CEO candidate to leave his or her current employer and join the company in question.
- The performance of a CEO during the time period being examined may not yet have fully impacted the TSR for that period. (The impact of the CEO’s service (positive or negative) may not be felt for some time—in some cases years—after the CEO has stepped down as CEO.)
- During the time period being examined the CEO may receive significantly more (or significantly less) pay, on an annualized basis, than he received (i) in the “base year” or (ii) in the last year of the period. In fact, these are the only two years being compared in most commentary on growth in CEO pay over a particular time period.
- The CEO may have received awards before the beginning of the time period being examined that do not reflect the performance, as it turns out, for that period.
- A CEO already may have a significant equity interest in the company (g., a family inheritance or founder equity). Does such an executive need to have additional equity to be sufficiently motivated to perform well?
- TSR may be influenced by factors outside the control of the CEO (and hence not reflected in the compensation of the CEO during the period in question).
Summary
- CEO pay growth, at most public companies, is not closely correlated with TSR performance. (The rule proposed by the SEC in 2015 in SEC Release No. 34- 74835, noted at the outset of the post, had not been adopted as of the date of the post’s publication.)
- Over the 2014-2018 period, at S&P 500 companies and at the companies in the three industries examined, the median CEO pay growth trailed TSR performance (as shown in Chart A).
- CEO pay decisions at most public companies reflect a variety of facts and circumstances that go beyond TSR performance.