 Print
PrintAlexander “Sasha” Aganin is senior vice president at Cornerstone Research. This post is based on a report by Cornerstone Research and the Stanford Law School Securities Class Action Clearinghouse.
Executive Summary
For a third consecutive year, the number of new class action securities filings based on federal statutes remained above 400. Most notably, core filings surged to record levels. Market capitalization losses, as in 2018, surpassed $1 trillion.
Number and Size of Filings
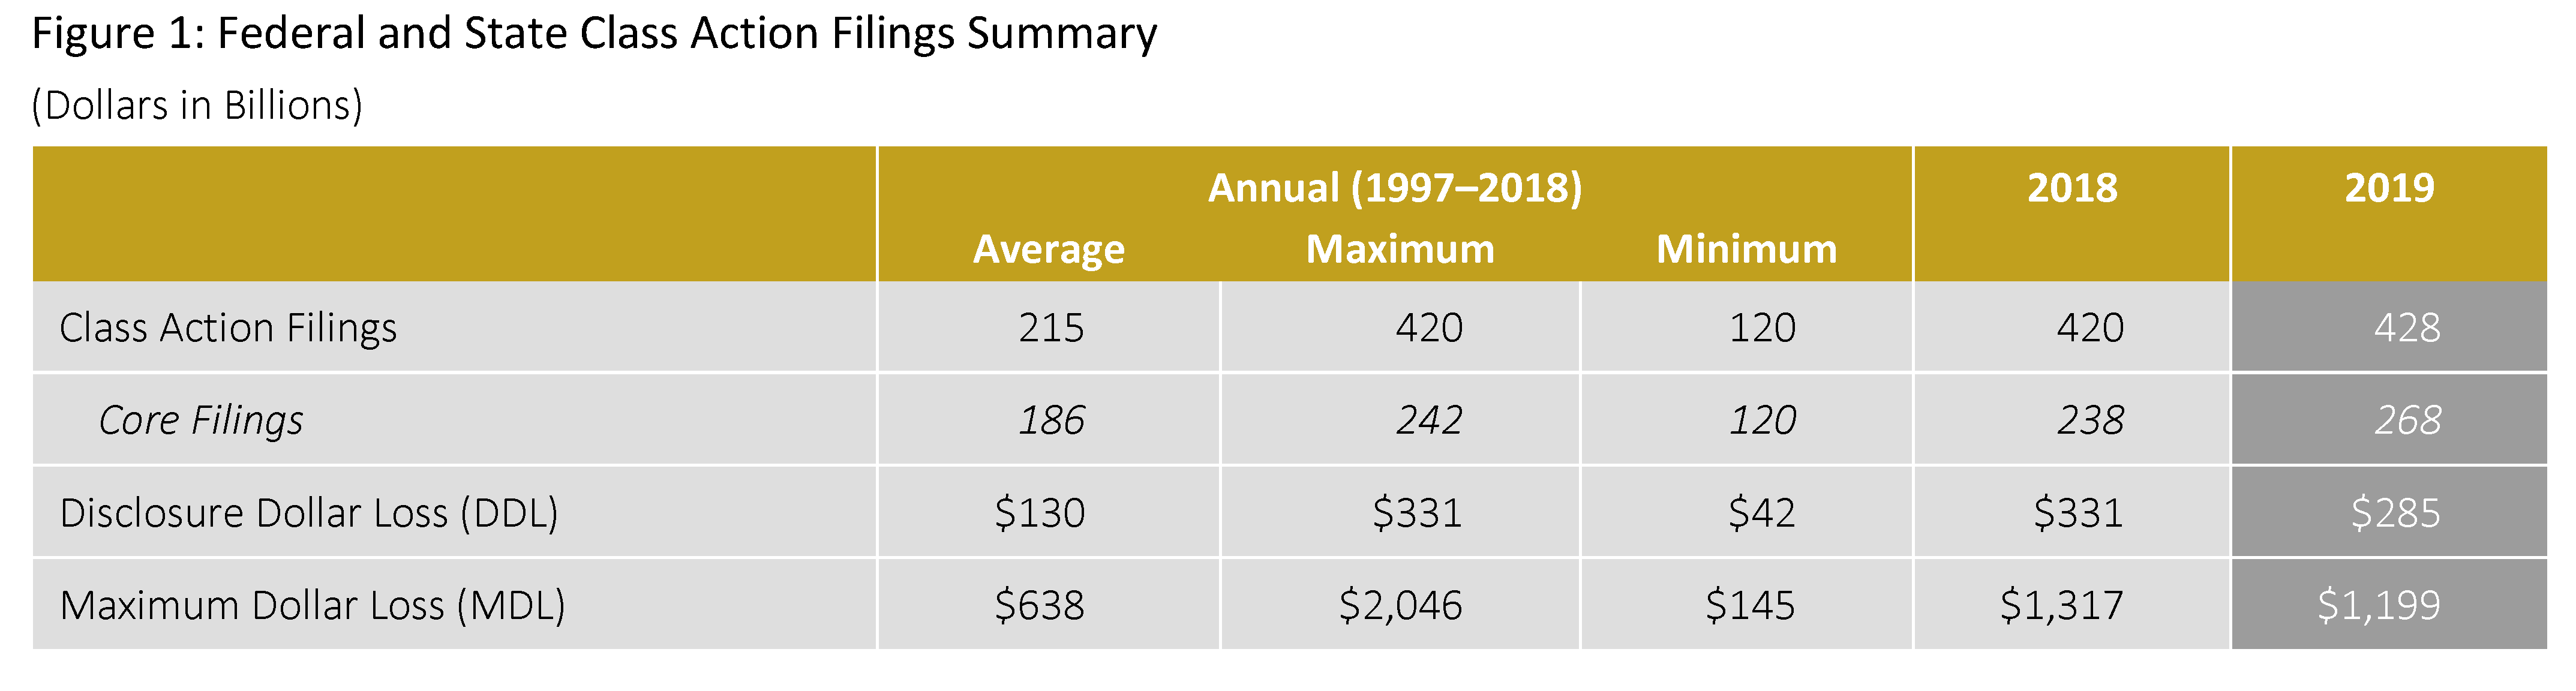
- Plaintiffs filed 428 new class action securities cases (filings) across federal and state courts in 2019, the most on record and nearly double the 1997–2018 average. “Core” filings—those excluding M&A filings—rose to the highest number on record.
- Federal and state court class actions alleging claims under the Securities Act of 1933 (1933 Act) helped push filing activity to record levels. The number of 1933 Act filings themselves reached unprecedented levels.
- Disclosure Dollar Loss (DDL) decreased by 14 percent to $285 billion in 2019.
- Maximum Dollar Loss (MDL) also fell by 9 percent to $1,199 billion.
- In 2019, eight mega filings in federal courts made up 52 percent of federal core DDL and 21 mega filings in federal courts made up 71 percent of federal core MDL. Both of these percentages track closely with historical averages. Filings with a DDL of at least $5 billion or an MDL of at least $10 billion are considered mega filings.
Other Measures of Filing Intensity
- In 2019, the likelihood of litigation involving a core filing for U.S. exchange-listed companies increased for a seventh consecutive year. This measure reached record levels because of both the heightened filing activity against public companies and an extended decline in the number of public companies over the last 15 years.
- One in about 14 S&P 500 companies (7.2 percent) was subject to litigation in federal courts in 2019. Companies in the Health Care sector were the most frequent targets of new core federal filings.
Key Trends in Federal Filings
Companies on U.S. exchanges were more likely to be sued in 2019 than in any previous year whether measured solely on core filings or on total filings. Core filings in federal courts (core federal filings) against non-U.S. issuers (i.e., companies headquartered outside the United States with securities trading on U.S. exchanges) also reached record levels.
U.S. Companies
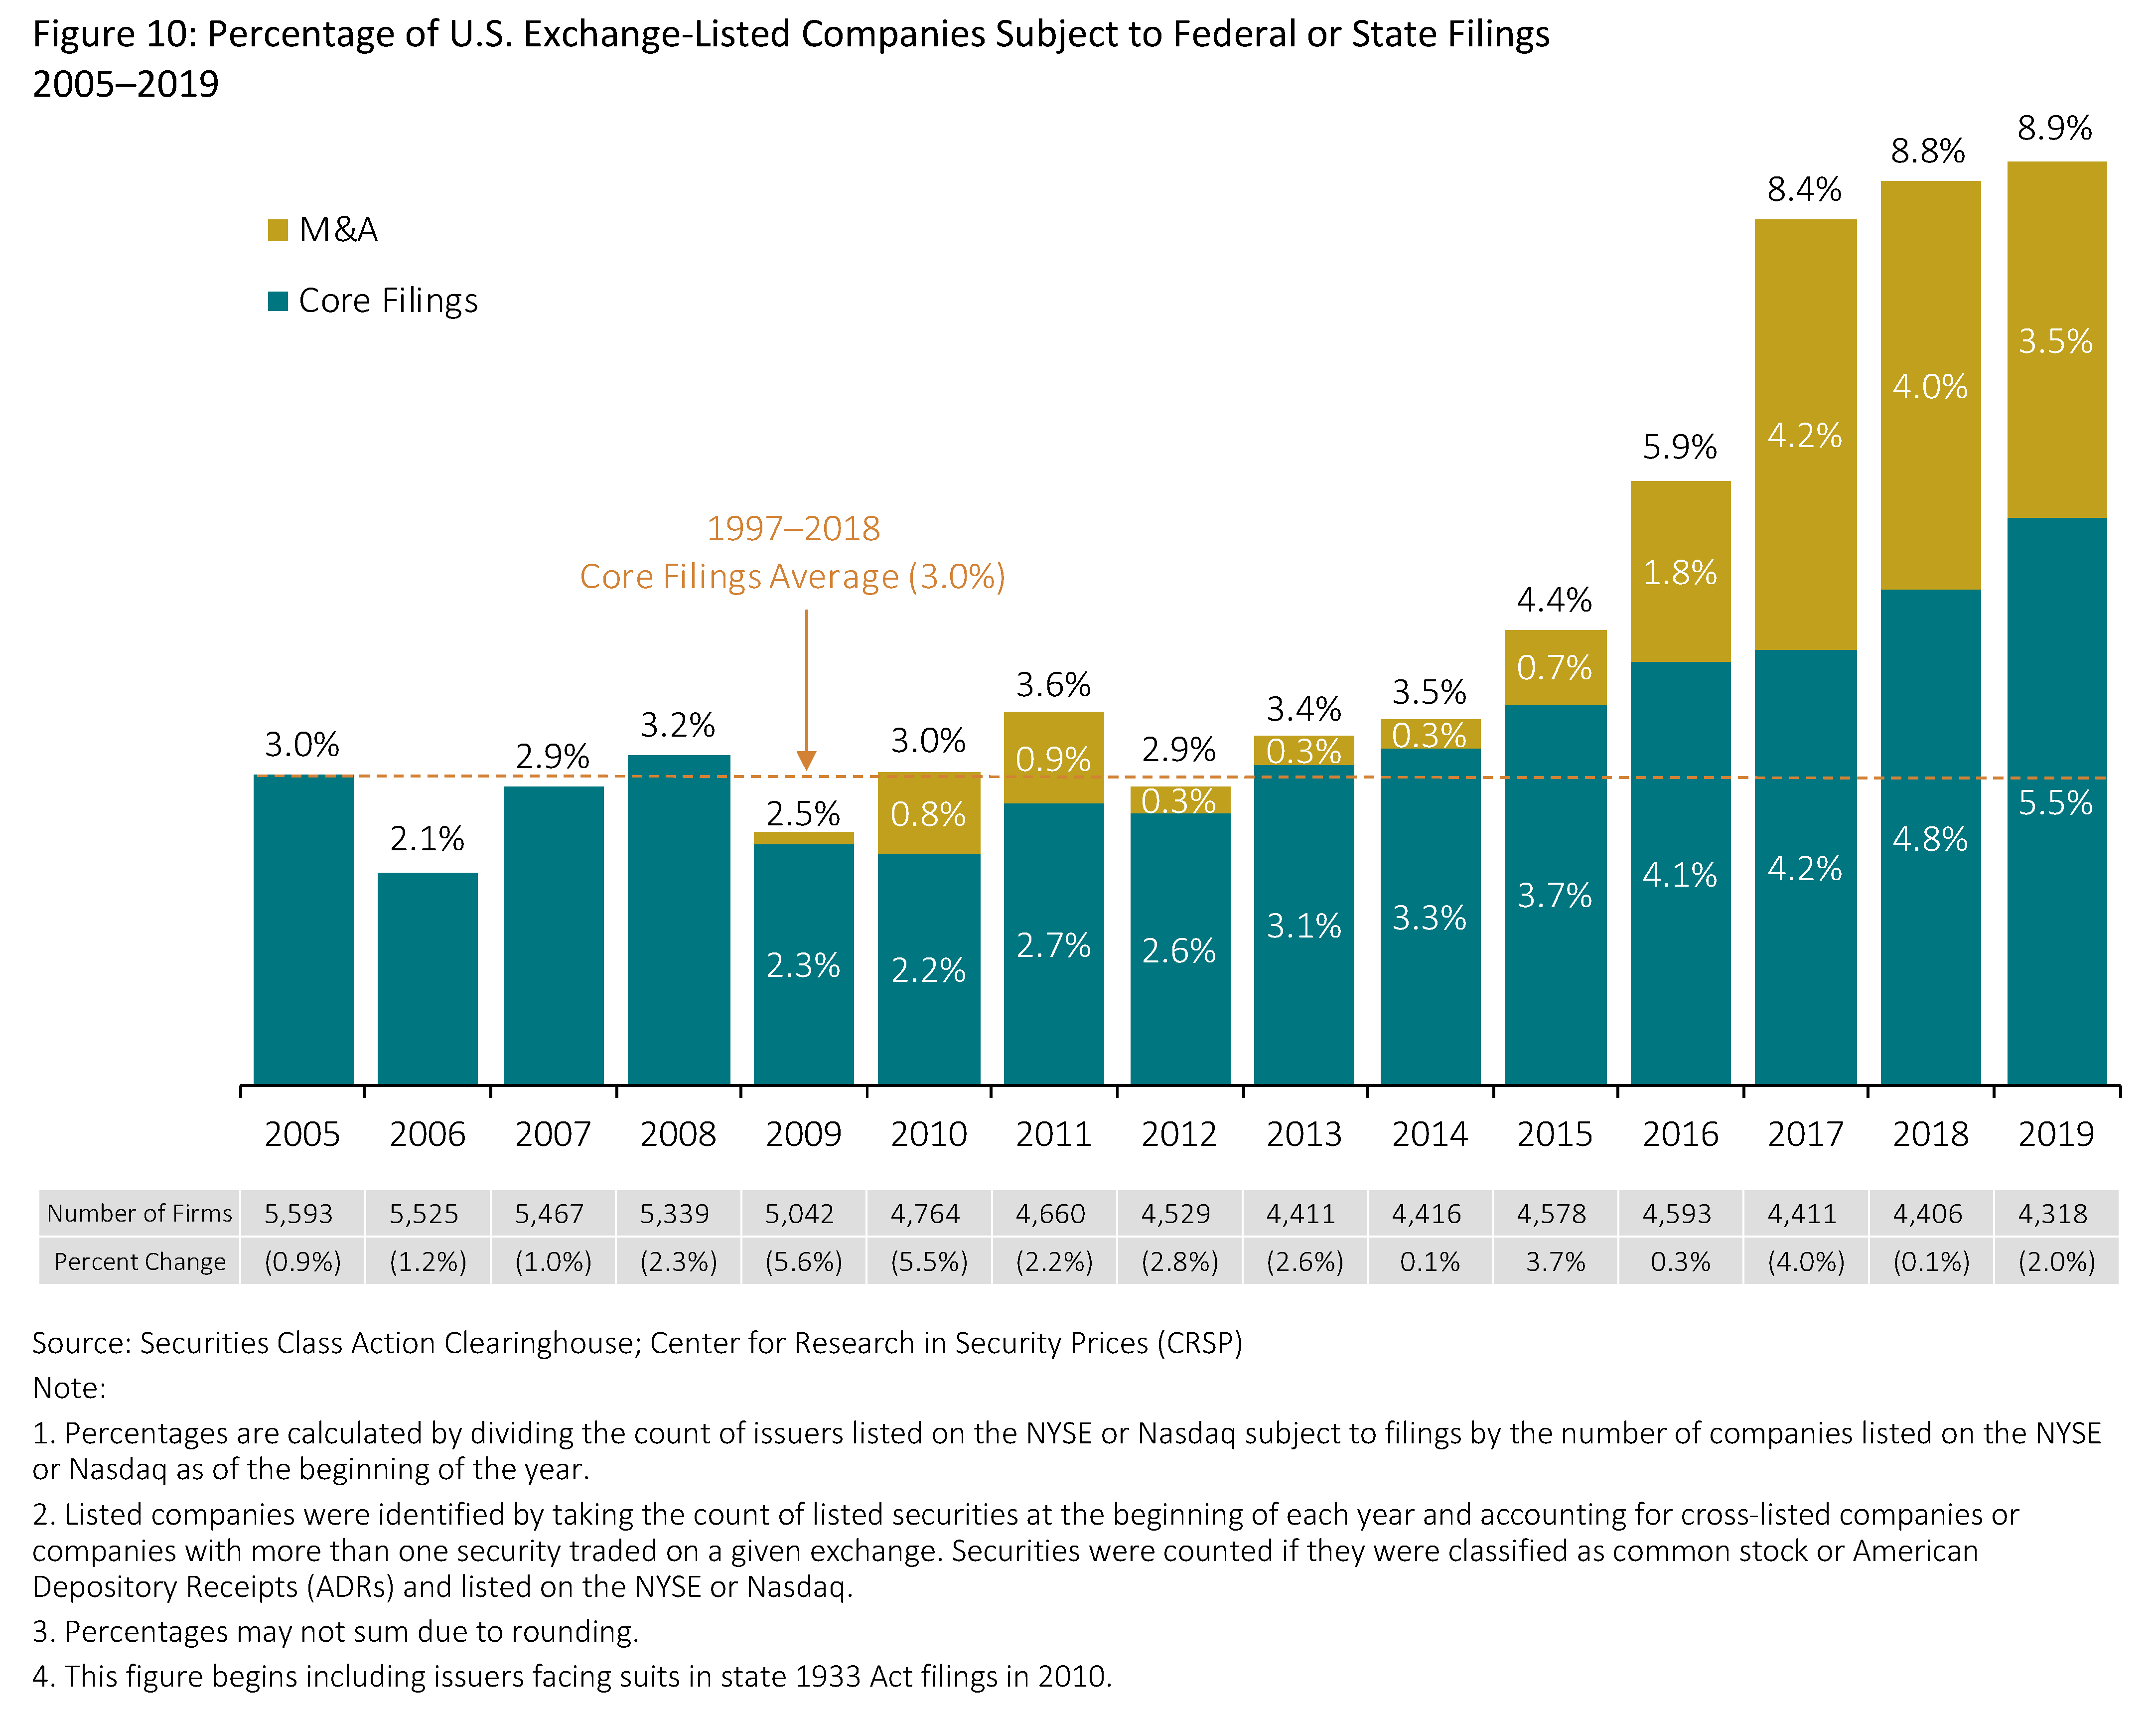
- In 2019, 5.5 percent of U.S. exchange-listed companies were the subject of core filings.
- Core federal filings against S&P 500 firms in 2019 occurred at a rate of 7.2 percent.
Non-U.S. Companies
- Core federal filings against non-U.S. companies rose to 57, the highest level on record.
- The likelihood of a core federal filing against a non-U.S. company increased from 4.8 percent in 2018 to 5.6 percent in 2019.
By Industry
- In 2019, 66 core federal filings were brought against companies in the Technology and Communications sectors combined, up 32 percent from 2018.
- Core federal filings in the Consumer Non-Cyclical sector jumped from 67 in 2018 to 88 in 2019. Within this sector, combined filings against biotechnology, pharmaceutical, and healthcare companies also increased.
By Circuit
- There were 103 and 52 core federal filings in the Second and Ninth Circuits, respectively. Second Circuit core federal filings were at historically high levels, 45 percent greater than 2018.
- Third Circuit filings remained at elevated levels with 28 in 2019 compared with the 1997–2018 historical average of 17.
M&A Filings
- Federal filings of merger-objection class actions—those involving M&A transactions with Section 14 claims but no Rule 10b-5, Section 11, or Section 12(2) claims—decreased again, from 182 in 2018 to 160 in 2019.
- M&A filings were concentrated in the Third Circuit. In 2019, 127 of the 160 M&A filings were in the Third Circuit, including 126 in Delaware federal court.
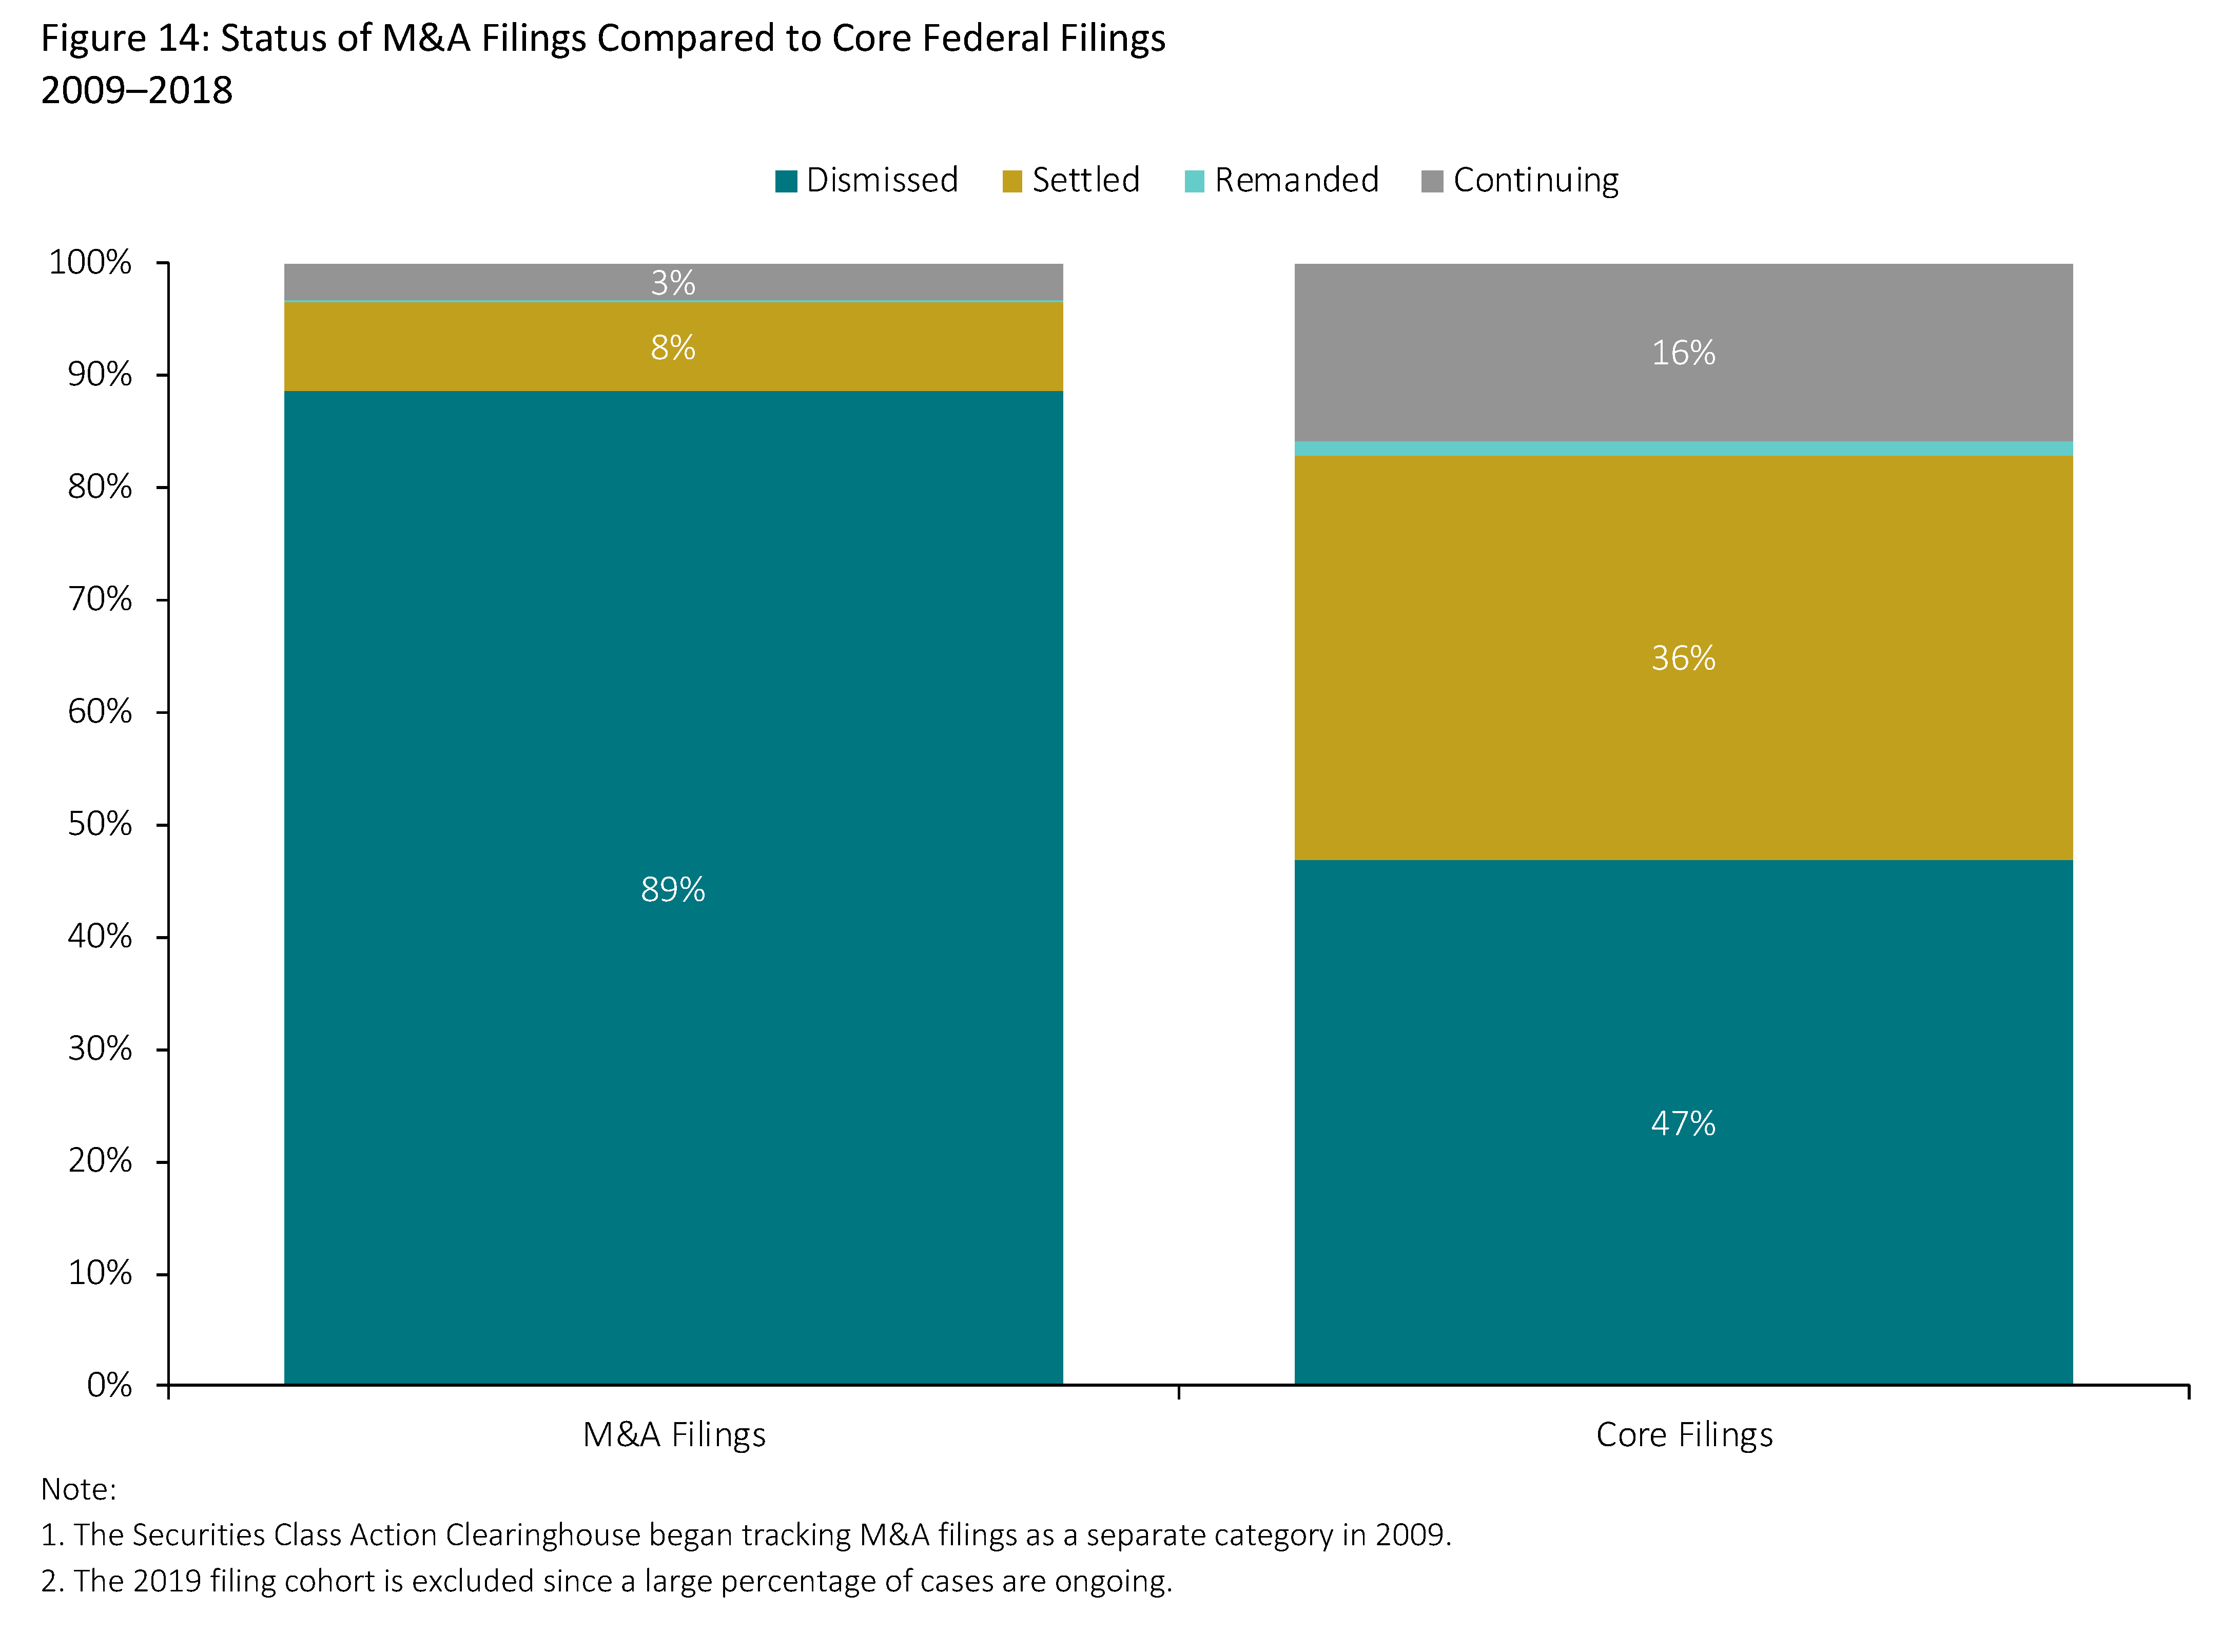
- M&A filings had a much higher rate of dismissal (89 percent) than core federal filings (47 percent) from 2009 to 2018.
Filings by Lead Plaintiff
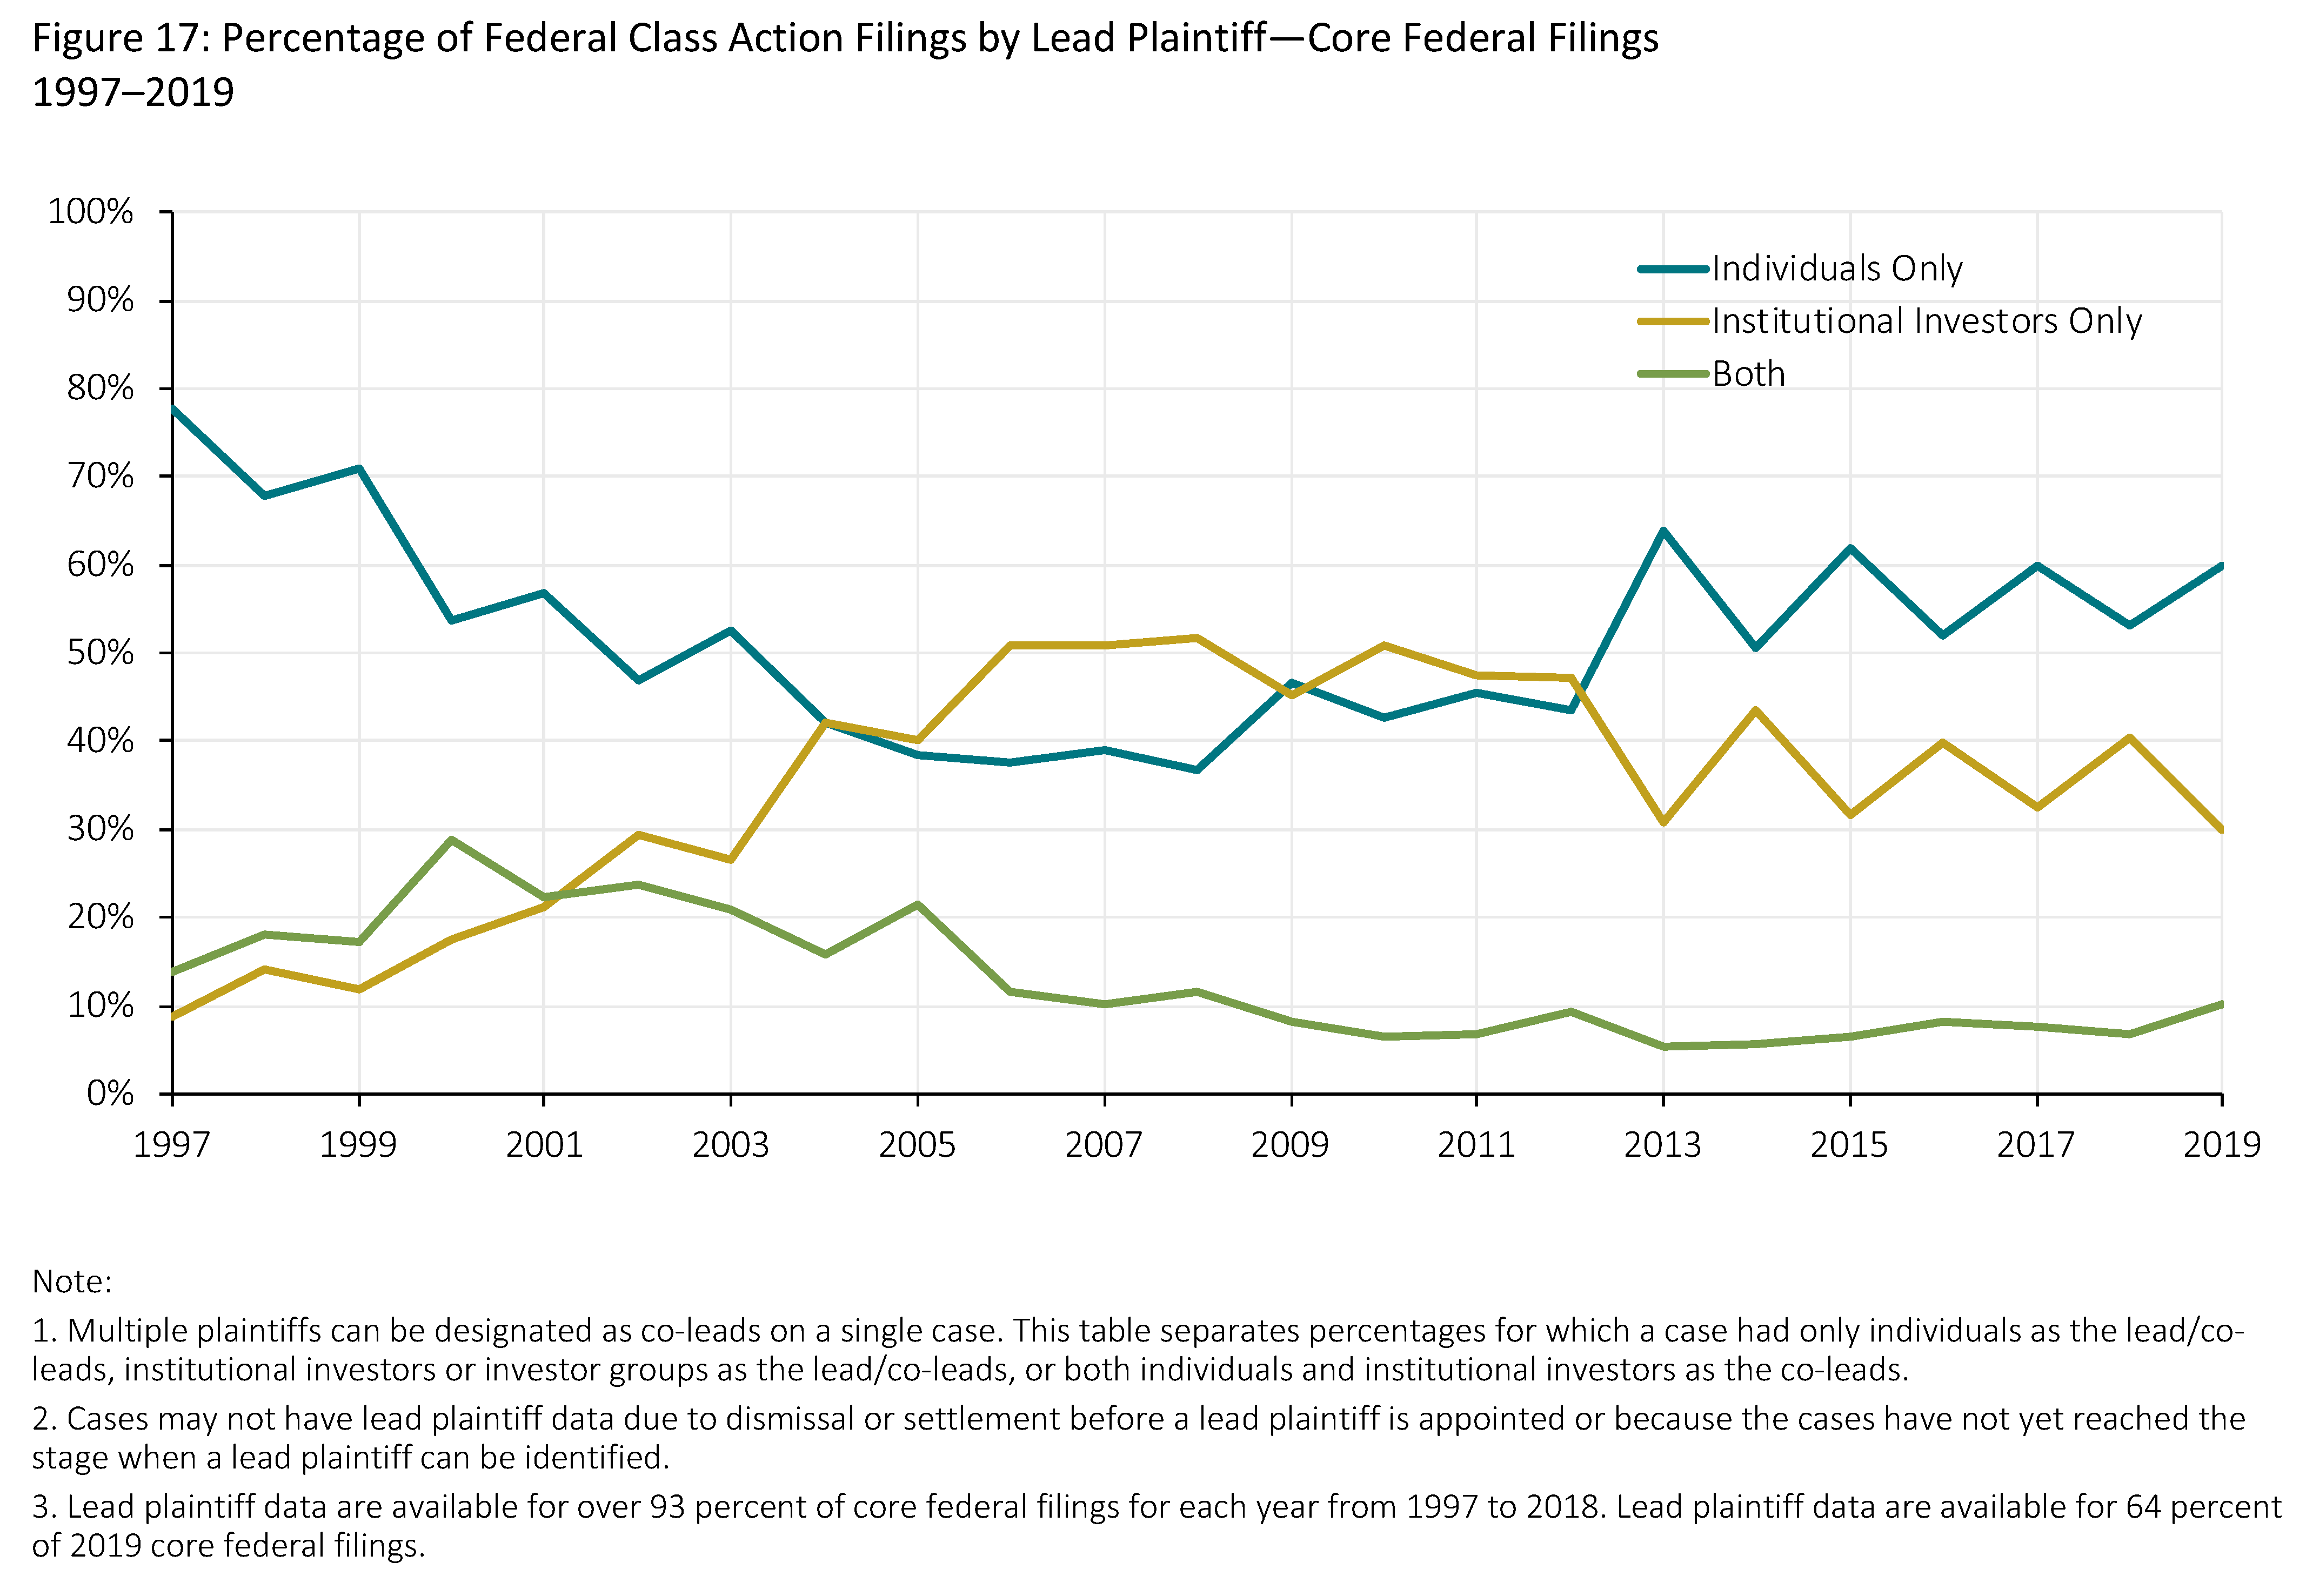
- For 2019 core federal filings, individuals were appointed lead plaintiff more often than institutional investors, a pattern that has persisted since 2013.
Appointment of Plaintiff Lead Counsel
- The growth in core federal filings over the last seven years has coincided with the activity of three plaintiff law firms that have increasingly been involved in securities class actions.
New Developments
- There has been an increased number of core filings involving companies in and related to the cannabis industry.
- The forum selection case, Sciabacucchi v. Salzberg, is currently before the Delaware Supreme Court.
Featured: Annual Rank of Filing Intensity
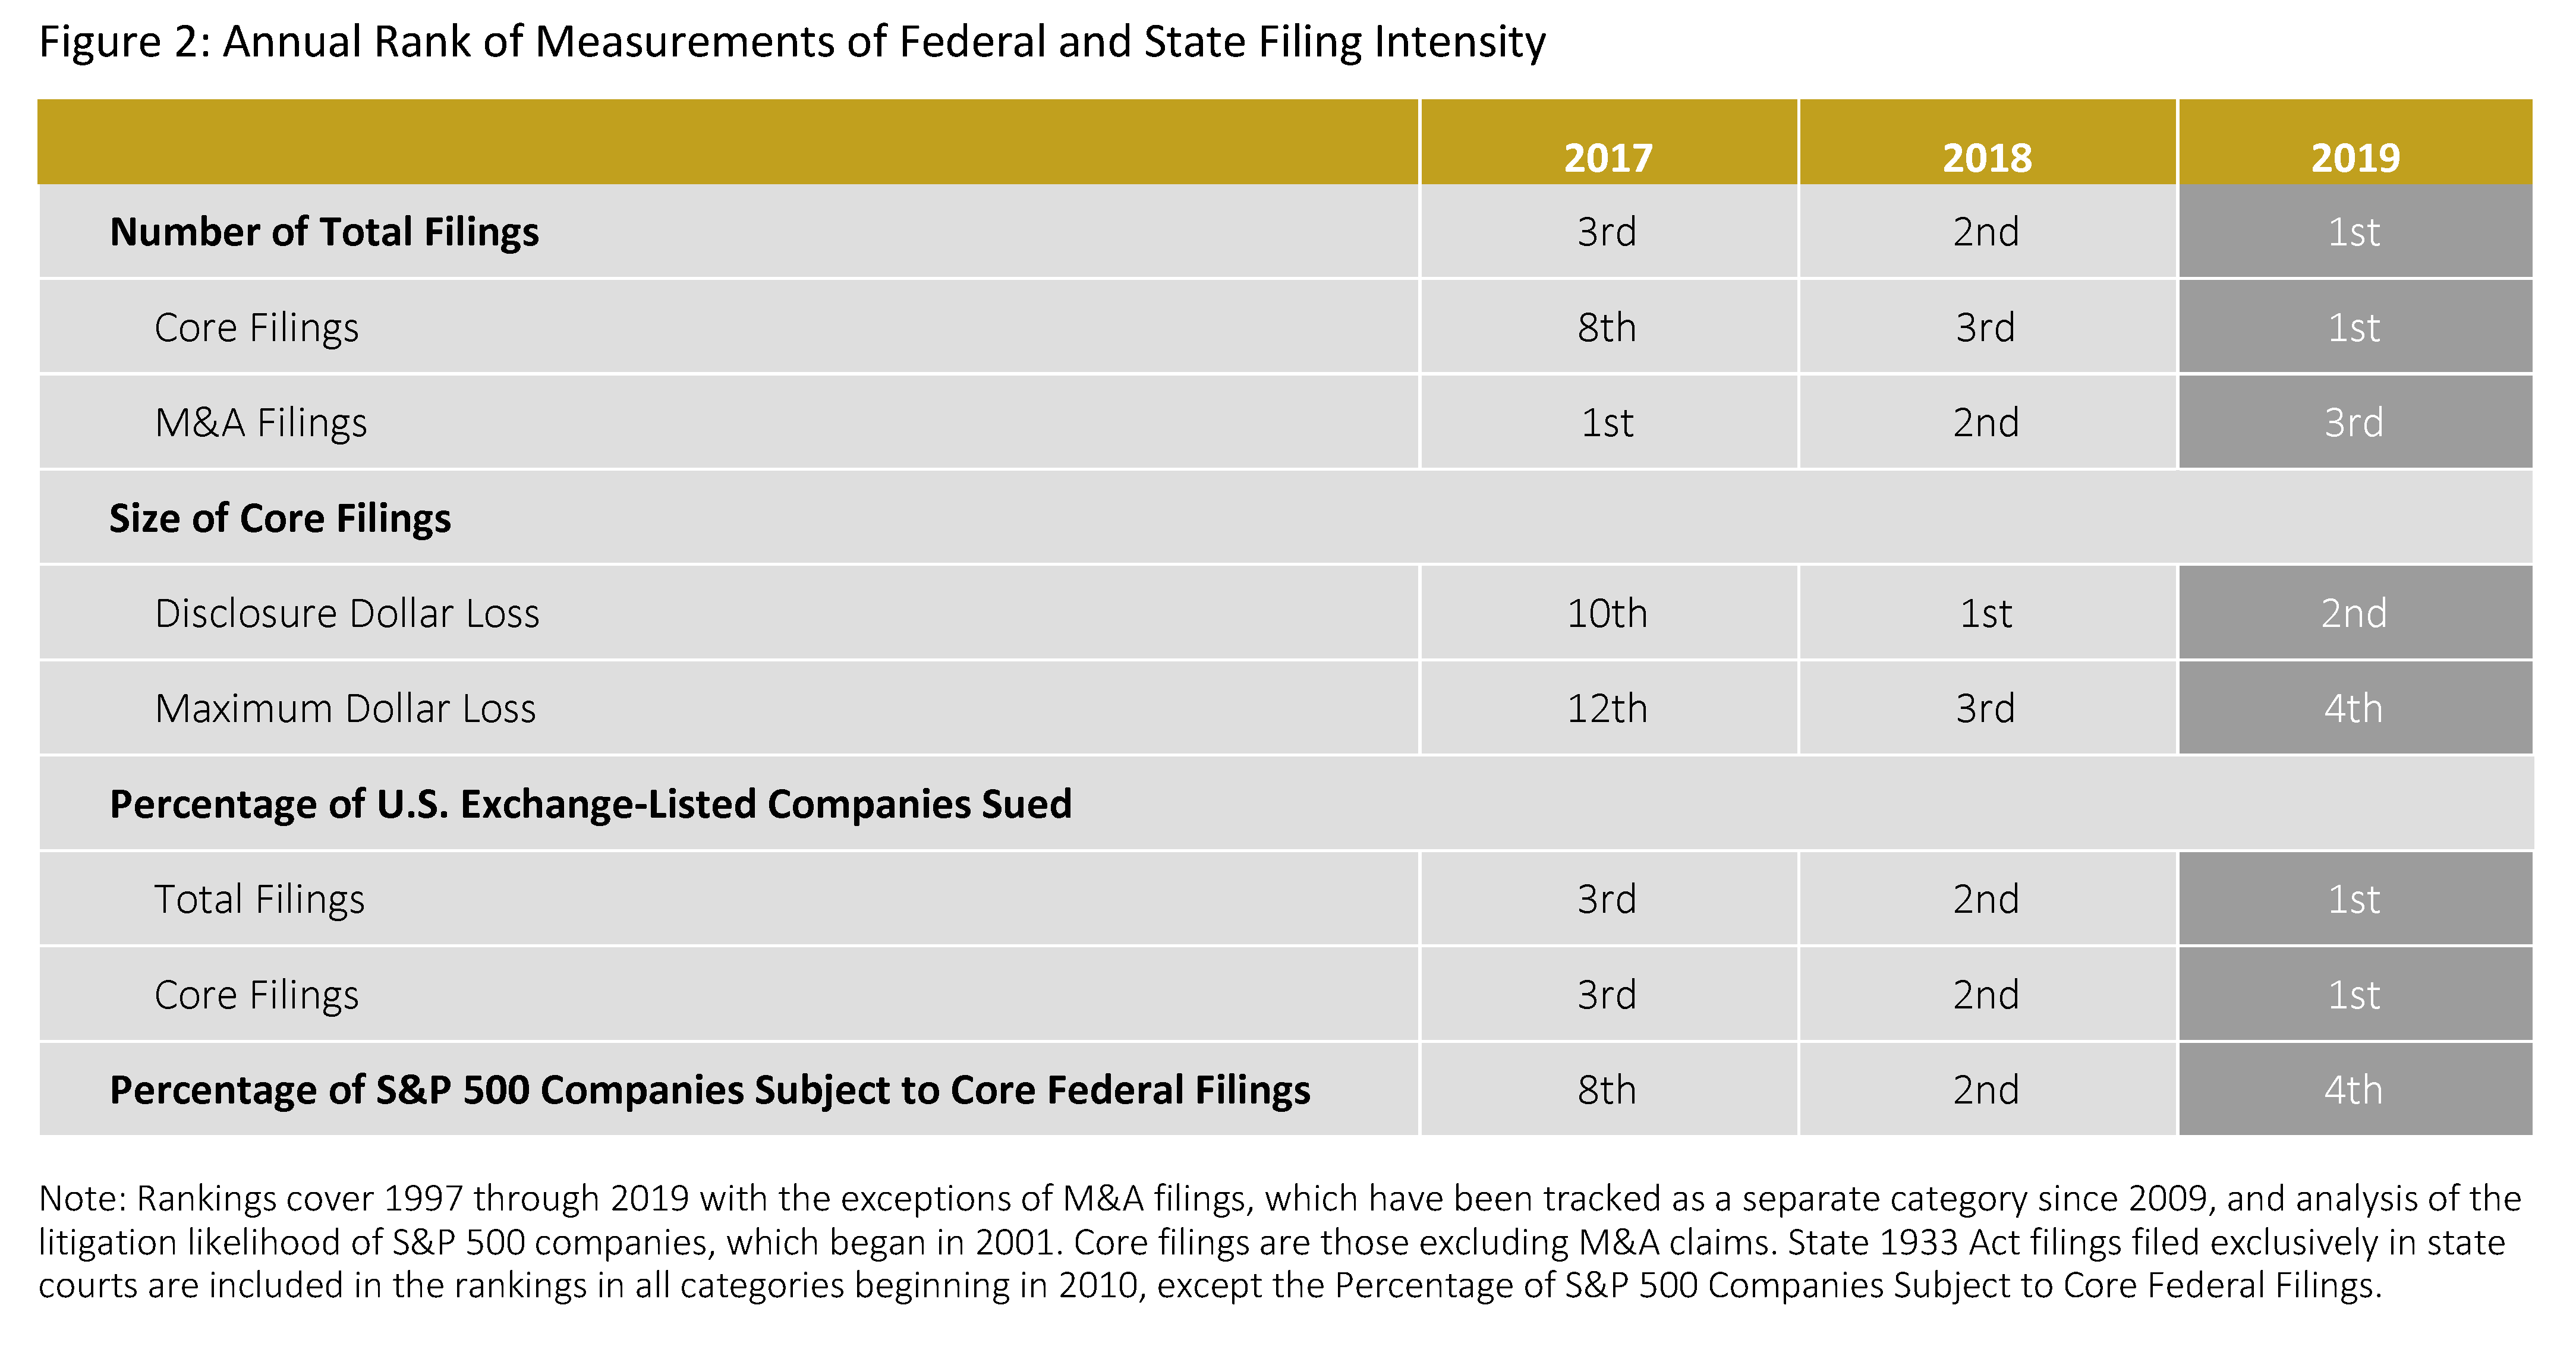
Filing activity in federal and state courts accelerated in 2019. Each of the last three years—2017 through 2019—has been more active than any previous year. More core filings in federal and state courts occurred in 2019 than in any other year. Unlike in earlier years with heightened levels of filings (e.g., at the time of the dot-com bust or the financial crisis), the current peaks have occurred despite a lack of financial market turbulence.
Core federal filings against S&P 500 companies occurred with slightly lower frequency than in 2018, but remained elevated compared with historical measures. Given the number of filings and the frequency of filings involving larger companies, historically large amounts of market capitalization losses (as measured by DDL and MDL) are being litigated.
Featured: State Court 1933 Act Filings
Securities class action filings with 1933 Act claims increased in
state courts in 2019 after the 2018 U.S. Supreme Court decision in Cyan Inc. v. Beaver County Employees Retirement Fund. This is one of the more meaningful trends in securities litigation in the last few years. In 2019, filings in state courts with 1933 Act claims exceeded those in federal courts.
- From 2010 through 2019, plaintiffs filed at least 159 1933 Act cases in state courts (state 1933 Act filings).
- The number of state 1933 Act filings in 2019 increased by 40 percent from 2018, while the total MDL of state 1933 Act filings rose by 78 percent.
- About 45 percent of all state 1933 Act filings in 2019 had a parallel action in federal court.
- While state 1933 Act filings exclusively filed in state courts decreased in California from 2018 to 2019, filings in both New York and other states rose substantially.

Number of Federal and State Filings
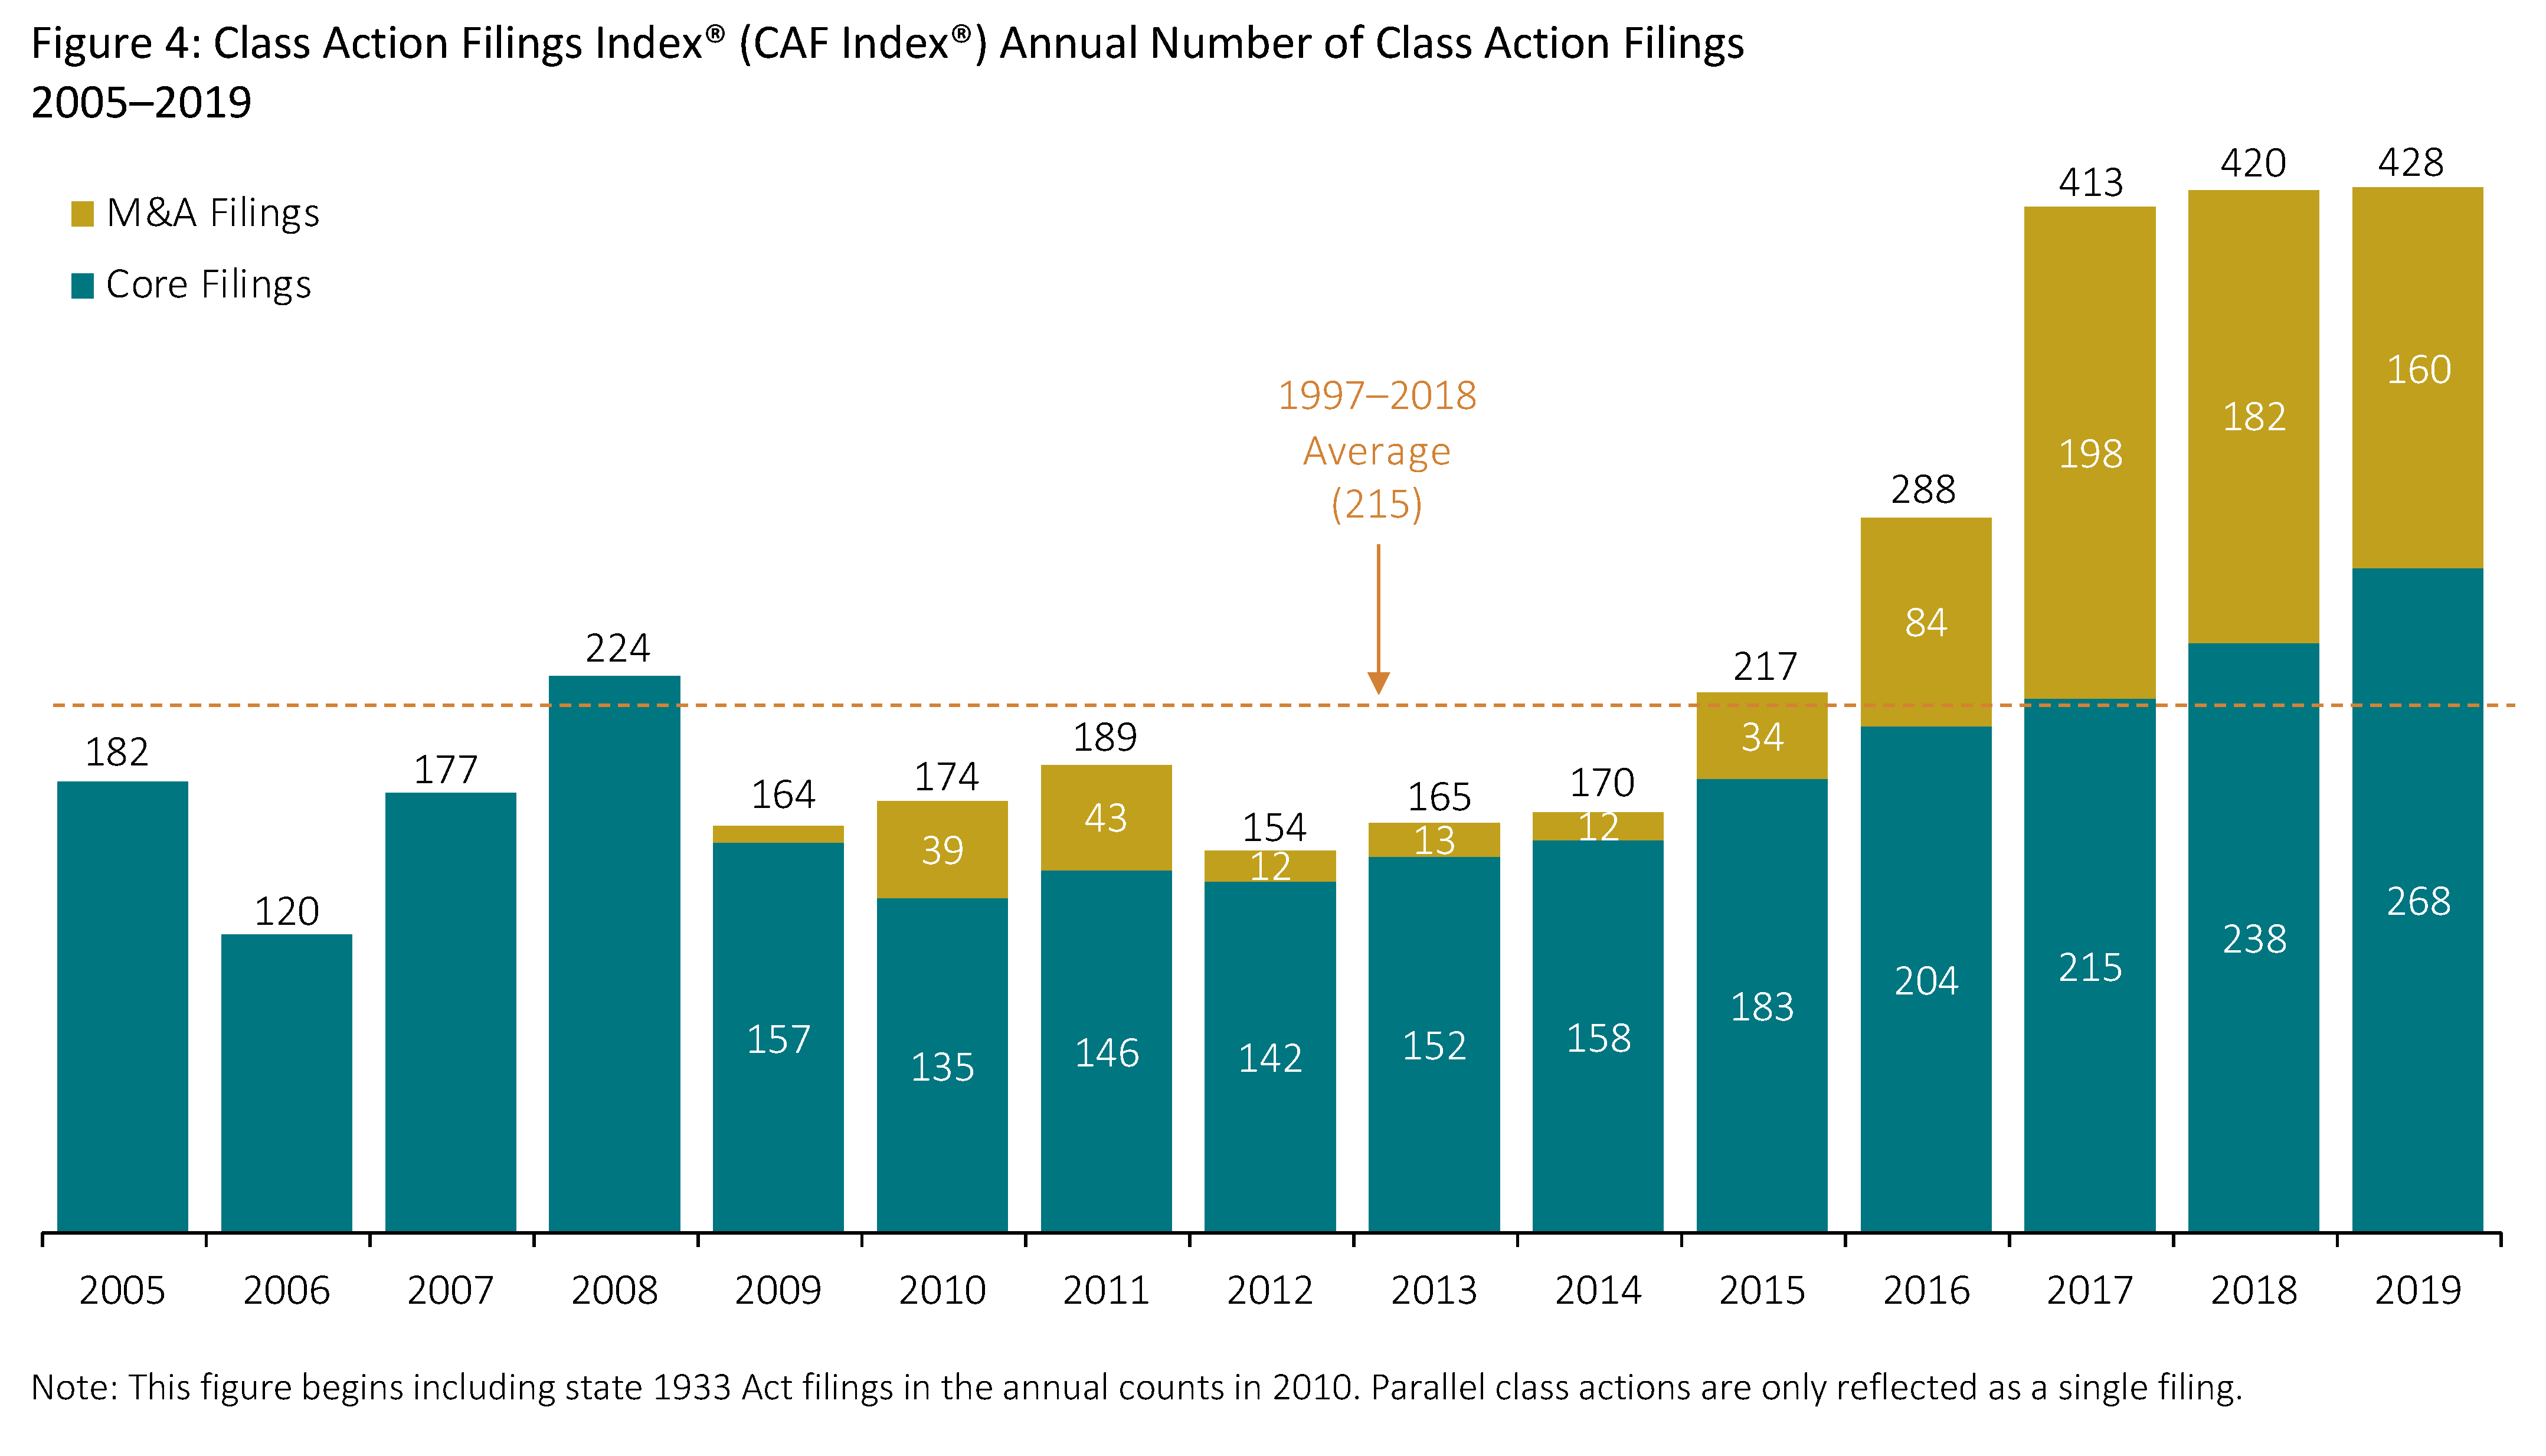
- Plaintiffs filed 428 new securities class actions across federal and state courts, the highest number on record and nearly double the 1997–2018 average.
- The 160 M&A filings in 2019 were the third-largest number since 2009 (when this report began separately identifying these filings).
- Core filings—those excluding M&A filings—were the highest on record, topping even 2008 when filings surged due to the volatility in U.S. and global financial markets. See Appendix 1 of the complete publication for litigation totals from 1997 to 2019.
- The growth in core federal filings over the last seven years has coincided with the activity of three plaintiff law firms that have increasingly been involved in securities class actions.
- There were just three initial coin offering (ICO)/cryptocurrency-related filings in 2019. Emerging as a new trend were filings against issuers involved in the cannabis industry—13 such federal filings occurred in 2019, up from six in 2018.
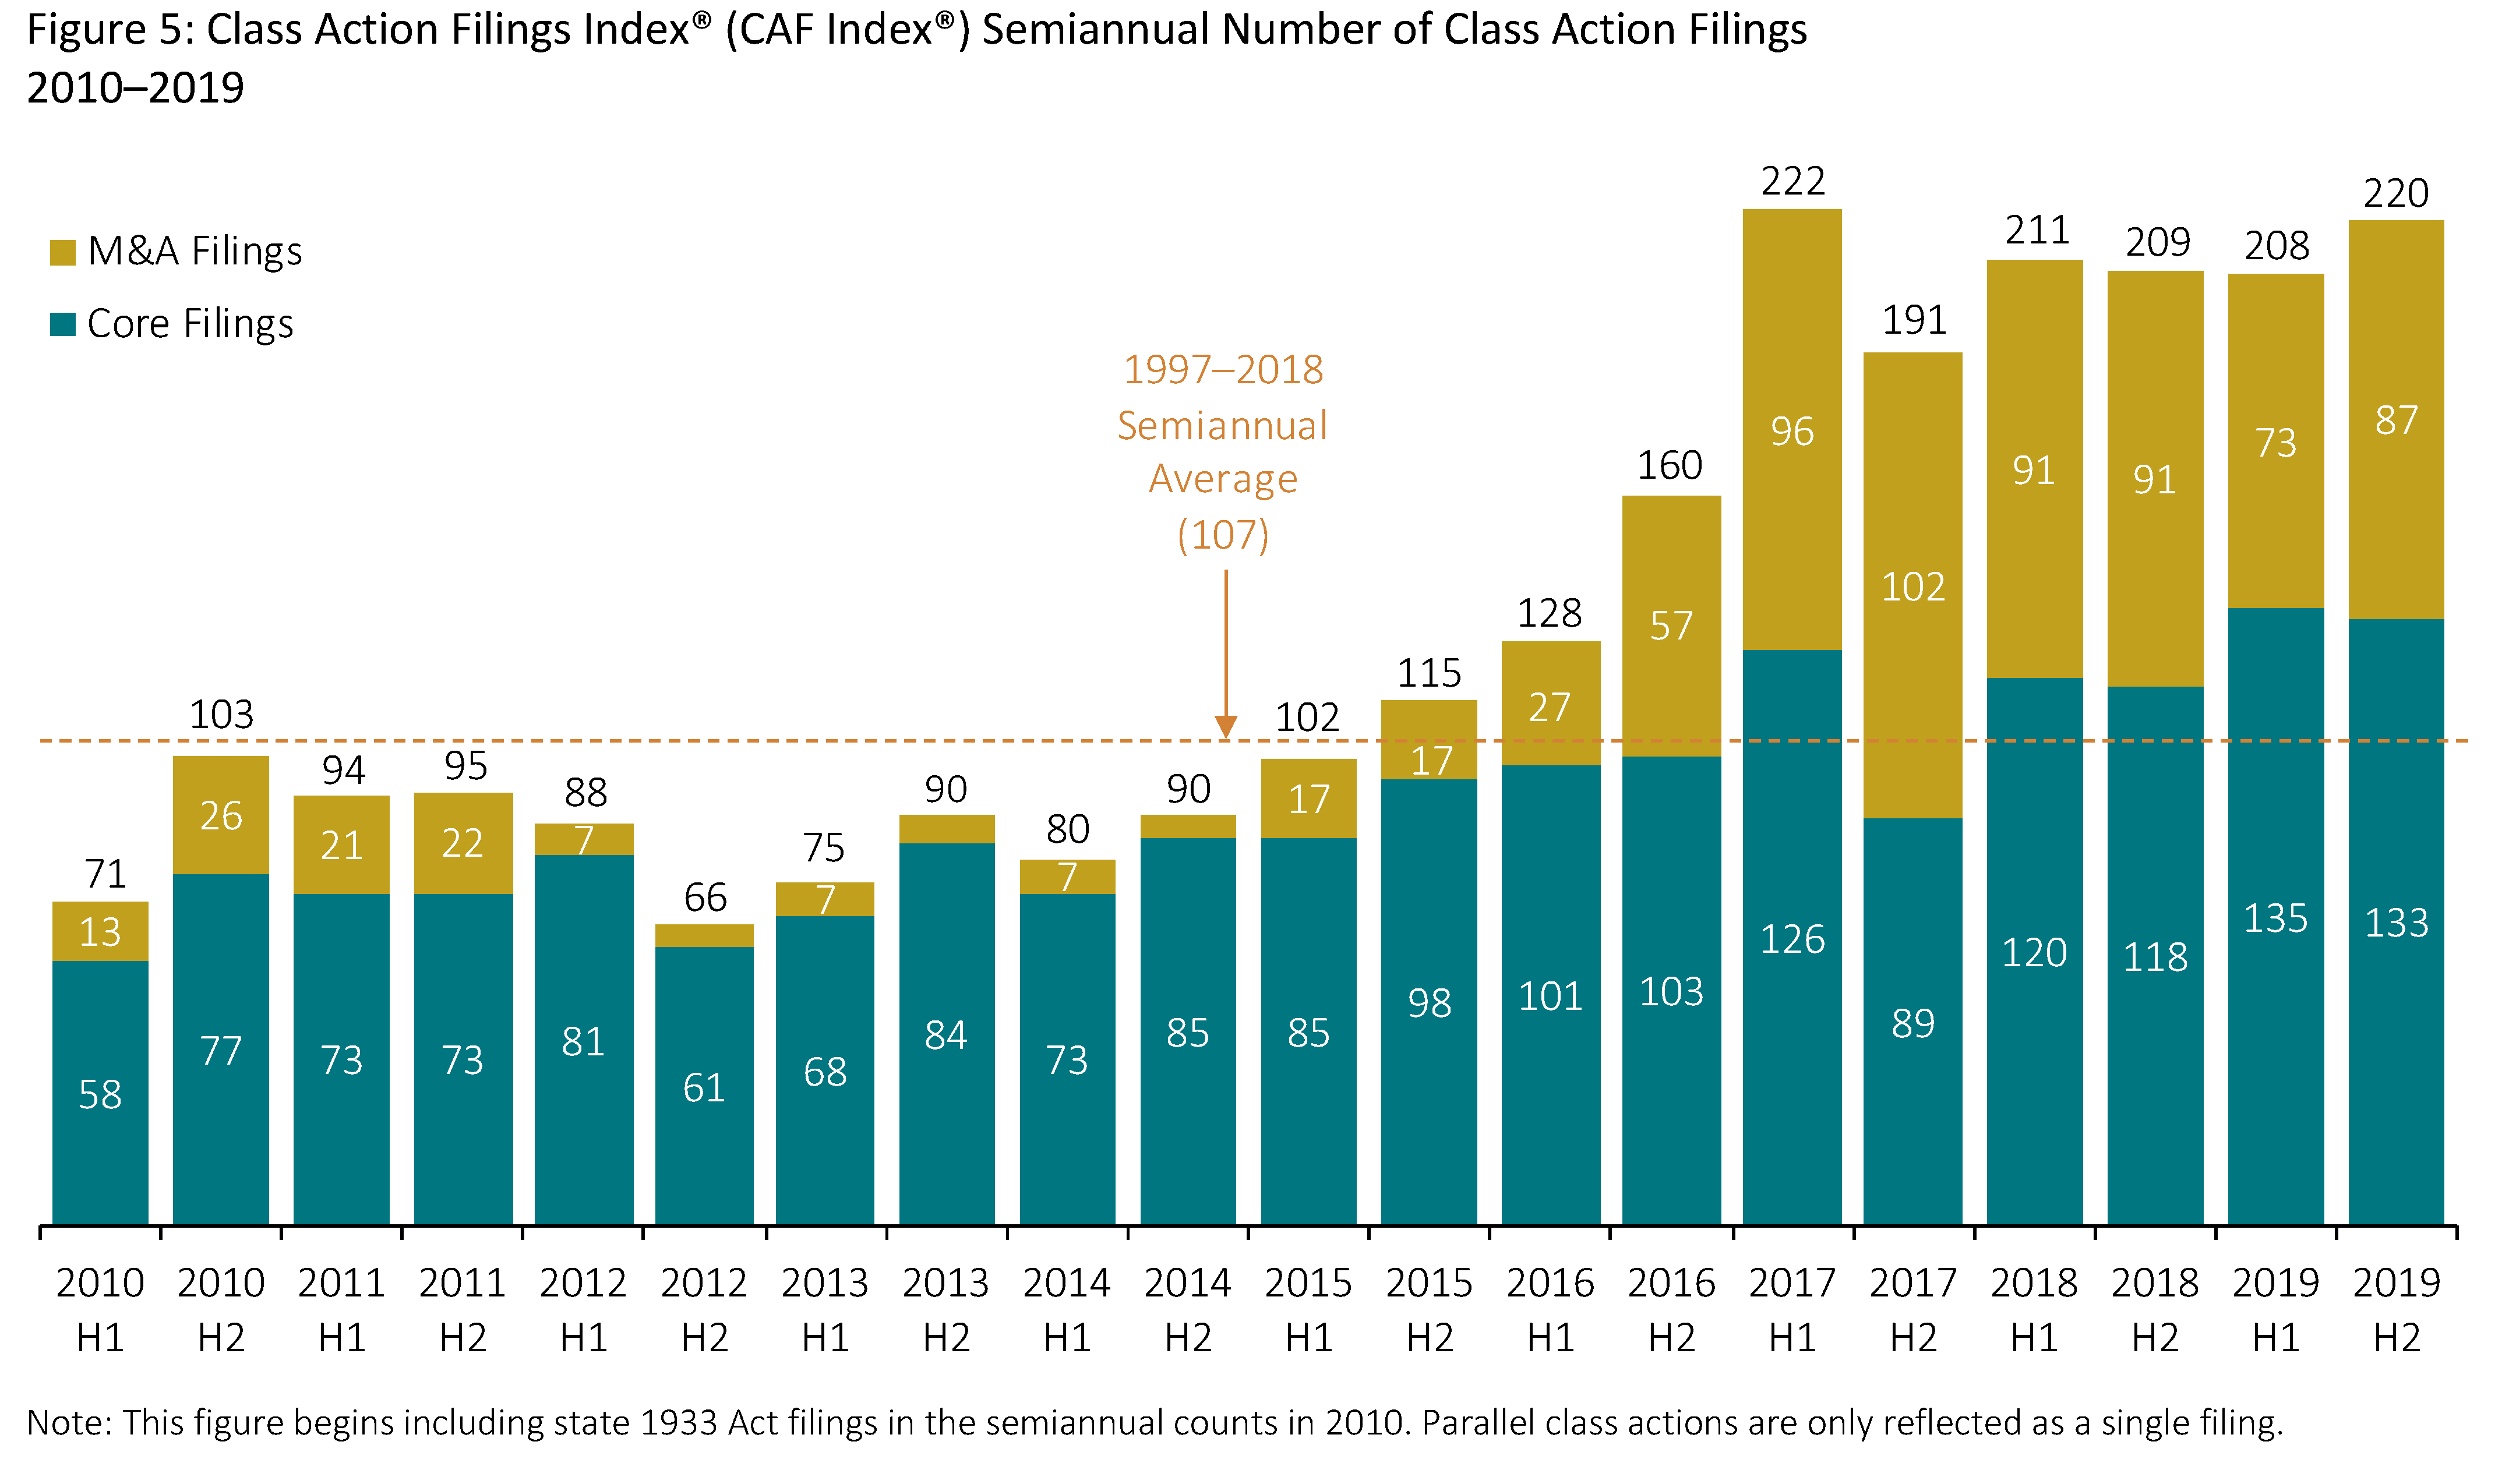
- The pace of core filings was essentially unchanged in
the second half of 2019, while the pace of M&A filings was higher in the second half of the year.
Classification of Federal Complaints
- Section 11 claims increased in federal courts even as filing activity continued to increase in state courts.
- Section 12(2) claims decreased from 10 percent of core federal filings in 2018 to 7 percent in 2019.
- For the third consecutive year, around one-fourth of core federal filings included allegations related to accounting violations.
- Allegations of announced internal control weaknesses increased from 7 percent of core federal filings to 10 percent.
- Underwriters were named as defendants in 11 percent of core federal filings, up from 8 percent in 2018. This increase is consistent with the higher numbers of Section 11 core federal filings.

U.S. Exchange-Listed Companies
The percentages below are calculated as the unique number of companies listed on the NYSE or Nasdaq subject to federal or state securities fraud class actions in a given year divided by the unique number of companies listed on the NYSE or Nasdaq.
- The likelihood that U.S. exchange-listed companies were subject to core filings increased for a seventh consecutive year, from 2.6 percent in 2012 to 5.5 percent in 2019.
- Approximately one in 18 companies listed on U.S. exchanges was the subject of a core filing in 2019. See Appendix 1 of the complete publication for litigation likelihood from 1997 to 2019.
- M&A filings decreased in 2019 to 3.5 percent, down from 4.0 percent in 2018.
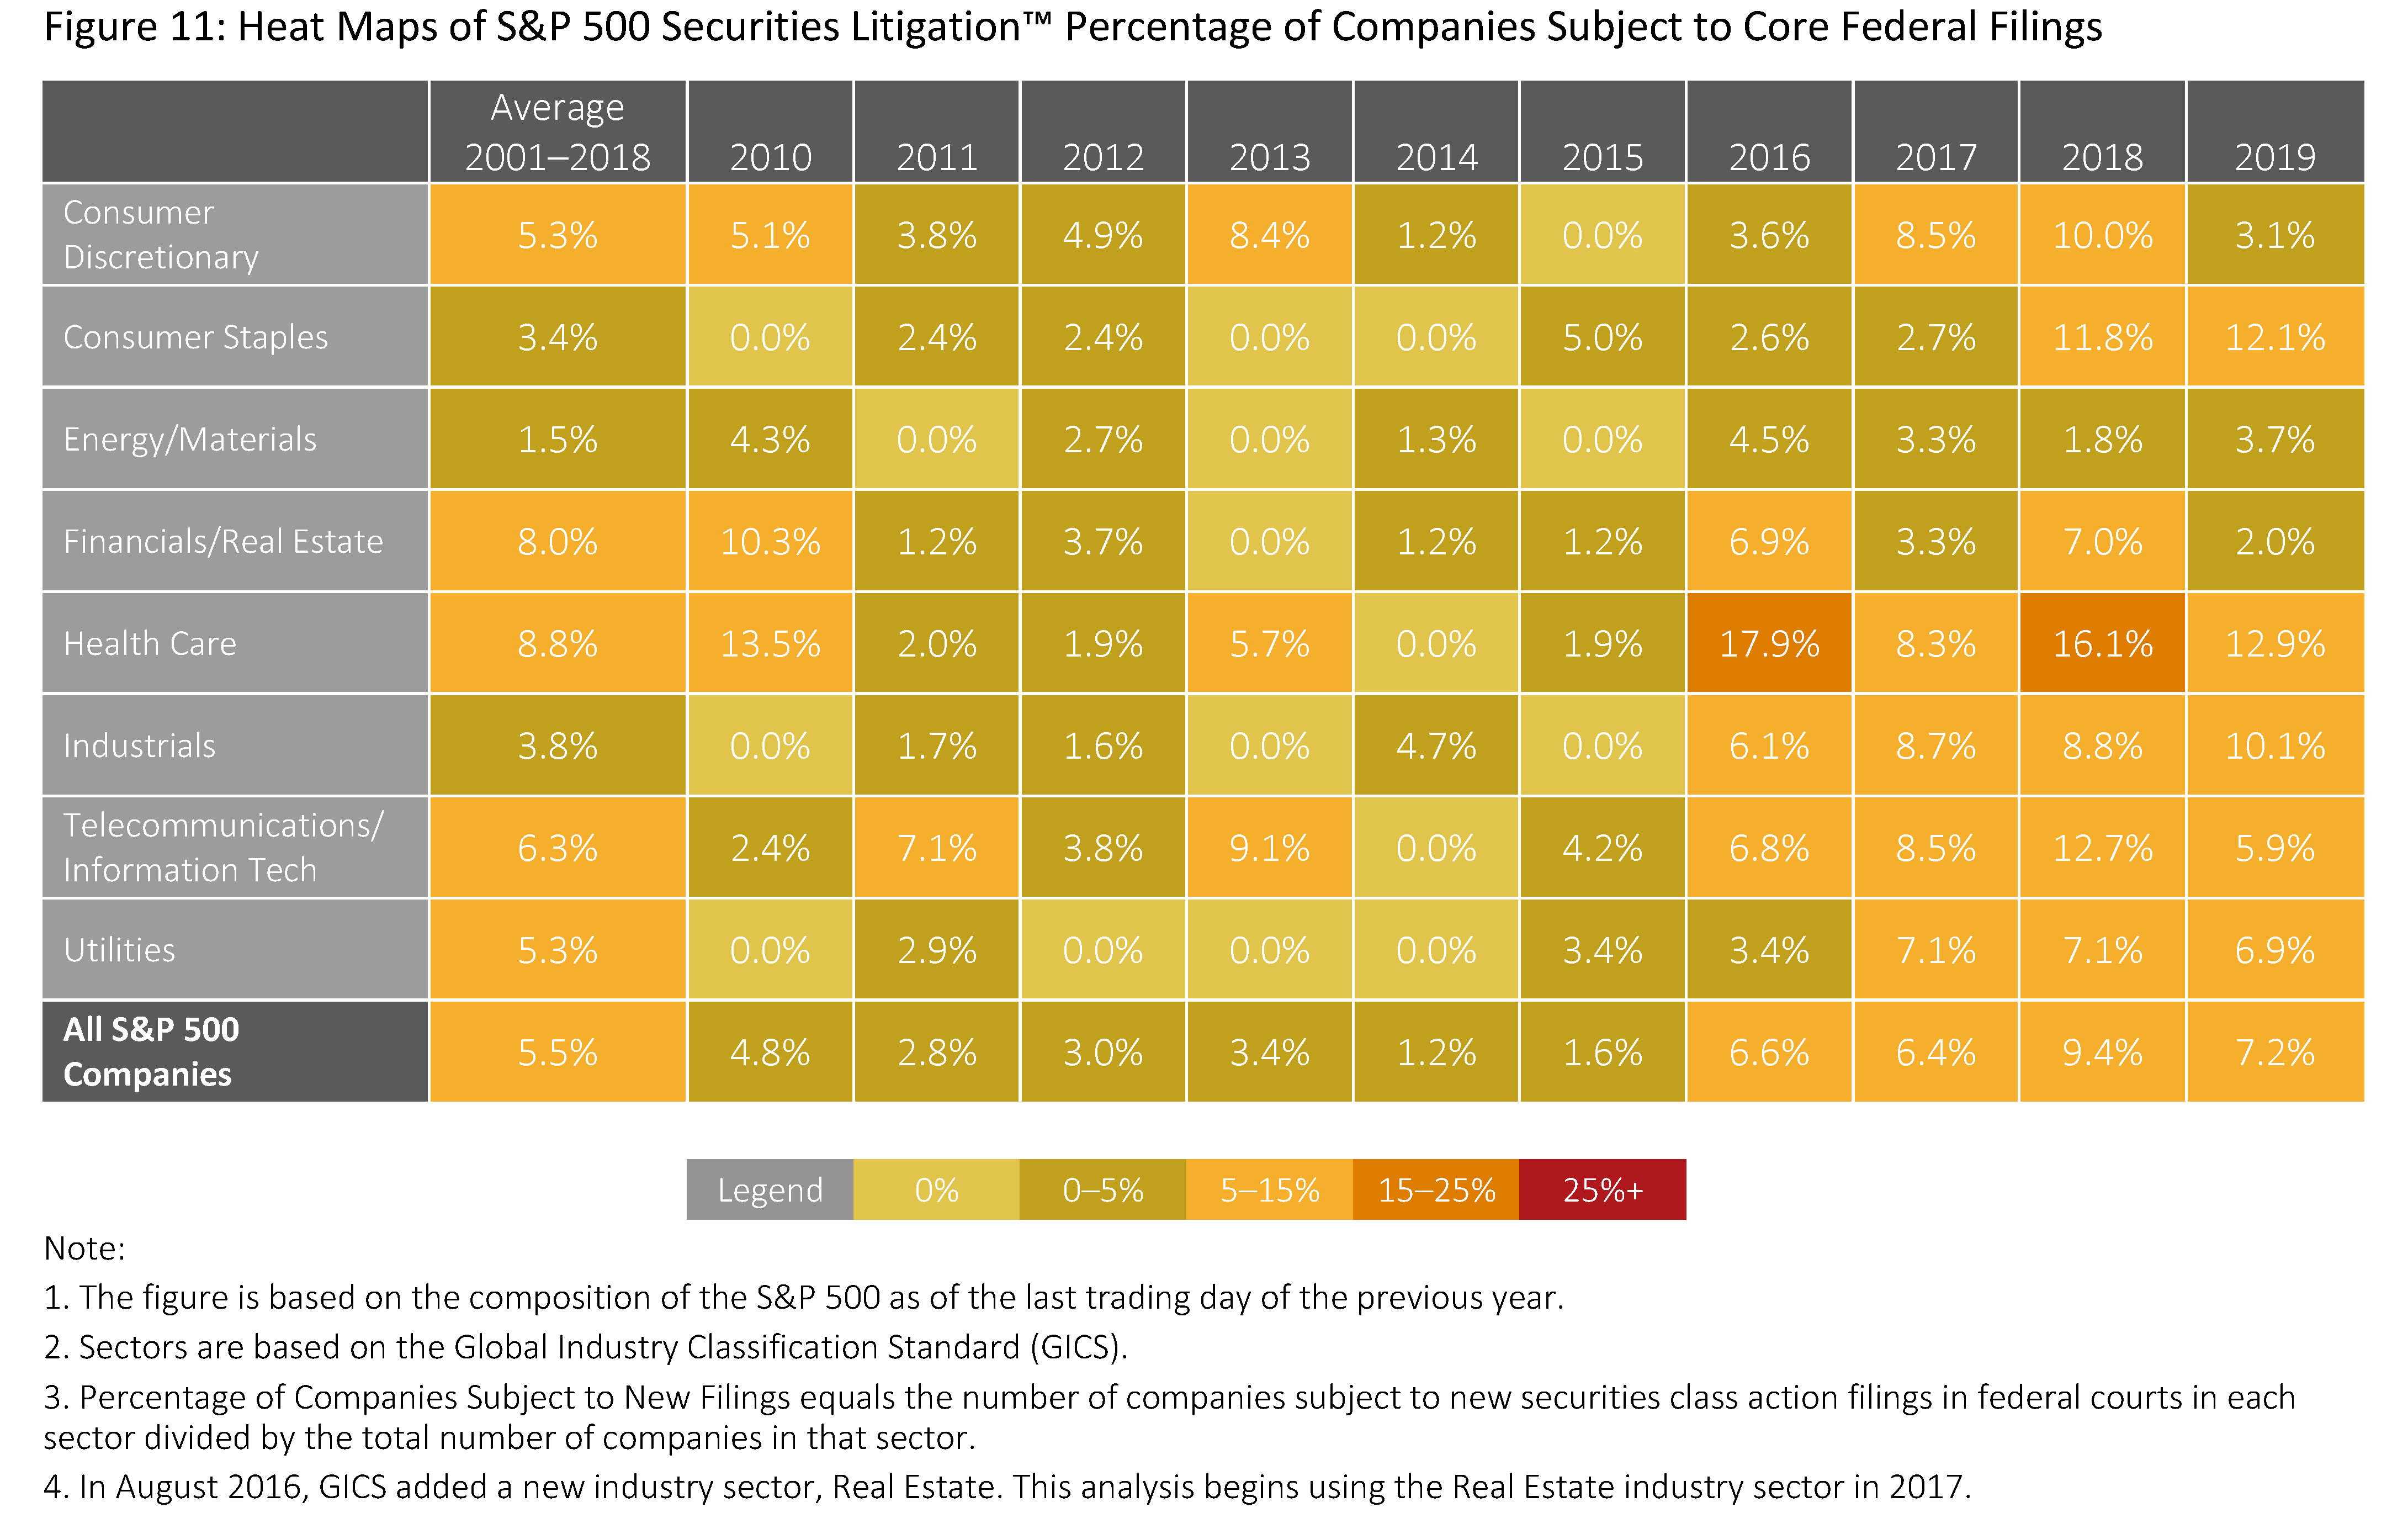
Heat Maps: S&P 500 Securities Litigation™ for Federal Filings
The Heat Maps illustrate federal court securities class action activity by industry sector for companies in the S&P 500 index. Starting with the composition of the S&P 500 at the beginning of each year, the Heat Maps examine each sector by:
- (1) The percentage of these companies subject to new securities class actions in federal court during each calendar year.
- (2) The percentage of the total market capitalization of these companies subject to new securities class actions in federal court during each calendar year.
- Of the companies in the S&P 500 at the beginning of 2019, approximately one in 14 companies (7.2 percent) was a defendant in a core federal filing during the year. See Appendix 2A of the complete publication for percentage of companies by sector from 2001 to 2019.
- The rate of core federal filings against Energy/Materials firms doubled from 2018 to 2019, while the rate of core federal filings against Telecommunications/Information Tech firms fell by more than 50 percent.
- The Consumer Staples, Industrials, and Utilities sectors continued to see higher likelihoods of core federal filings than prior to 2016, while rates in other sectors have plateaued or decreased.
- The percentage of companies in the Financials/Real Estate sector subject to core federal filings (2 percent) was 25 percent of the 2001–2018 average.
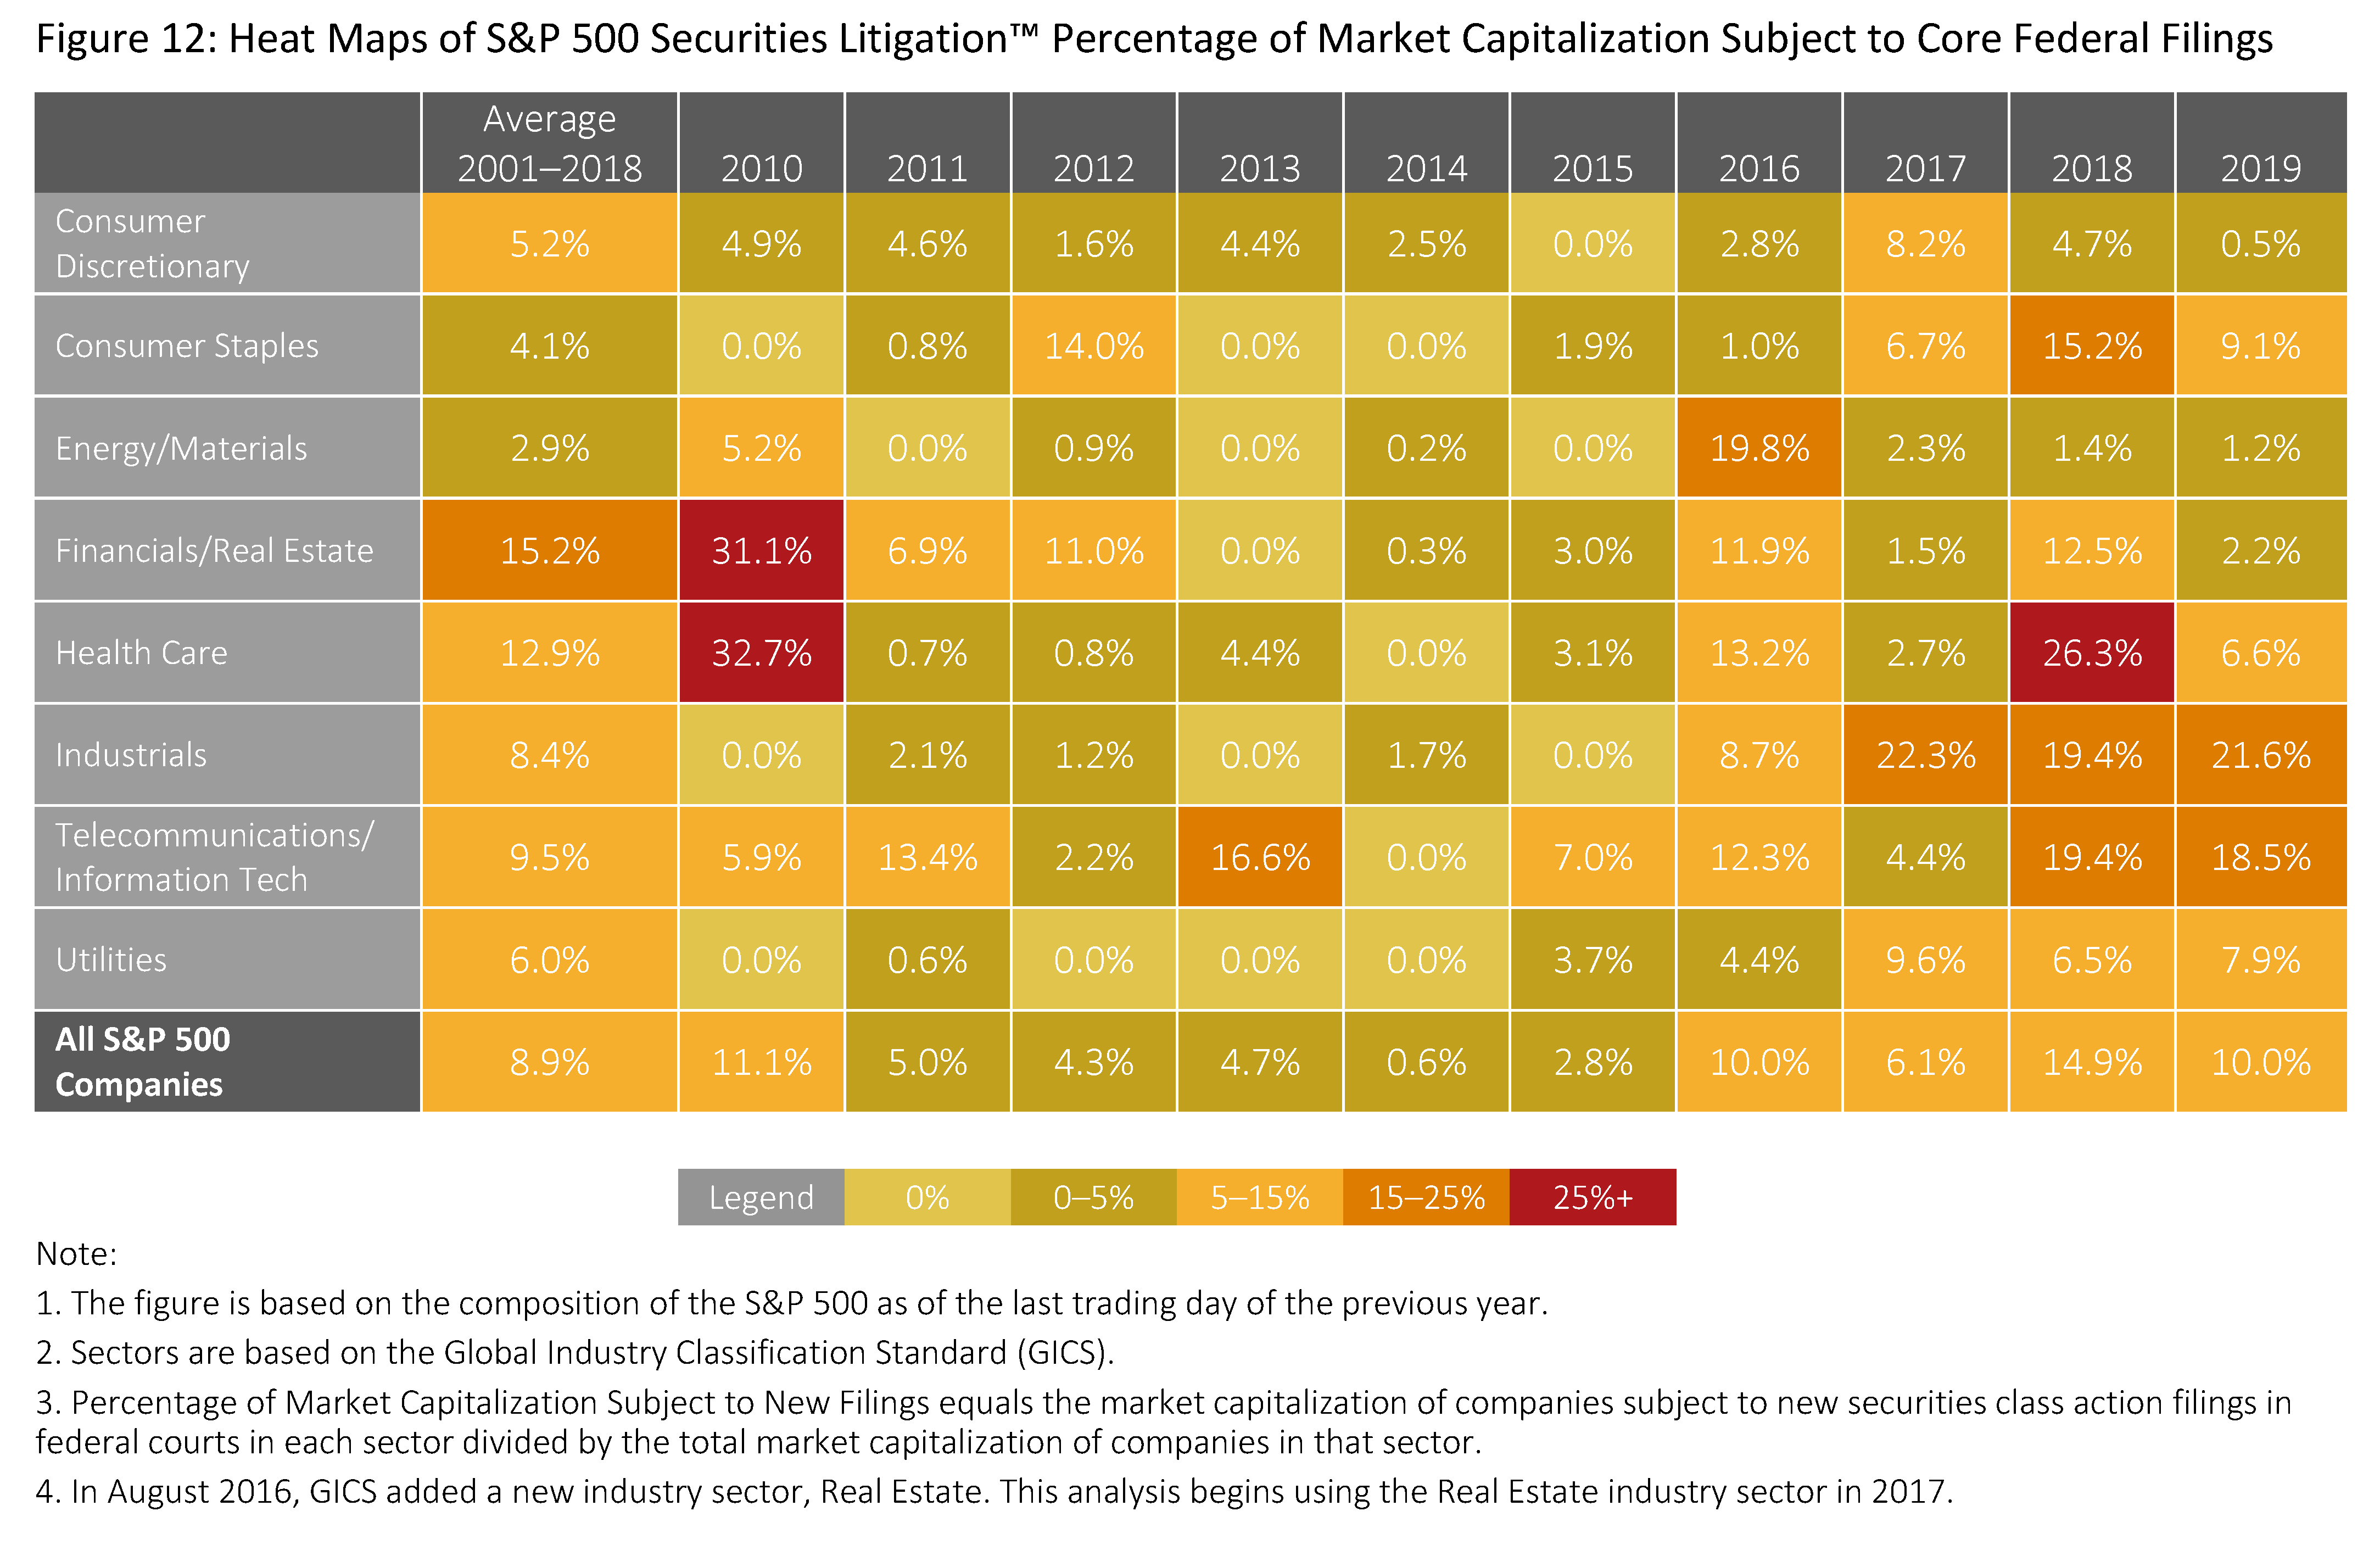
- The percentage of total market capitalization of S&P 500 companies subject to core federal filings fell from 14.9 percent in 2018 to 10.0 percent in 2019. See Appendix 2B of the complete publication for market capitalization percentage by sector from 2001 to 2019.
- While the percentage of companies in the Energy/Materials sector subject to core federal filings more than doubled relative to 2018, the percentage of this sector’s market capitalization subject to core federal filings fell 18 percent year-over-year.
- All sectors other than the Industrials and Utilities sectors saw a decrease in the percentage of market capitalization subject to core federal filings compared to 2018.
Status of M&A Filings in Federal Courts
- There were 624 M&A filings between 2009 and 2018, compared to 1,679 core federal filings.
- M&A filings were dismissed at much higher rates and resolved more quickly than core federal filings.
- M&A filings exhibited settlement rates 28 percentage points below core federal filings. See Appendix 3 of the complete publication for a year-by-year overview of M&A and core filings status.
Status of Federal Securities Class Action Filings
This analysis compares filing groups to determine whether filing outcomes have changed over time. As each cohort ages, a larger percentage of filings are resolved—whether through dismissal, settlement, remand, or trial verdict.
- From 1997 to 2018, 49 percent of core federal filings were settled, 43 percent were dismissed, less than 1 percent were remanded, and 7 percent are continuing. Overall, less than 1 percent of core federal filings have reached a trial verdict.
- Recent annual dismissal rates have been closer to 50 percent. In the last 10 years the cohorts with the most divergent dismissal rates were 2014 (at 42 percent) and 2013 (at 57 percent).
- More recent cohorts have too many ongoing cases to determine their ultimate dismissal rates. However, the 2016 cohort will end up having a dismissal rate of at least 49 percent.

Federal Filings by Lead Plaintiff
This analysis examines how frequently individual or institutional investors were appointed as lead plaintiff in core federal filings.
- From 1997 to 2003, while individuals were appointed as lead plaintiff more often than institutional investors in core federal filings, the difference narrowed.
- From 2004 to 2012, institutional investors were generally as or more likely to be appointed lead plaintiff than were individuals.
- Starting in 2013, individuals were appointed as lead plaintiff more often than institutional investors. This suggests a shift in litigation strategies by some plaintiff law firms.
- Individuals were exclusively appointed as lead plaintiff in 60 percent of the core federal filings in 2019.
1933 Act Cases Filed in State Courts
The following data include 1933 Act filings in California, New York, and other state courts. The figure below illustrates all the filings currently in the dataset. Filings from prior years are added retrospectively when identified.
- In 2019, 15 class actions alleging violations of the 1933 Act were filed in California state courts, 18 were filed in New York state courts, and 16 were filed in other state courts. These filings may include Section 11, Section 12, and Section 15 claims, but do not include Rule 10b-5 claims.
- Since 2018, 81 percent of California state filings have involved companies headquartered in California and only 16 percent have involved non-U.S. companies. Conversely, in New York only 10 percent involved companies headquartered in New York and 42 percent involved non-U.S. companies.
- In 2019, filings in New York state courts overtook the number of filings in California state courts.
- State filings in states outside of New York and California almost tripled in 2019, from six filings in 2018 to 16 in 2019. These filings were in Florida, Illinois, Massachusetts, Michigan, Nevada, New Jersey, Pennsylvania, Rhode Island, Tennessee, Texas, and Wisconsin.

New: 1933 Act Filings by Venue—Post-Cyan
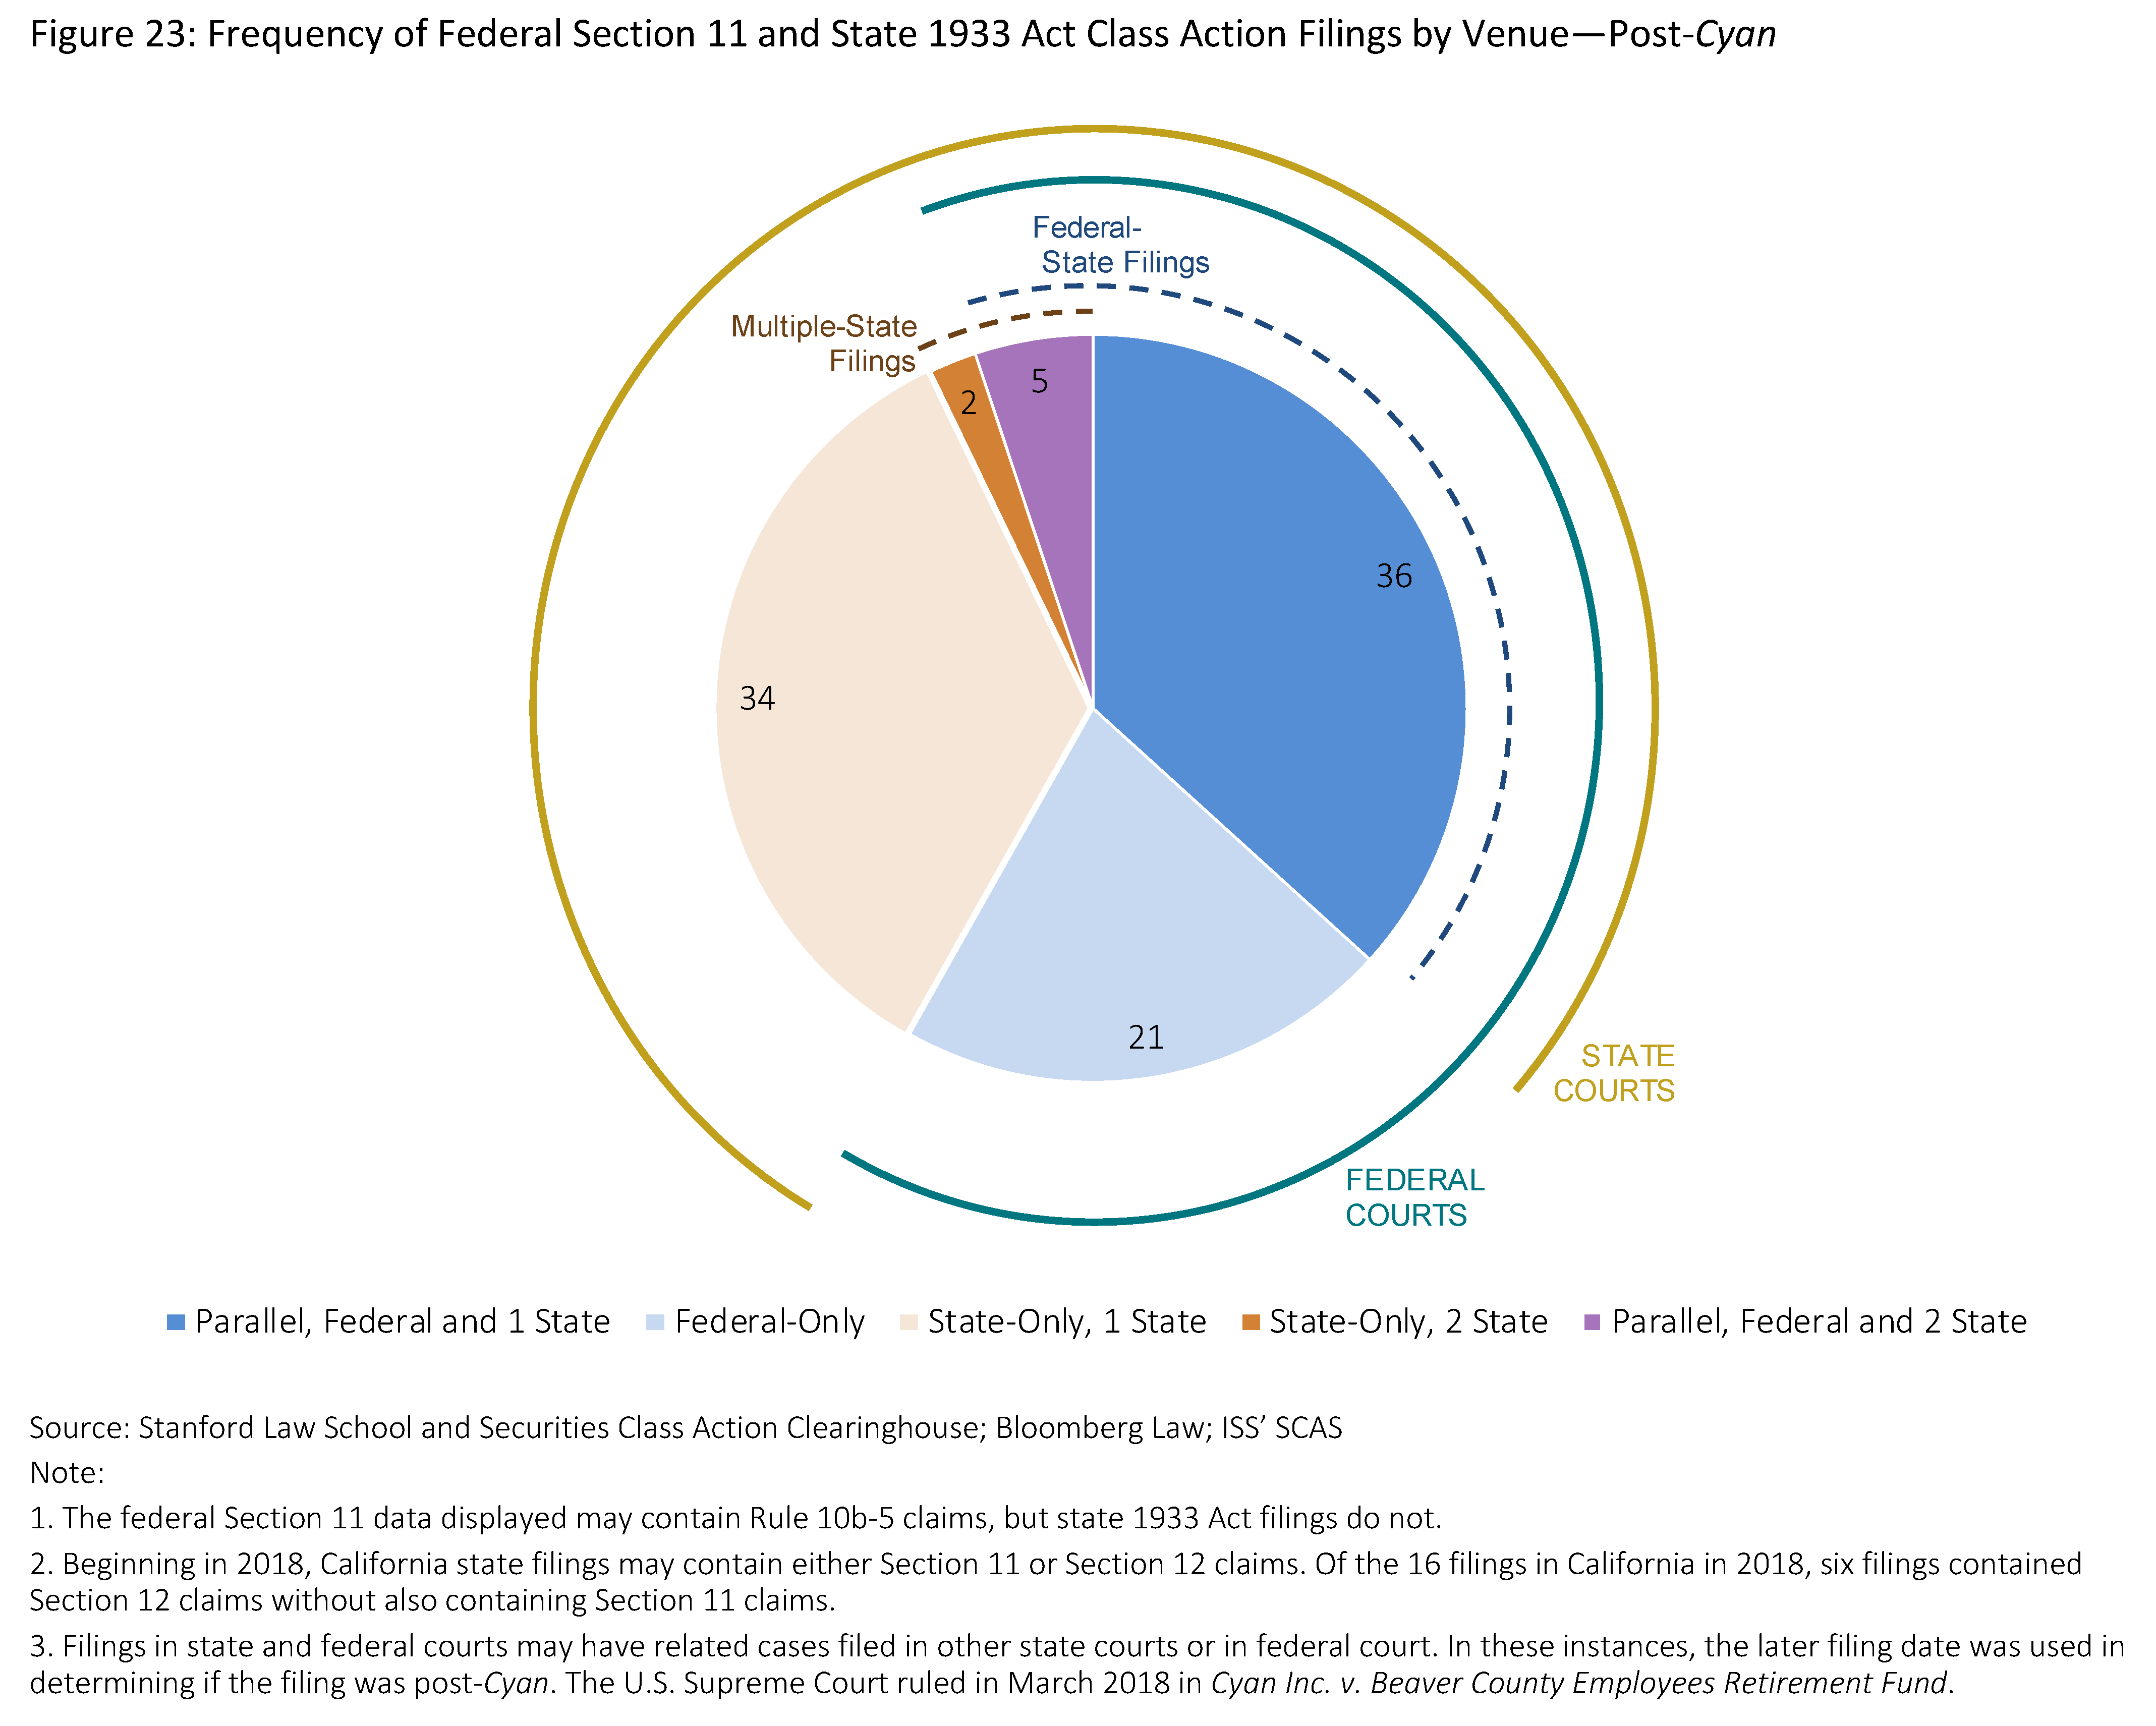
Parallel (or related) 1933 Act filings against the same issuer in different venues have increased post-Cyan. This figure presents the degree to which post-Cyan 1933 Act filings are being litigated in multiple jurisdictions at the same time. These parallel filings may be in federal and state courts (federal-state filings) or in different state courts (multiplestate filings).
- Multiple-state filings have increased post-Cyan. Between 2010 and 2018 there were only four companies facing multiple-state filings, whereas post-Cyan there have already been seven.
- As an example of post-Cyan jurisdictional complexities, in 2019 SmileDirectClub was the subject of securities class action filings in New York federal court, Tennessee federal court, Michigan federal court, Tennessee state court, and Michigan state court.
- Six of the seven companies facing multiple-state filings post-Cyan were sued in New York state courts.
IPO Litigation Likelihood
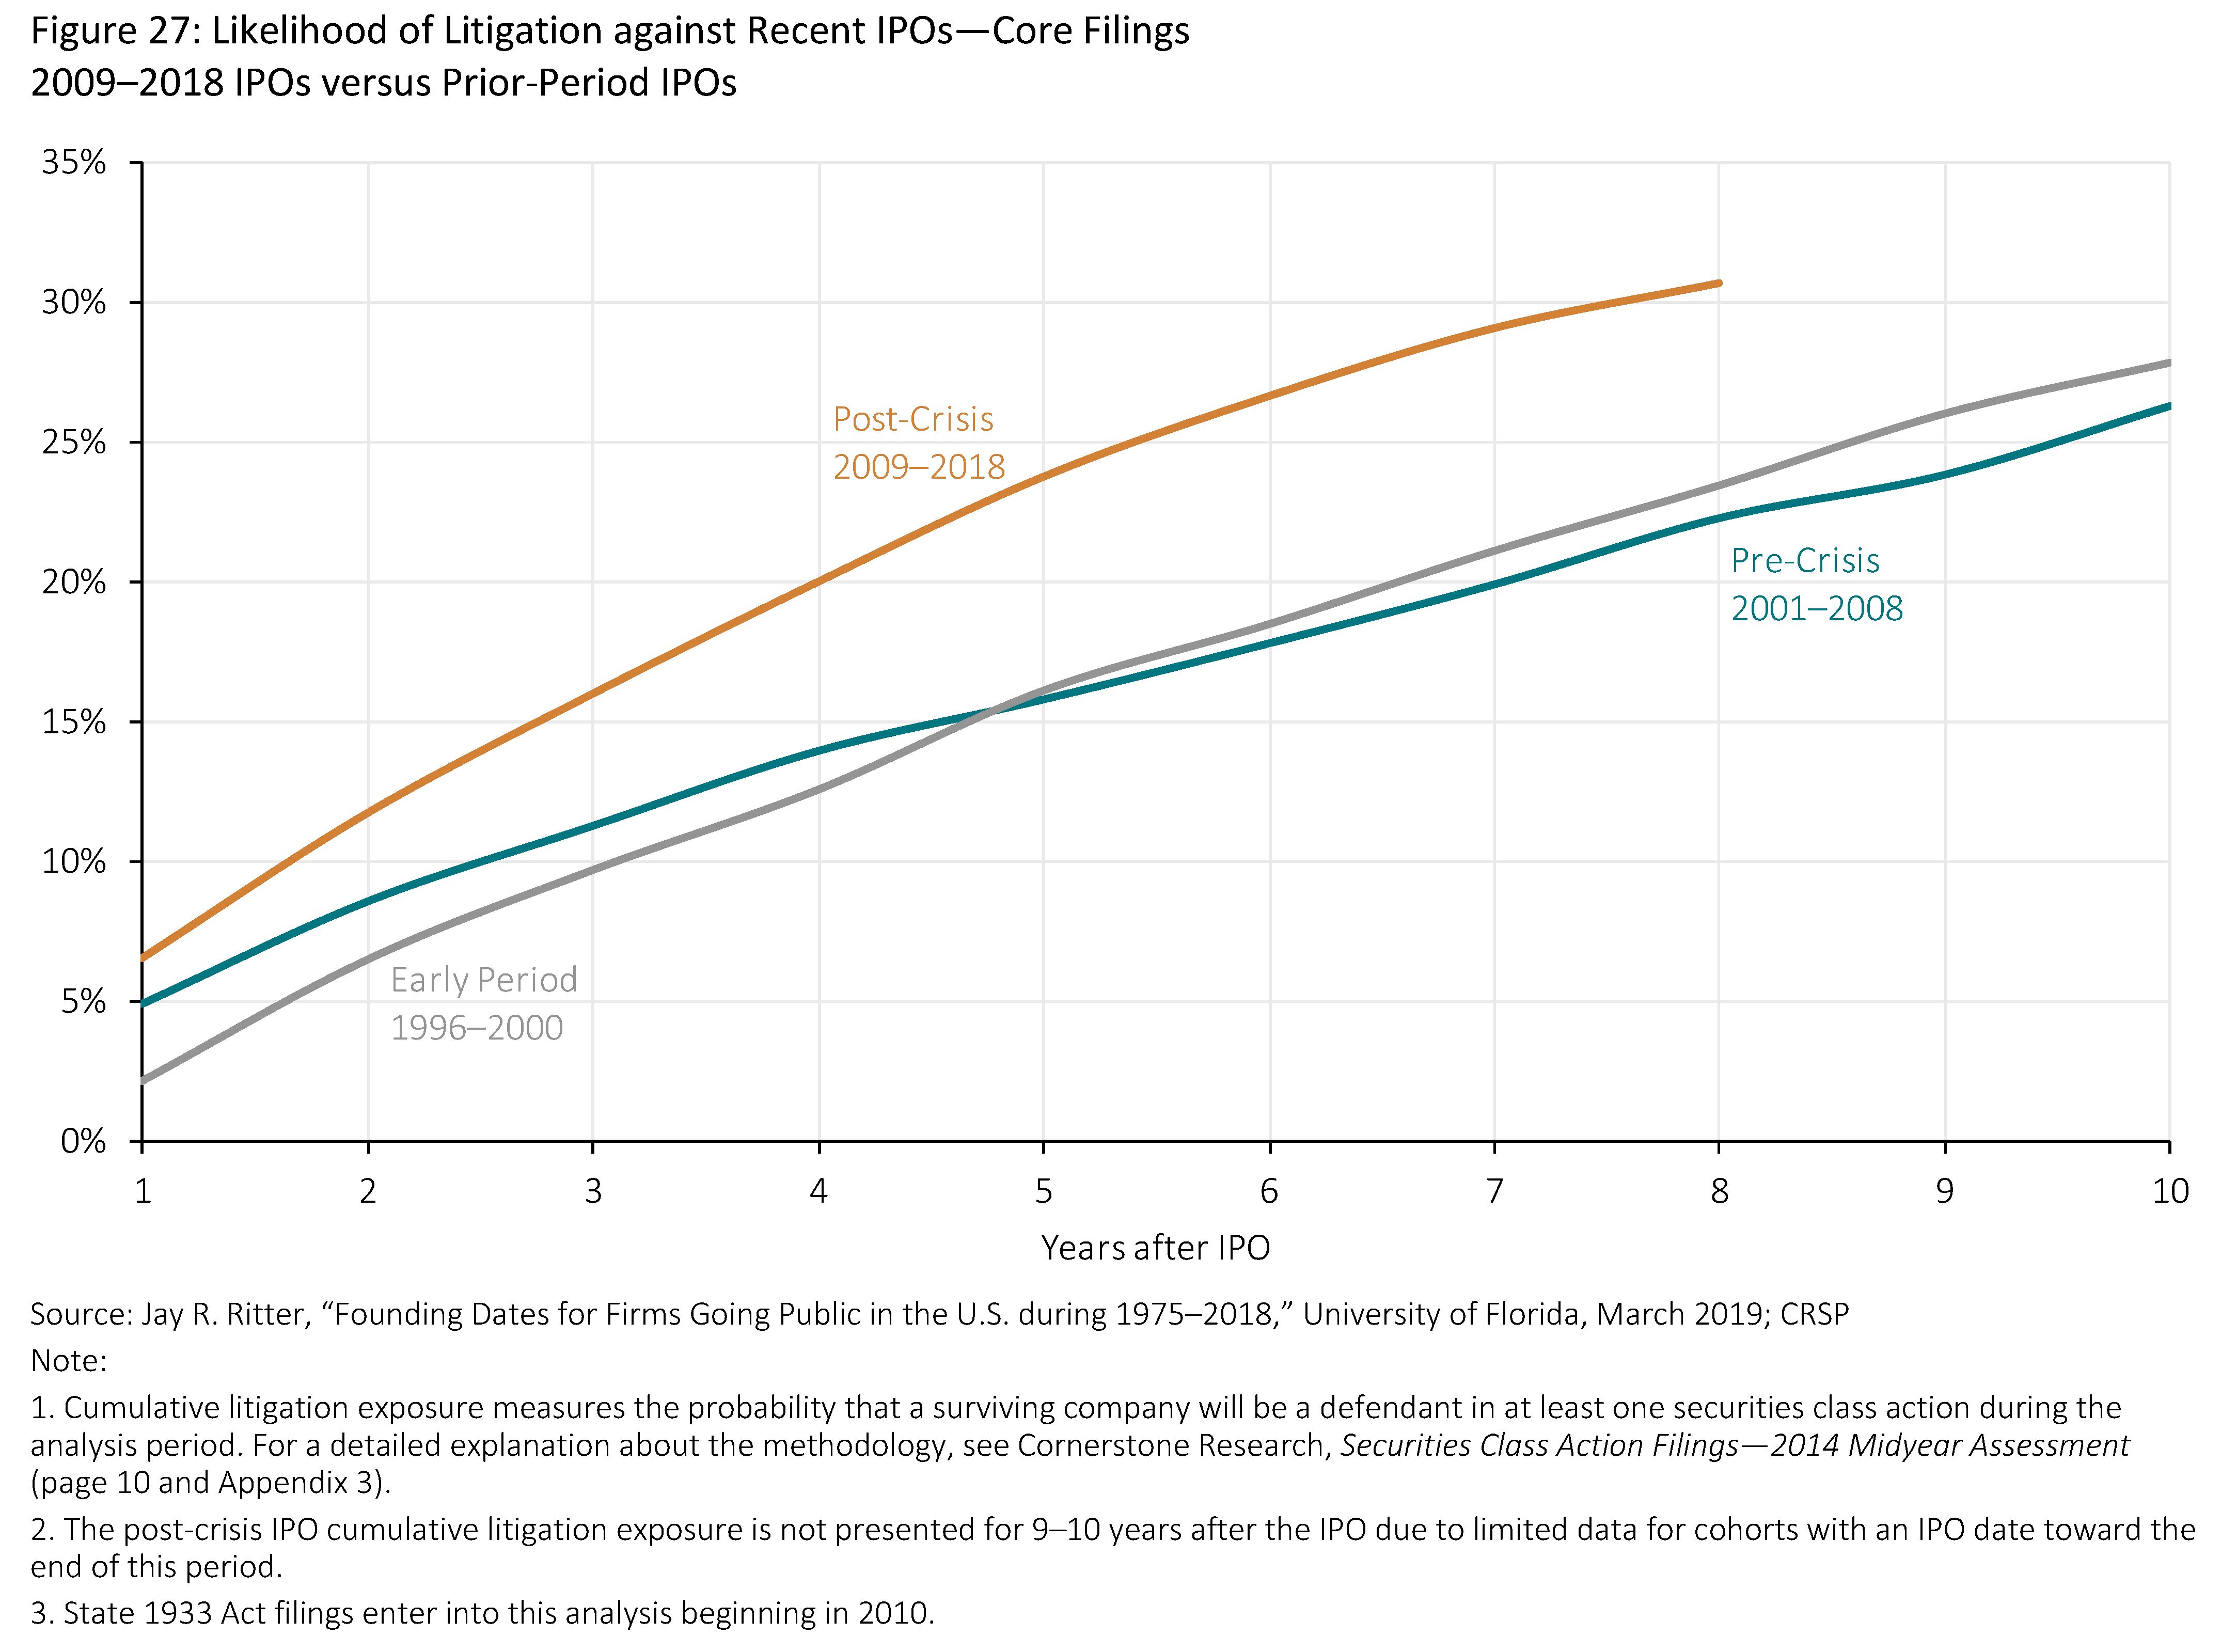
This figure compares the cumulative litigation exposure of IPOs to core federal and state 1933 Act filings since the 2008 credit crisis (post-crisis: 2009–2018) with two other groups of IPOs—core federal filings prior to the credit crisis (precrisis: 2001–2008) and prior to the dot-com collapse (early period: 1996–2000). The 1933 Act filings that are exclusively in the state courts enter into this analysis beginning in 2010.
- Post-crisis IPOs have faced higher litigation exposure in the first few years after an offering than IPOs in prior periods—for example, 20.0 percent of post-crisis IPOs have been subject to a core filing within four years of the IPO, compared to 14.0 percent for the pre-crisis cohort and 12.6 percent for the early period cohort.
- For each IPO grouping, the incremental litigation exposure generally decreased with each year further removed from the IPO. See Appendix 6 of the complete publication for incremental exposure litigation values.
The complete publication, including Appendix, is available here.