 Print
PrintLaarni T. Bulan is a Principal and Laura Simmons is Senior Advisor at Cornerstone Research. This post is based on their Cornerstone report.
Highlights
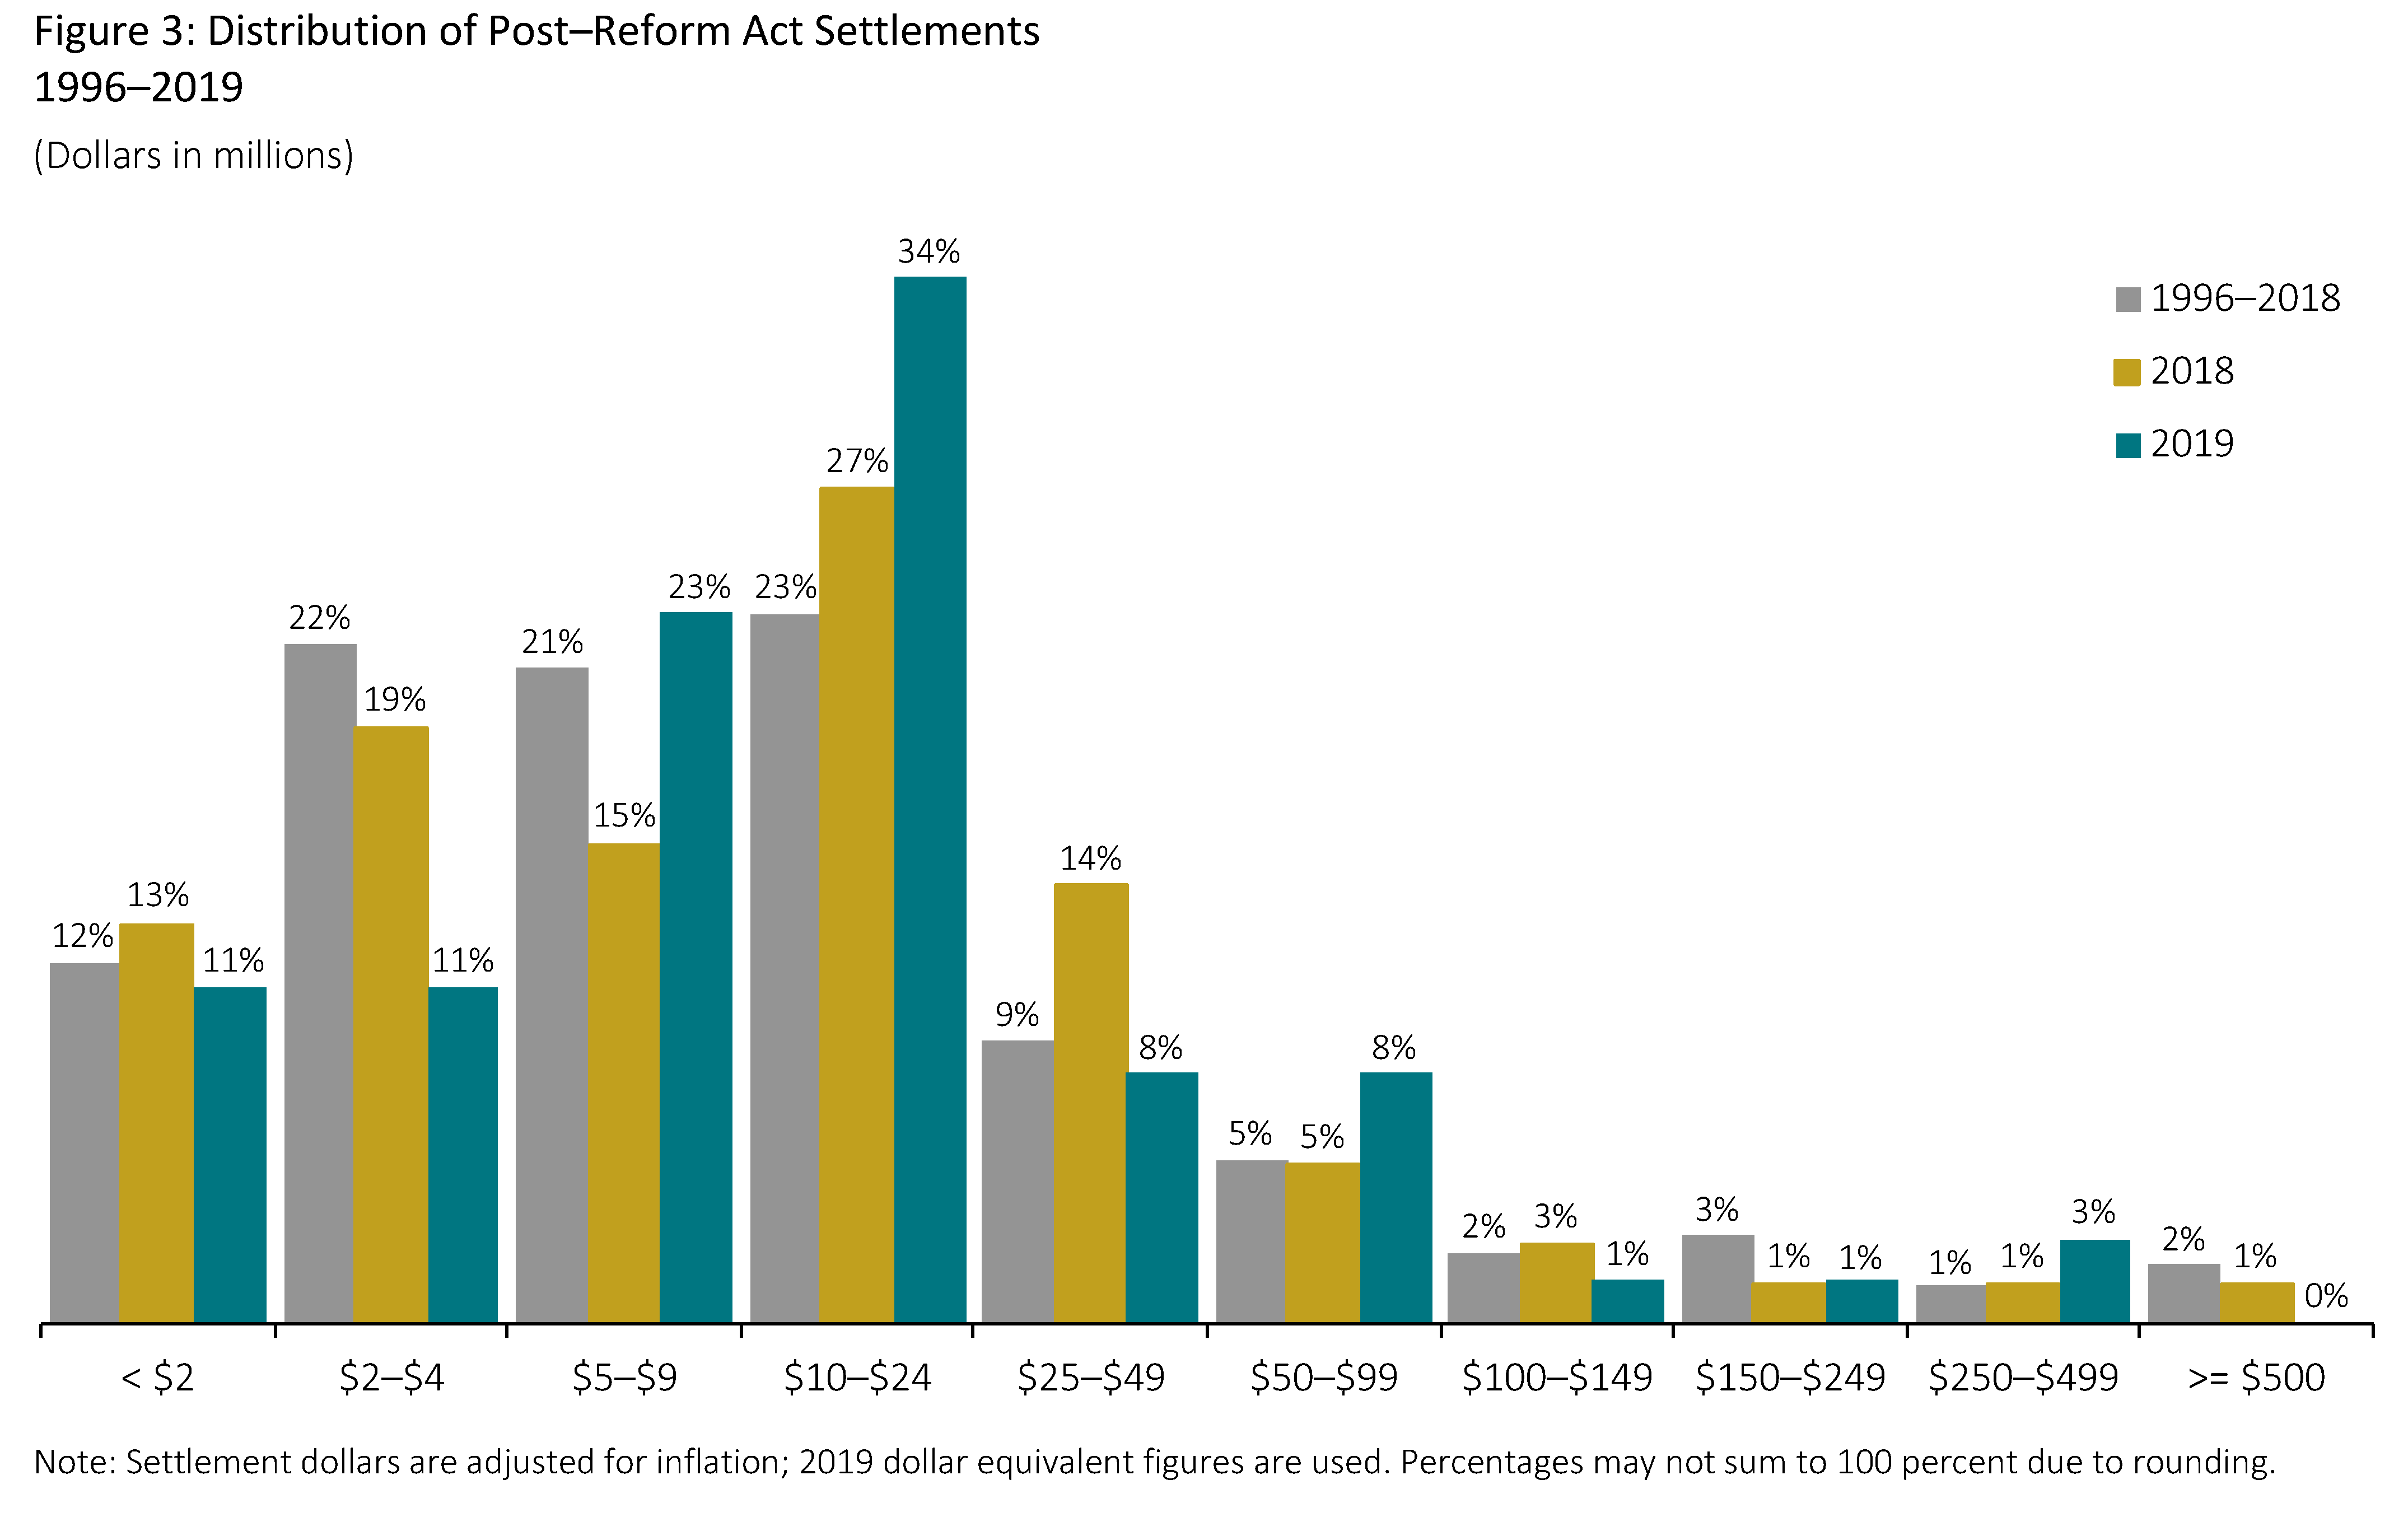
Historically high median settlement amounts persisted in 2019, driven primarily by an increase in the overall percentage of mid-sized cases in the $5 million to $25 million range as well as a decrease in the number of smaller settlements.
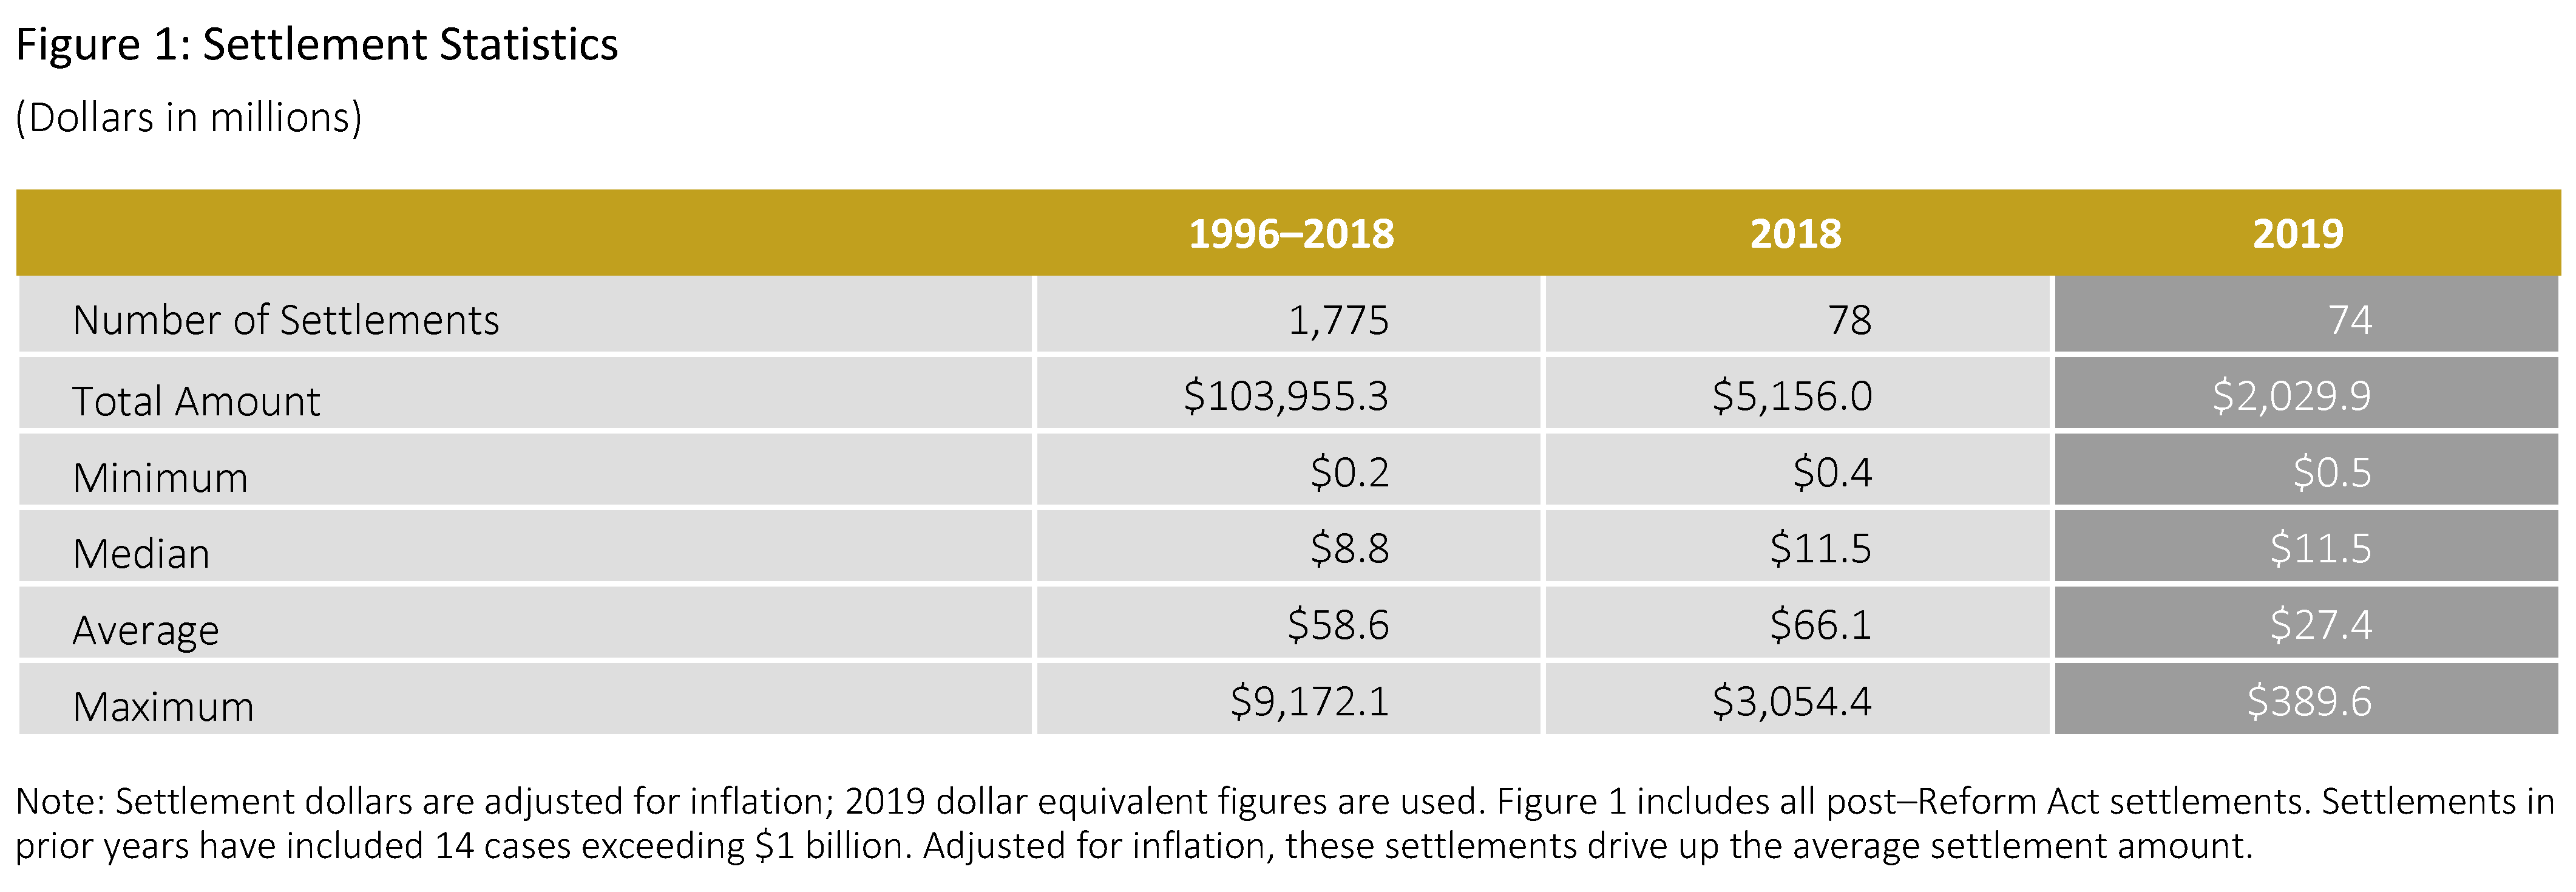
- There were 74 settlements totaling $2 billion in 2019.
- The median settlement in 2019 of $11.5 million was unchanged from 2018 (adjusted for inflation) and was 34 percent higher than the prior nine-year median.
- The average settlement amount in 2019 was $27.4 million, which was 43 percent lower than the prior nine-year average.
- There were four mega settlements (settlements equal to or greater than $100 million) in 2019.
- The number of small settlements (amounts less than $5 million) declined by 36 percent to 16 cases in 2019, the fewest such settlements in the past decade.
- The proportion of settlements in 2019 with a public pension plan as lead plaintiff reached its lowest level in the prior 10 years.
- In 2019, 53 percent of settled cases involved an accompanying derivative action, the second-highest rate over the past decade.
- Companies that settled cases after a ruling on a motion to dismiss (MTD) were, on average, 50 percent larger (measured by total assets) than companies that settled while the MTD was pending.
Author Commentary
2019 Findings
The size of issuer defendant firms (measured by total assets) continued to grow in 2019, increasing by 59 percent over 2018 and 117 percent above the median over the last 10 years. This may be due at least in part to prolonged changes in the population of public companies. In particular, as has been widely observed, the number of publicly traded firms continued to decline in recent years—with the result that remaining public firms are larger.
As discussed by other commentators, large issuer defendants may cause plaintiff counsel to pursue potential claims more vigorously. As in our prior research, we examine the number of docket entries as a proxy for the time and effort by plaintiff counsel and/or case complexity. In 2019, average docket entries were the highest in the last 10 years, primarily driven by cases with relatively large damages, as measured by our simplified proxy for plaintiffstyle damages (i.e., “simplified tiered damages” exceeding $500 million).
Overall, our simplified proxy for plaintiff-style damages remained at elevated levels in 2019 compared to earlier years in the decade, in part reflecting the relatively high market capitalization losses associated with cases filed over the last three years.
Another driver of higher plaintiff-style damages is class period length. Indeed, plaintiffs often amend their initial complaints to capture longer alleged class periods. In 2019, the median class period length per the operative complaint as of the time of settlement was 1.7 years—the longest over the last 10 years. In comparison, the median class period alleged in first identified complaints during 2015–2018 (the period during which most of the 2019 settlements were filed) was just under one year. This indicates that between the time of filing and settlement plaintiffs substantially expanded the period over which they claim the alleged fraud occurred.
Despite the large size of cases settled in 2019, public pension plans served as lead plaintiffs less frequently, with their involvement reaching the lowest level over the last 10 years. Prior literature has discussed possible reasons for institutions choosing not to serve as lead plaintiffs, including an imbalance in the cost/benefit of doing so.
One finding that is particularly striking is the decrease in public pension plan lead plaintiffs despite an increase in larger issuer firms with potentially sizable damages exposure.
Other contributors to the reduction in public pension plan involvement may include changes in the mix of plaintiff law firms serving as lead counsel, and possibly the recent increase in the propensity of plaintiffs to opt out of class actions, including in larger cases (see Opt-Out Cases in Securities Class Action Settlements: 2014–2018 Update, Cornerstone Research).
Looking Ahead
Recent trends in securities case filings can inform expectations for developments in settlements in upcoming years.
The number of filings alleging Rule 10b-5 and/or Section 11 claims reached record levels in 2019. In addition, for the second year in a row, median Disclosure Dollar Loss (DDL) for case filings reached unusually high levels (see Securities Class Action Filings—2019 Year in Review, Cornerstone Research).
Absent changes in dismissal rates, these results suggest that the volume of securities case settlements, as well as their value, is likely to continue at relatively high levels in upcoming years.
Total Settlement Dollars
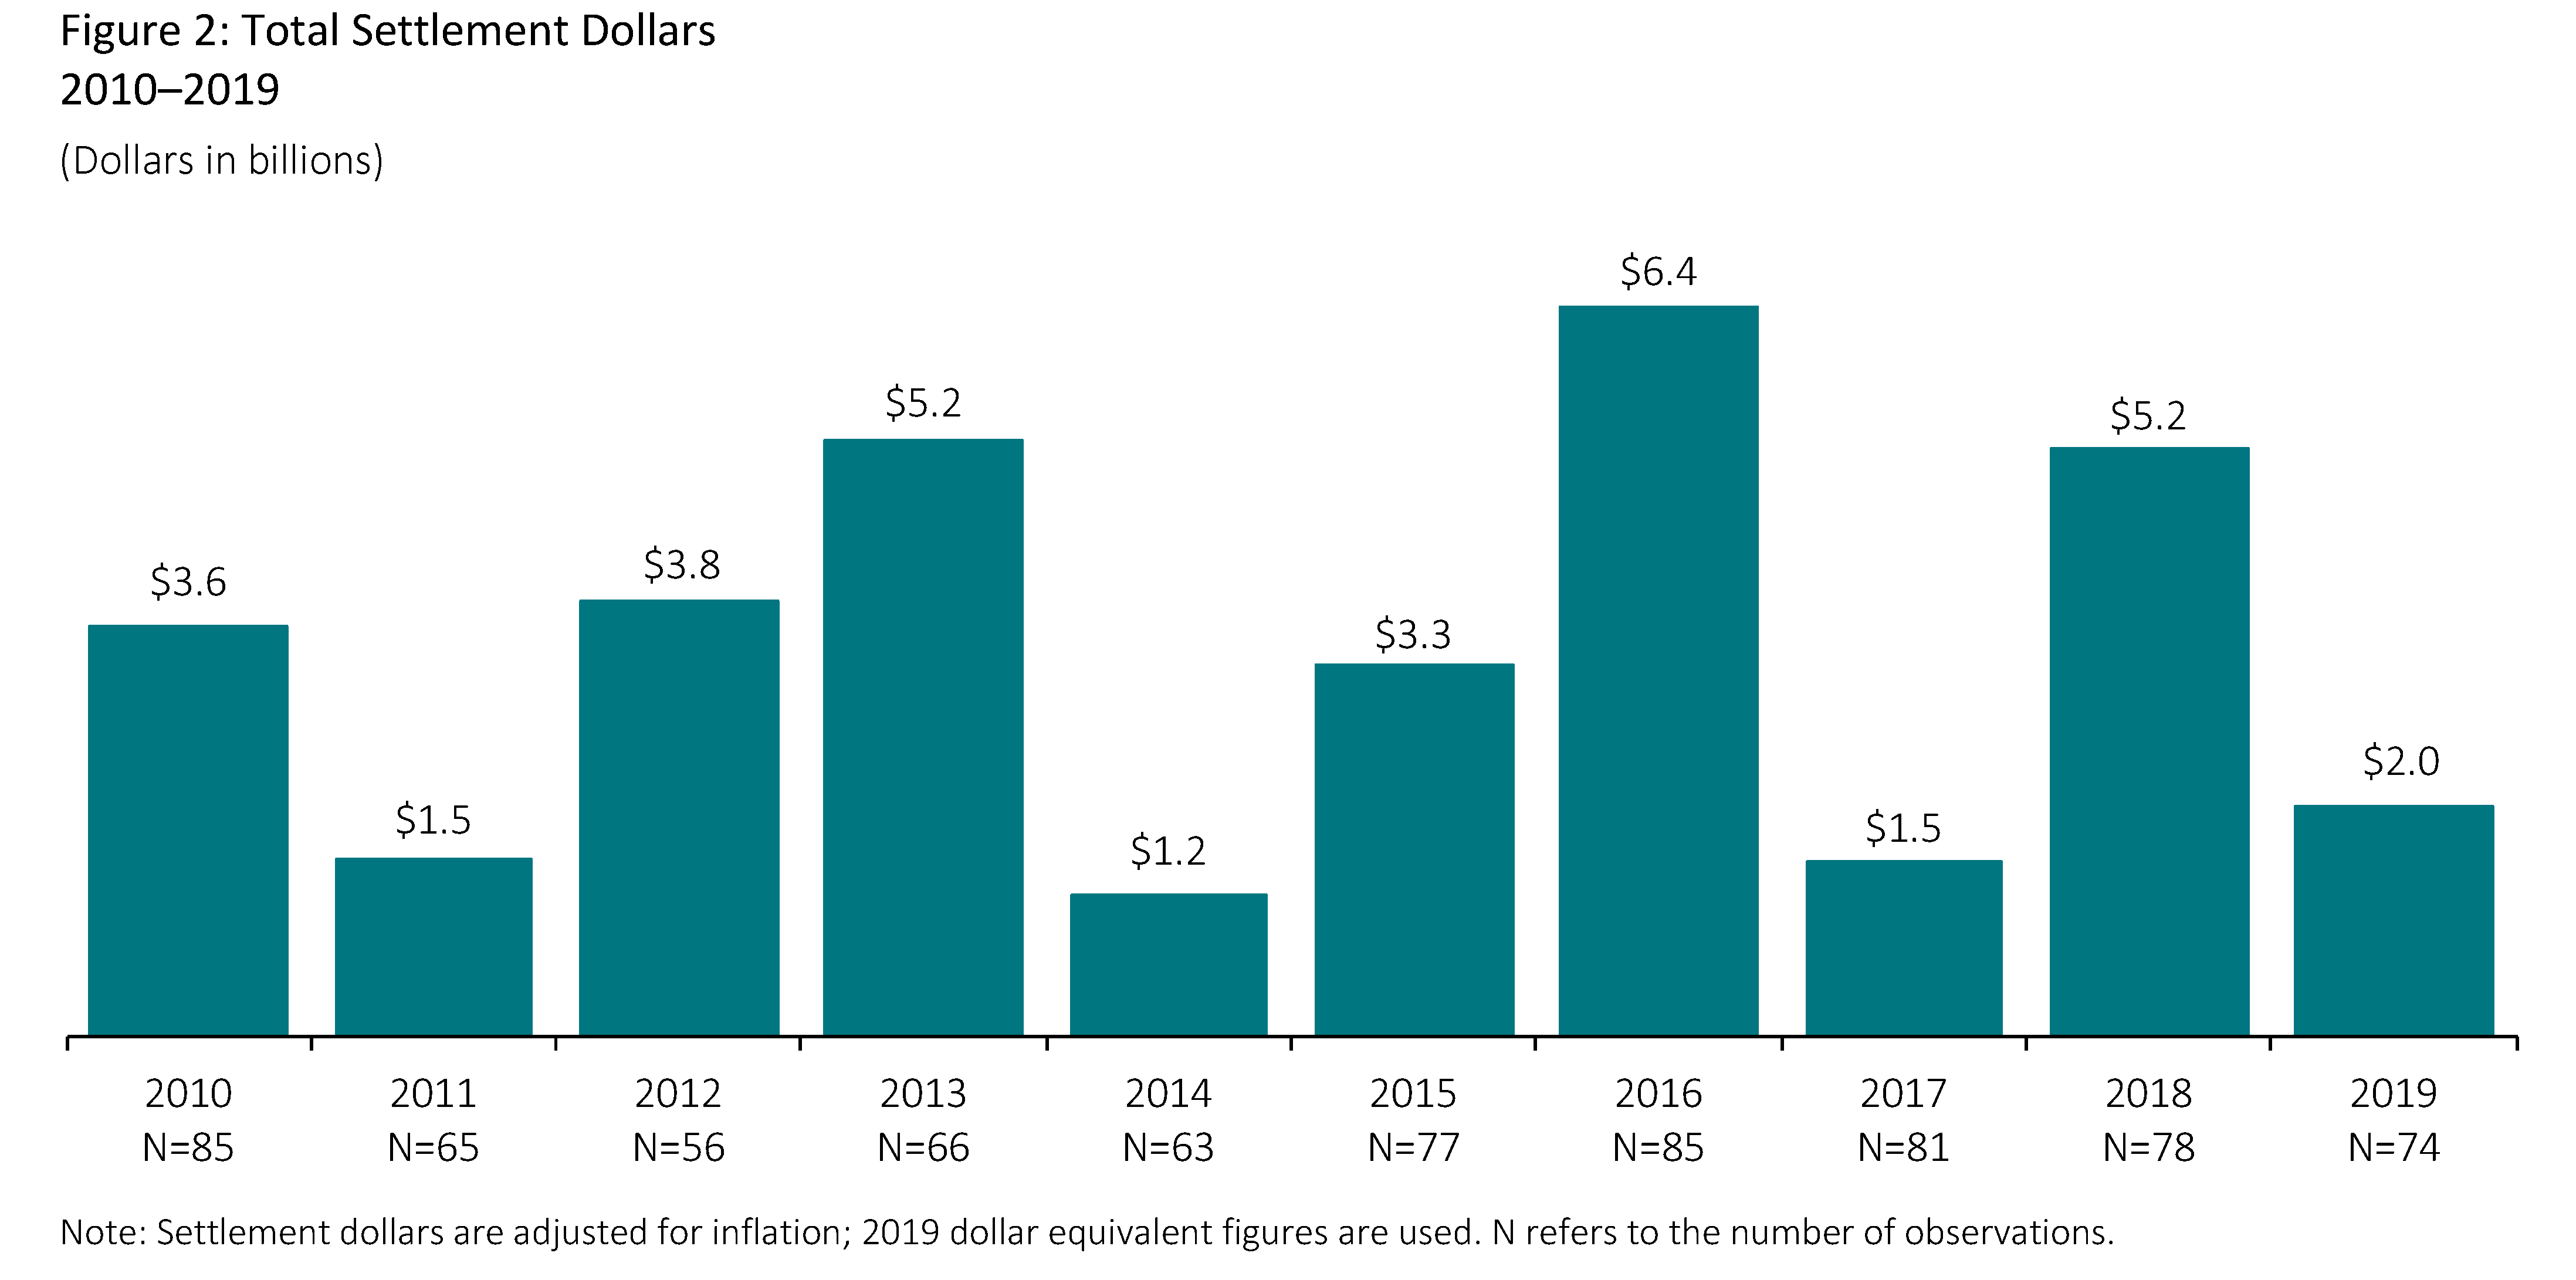
- The total value of settlements approved by courts in 2019 declined dramatically from 2018 due to the absence of very large settlements. Excluding 2018 settlements over $1 billion, however, total settlement dollars declined by a modest 3 percent in 2019 (adjusted for inflation).
- The median settlement amount in 2019 of $11.5 million was unchanged from the prior year (adjusted for inflation).
- Compared to the prior nine years, larger median settlement amounts in 2019 were accompanied by higher levels in the proxy for plaintiff-style damages.
- Mediators continue to play a central role in the resolution of securities class action settlements. In 2019, nearly all cases in the sample involved a mediator.
Settlement Size
As discussed above, the median settlement amount was unchanged from 2018. Generally, the median is more stable from year to year than the average, since the average can be affected by the presence of even a small number of large settlements.
- The average settlement amount in 2019 was $27.4 million, 43 percent lower than the average over the prior nine years. (See Appendix 1 of the complete publication for an analysis of settlements by percentiles.)
- If settlements exceeding $1 billion are excluded from the prior nine-year average, the decline in 2019 was 16 percent.
- There were four mega settlements (equal to or greater than $100 million) in 2019, with settlements ranging from $110 million to $389.6 million. (See Appendix 4 of the complete publication for additional information on mega settlements.)
- Despite a decline in the average settlement amount from 2018, the number of small settlements (less than $5 million) also declined by 36 percent to 16 cases in 2019, the fewest such settlements in the past decade. Cases that result in settlement funds less than $5 million may be viewed as “nuisance” suits, a shift upwards from a threshold of $2 million prevalent in early post–Reform Act years.
Damages Estimates
Rule 10b-5 Claims: “Simplified Tiered Damages”
“Simplified tiered damages” uses simplifying assumptions to estimate per-share damages and trading behavior. It provides a measure of potential shareholder losses that allows for consistency across a large volume of cases, thus enabling the identification and analysis of potential trends.
Cornerstone Research’s prediction model finds this measure to be the most important factor in predicting settlement amounts. However, this measure is not intended to represent actual economic losses borne by shareholders.
Determining any such losses for a given case requires more in-depth economic analysis.
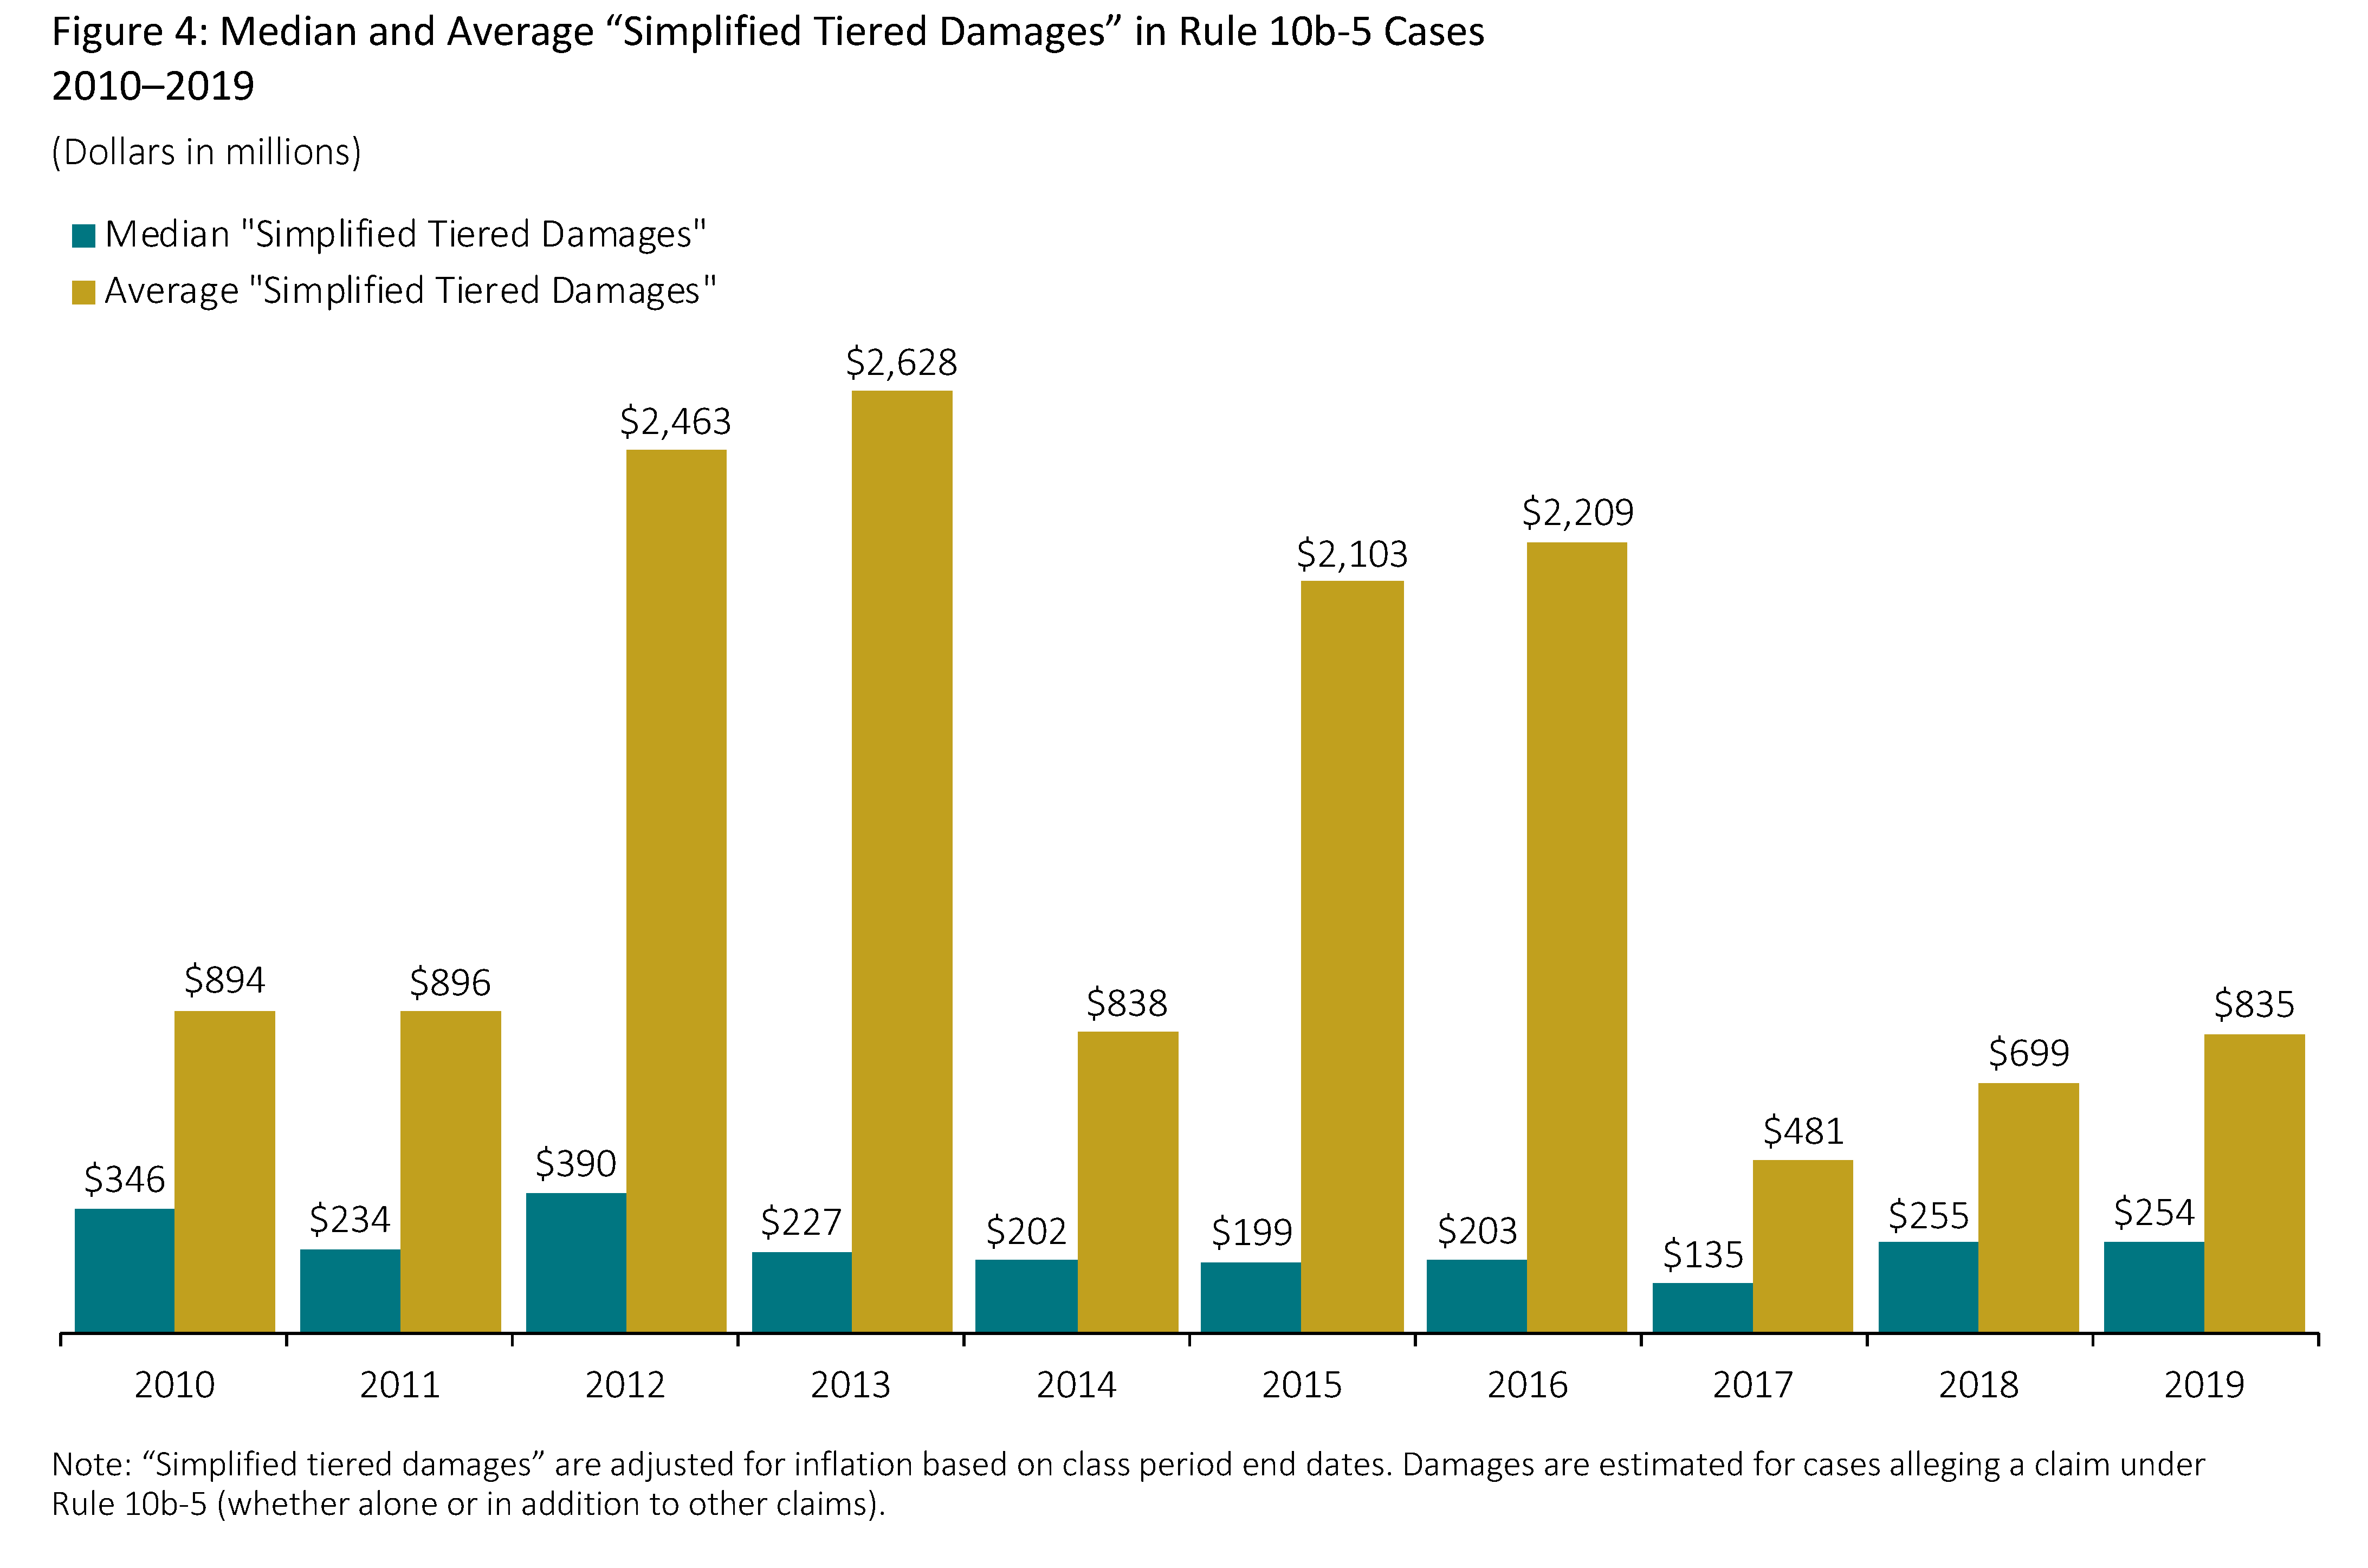
- Median “simplified tiered damages” was largely unchanged from the prior year. (See Appendix 5 of the complete publication for additional information on the median and average settlements as a percentage of “simplified tiered damages.”)
- “Simplified tiered damages” is generally correlated with the length of the class period. Among cases with Rule 10b-5 claims, the median class period length in 2019 was at its highest level in the last 10 years.
- “Simplified tiered damages” is also typically correlated with larger issuer defendants (measured by total assets or market capitalization of the issuer). However, despite the lack of change in median “simplified tiered damages” compared to 2018, median total assets of issuer defendants increased by over 67 percent in 2019.
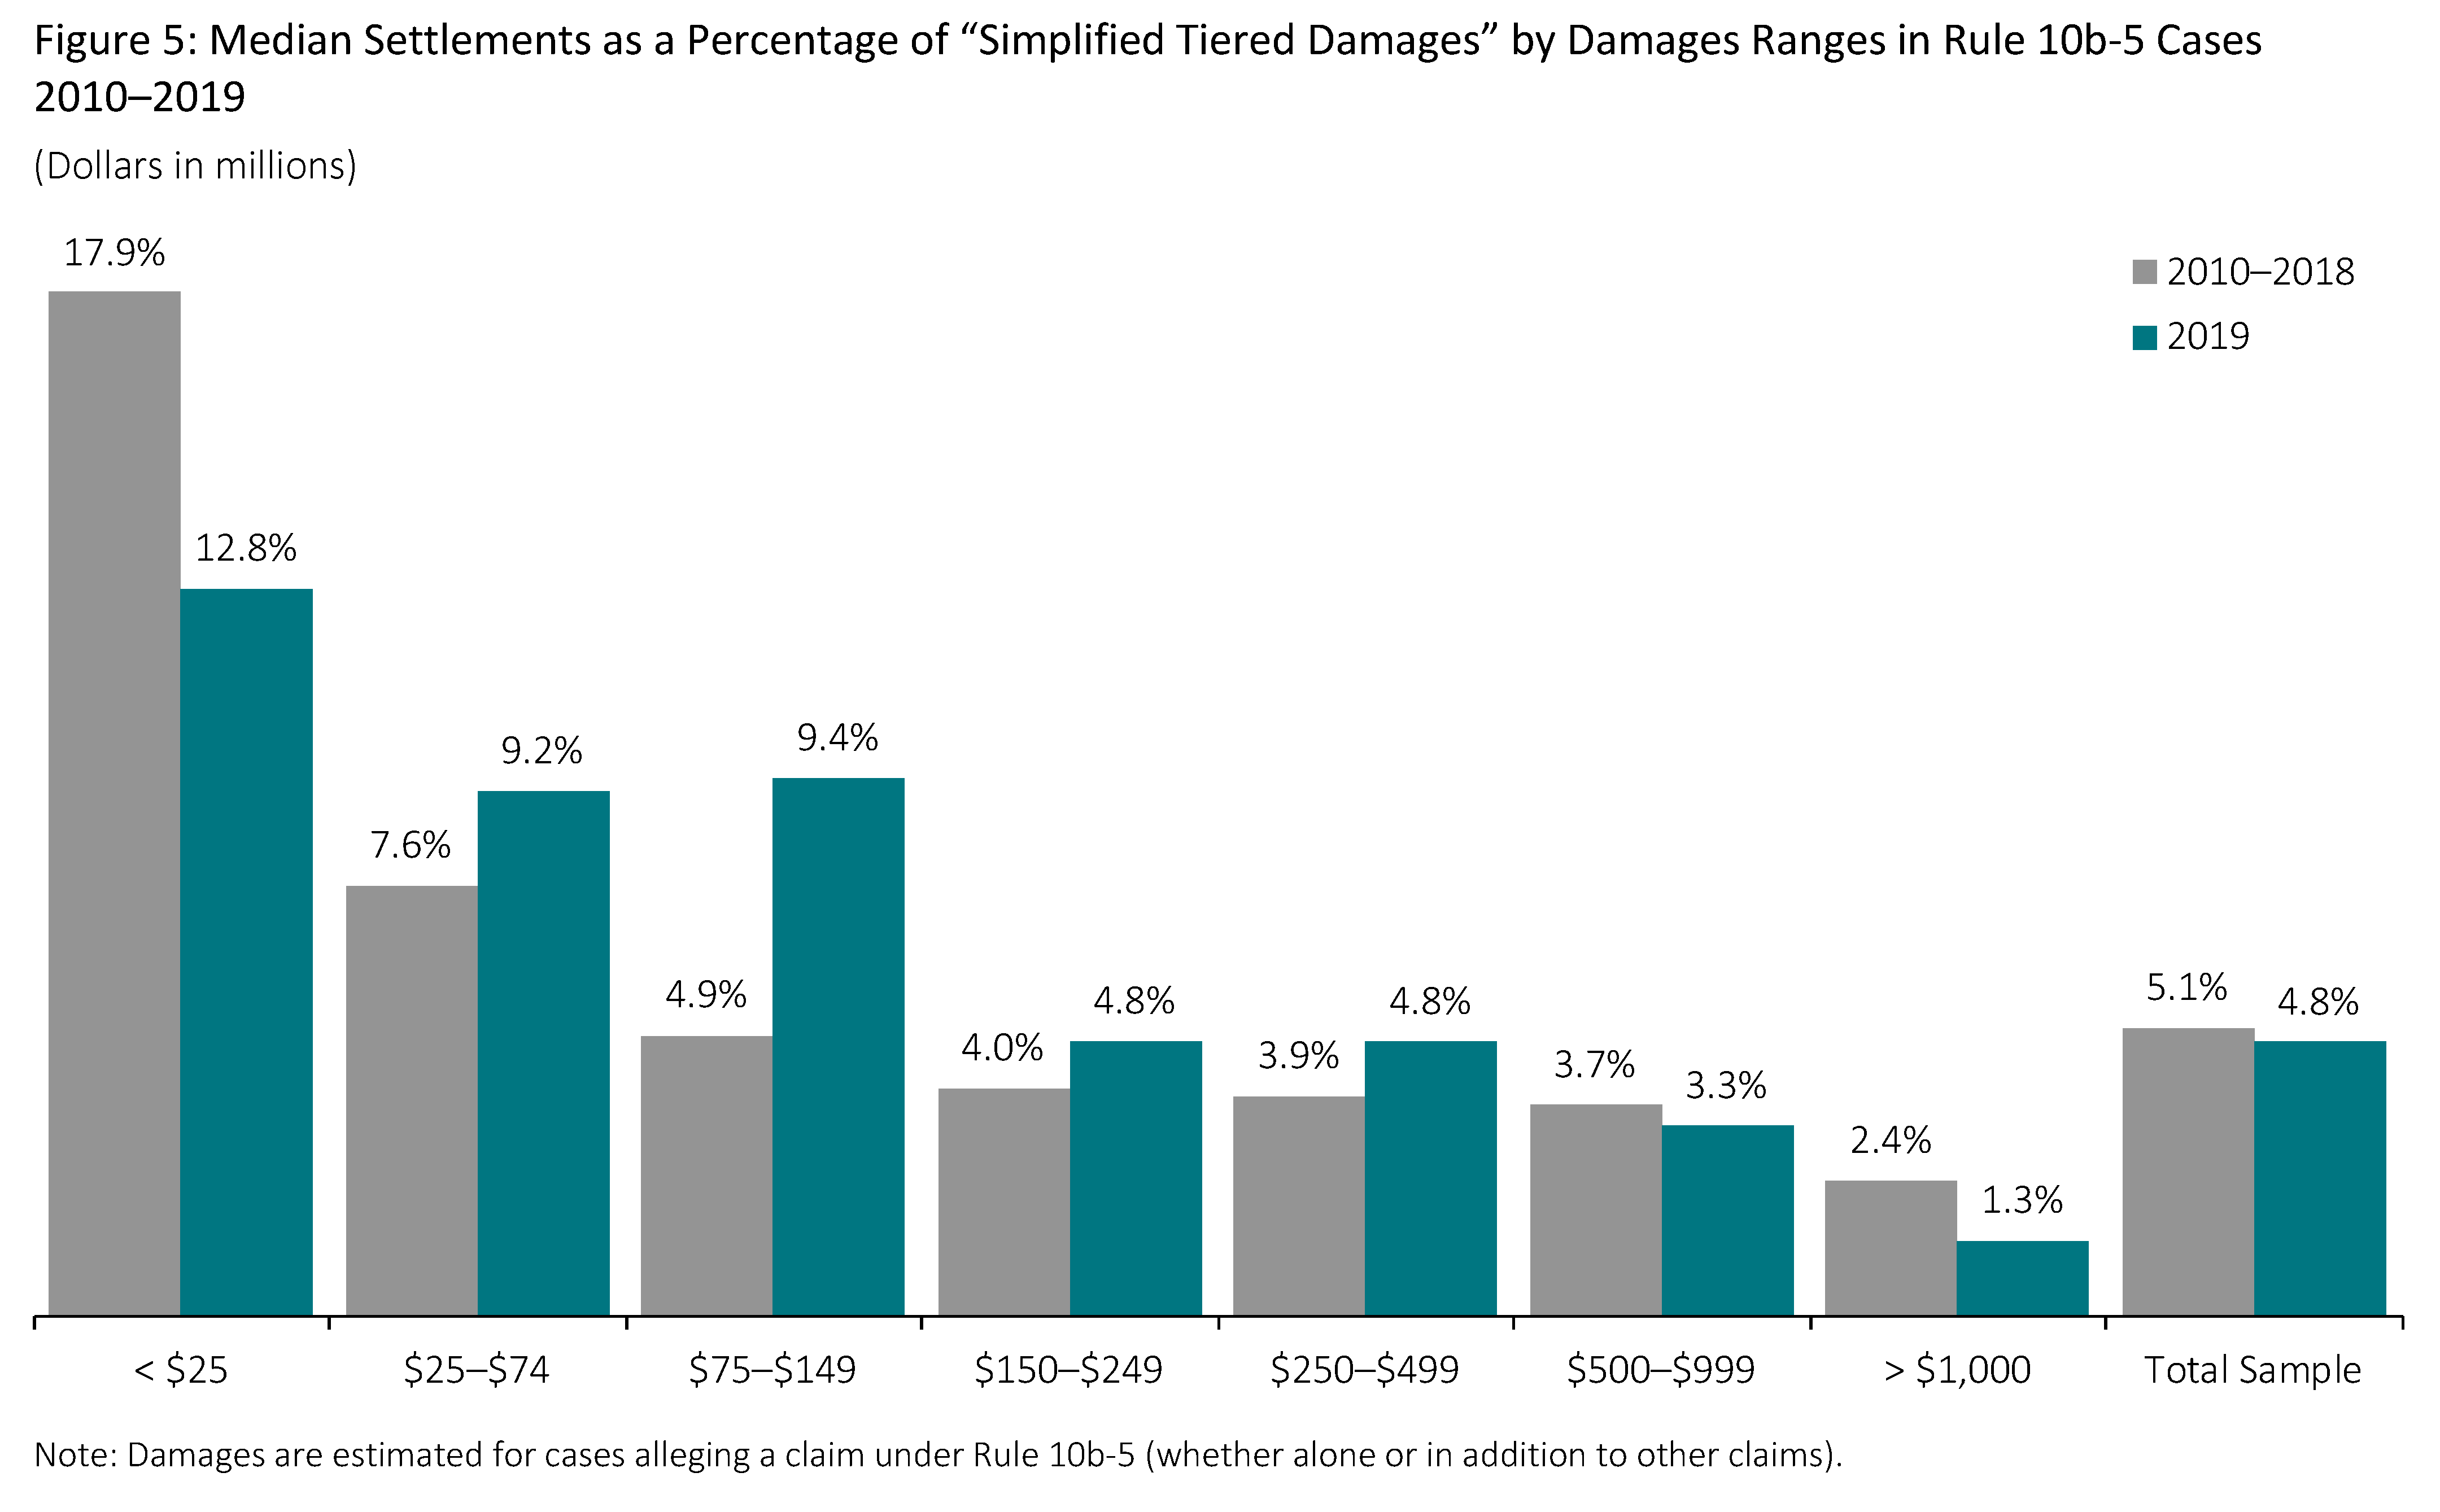
- Larger cases, as measured by “simplified tiered damages,” typically settle for a smaller percentage of damages.
- Smaller cases (less than $25 million in “simplified tiered damages”) are less likely to include factors such as institutional lead plaintiffs and/or related actions by the Securities and Exchange Commission (SEC) or criminal charges.
- Among cases in the sample, smaller cases typically settle more quickly. In 2019, cases with less than $25 million in “simplified tiered damages” settled within 2.0 years on average, compared to 3.5 years for cases with “simplified tiered damages” greater than $500 million.
- The steadily increasing median settlement as a percentage of “simplified tiered damages” observed from 2016 to 2018 reversed in 2019. Appendix 5 of the complete publication shows a substantial increase in 2019 in average settlements as a percentage of “simplified tiered damages.” However, this result is driven by a few outlier cases. Excluding these cases, the average percentage for 2019 is not unusual compared to recent years.
’33 Act Claims: “Simplified Statutory Damages”
For cases involving only Section 11 and/or Section 12(a)(2) claims (’33 Act claims), shareholder losses are estimated using a model in which the statutory loss is the difference between the statutory purchase price and the statutory sales price, referred to here as “simplified statutory damages.” Only the offered shares are assumed to be eligible for damages.
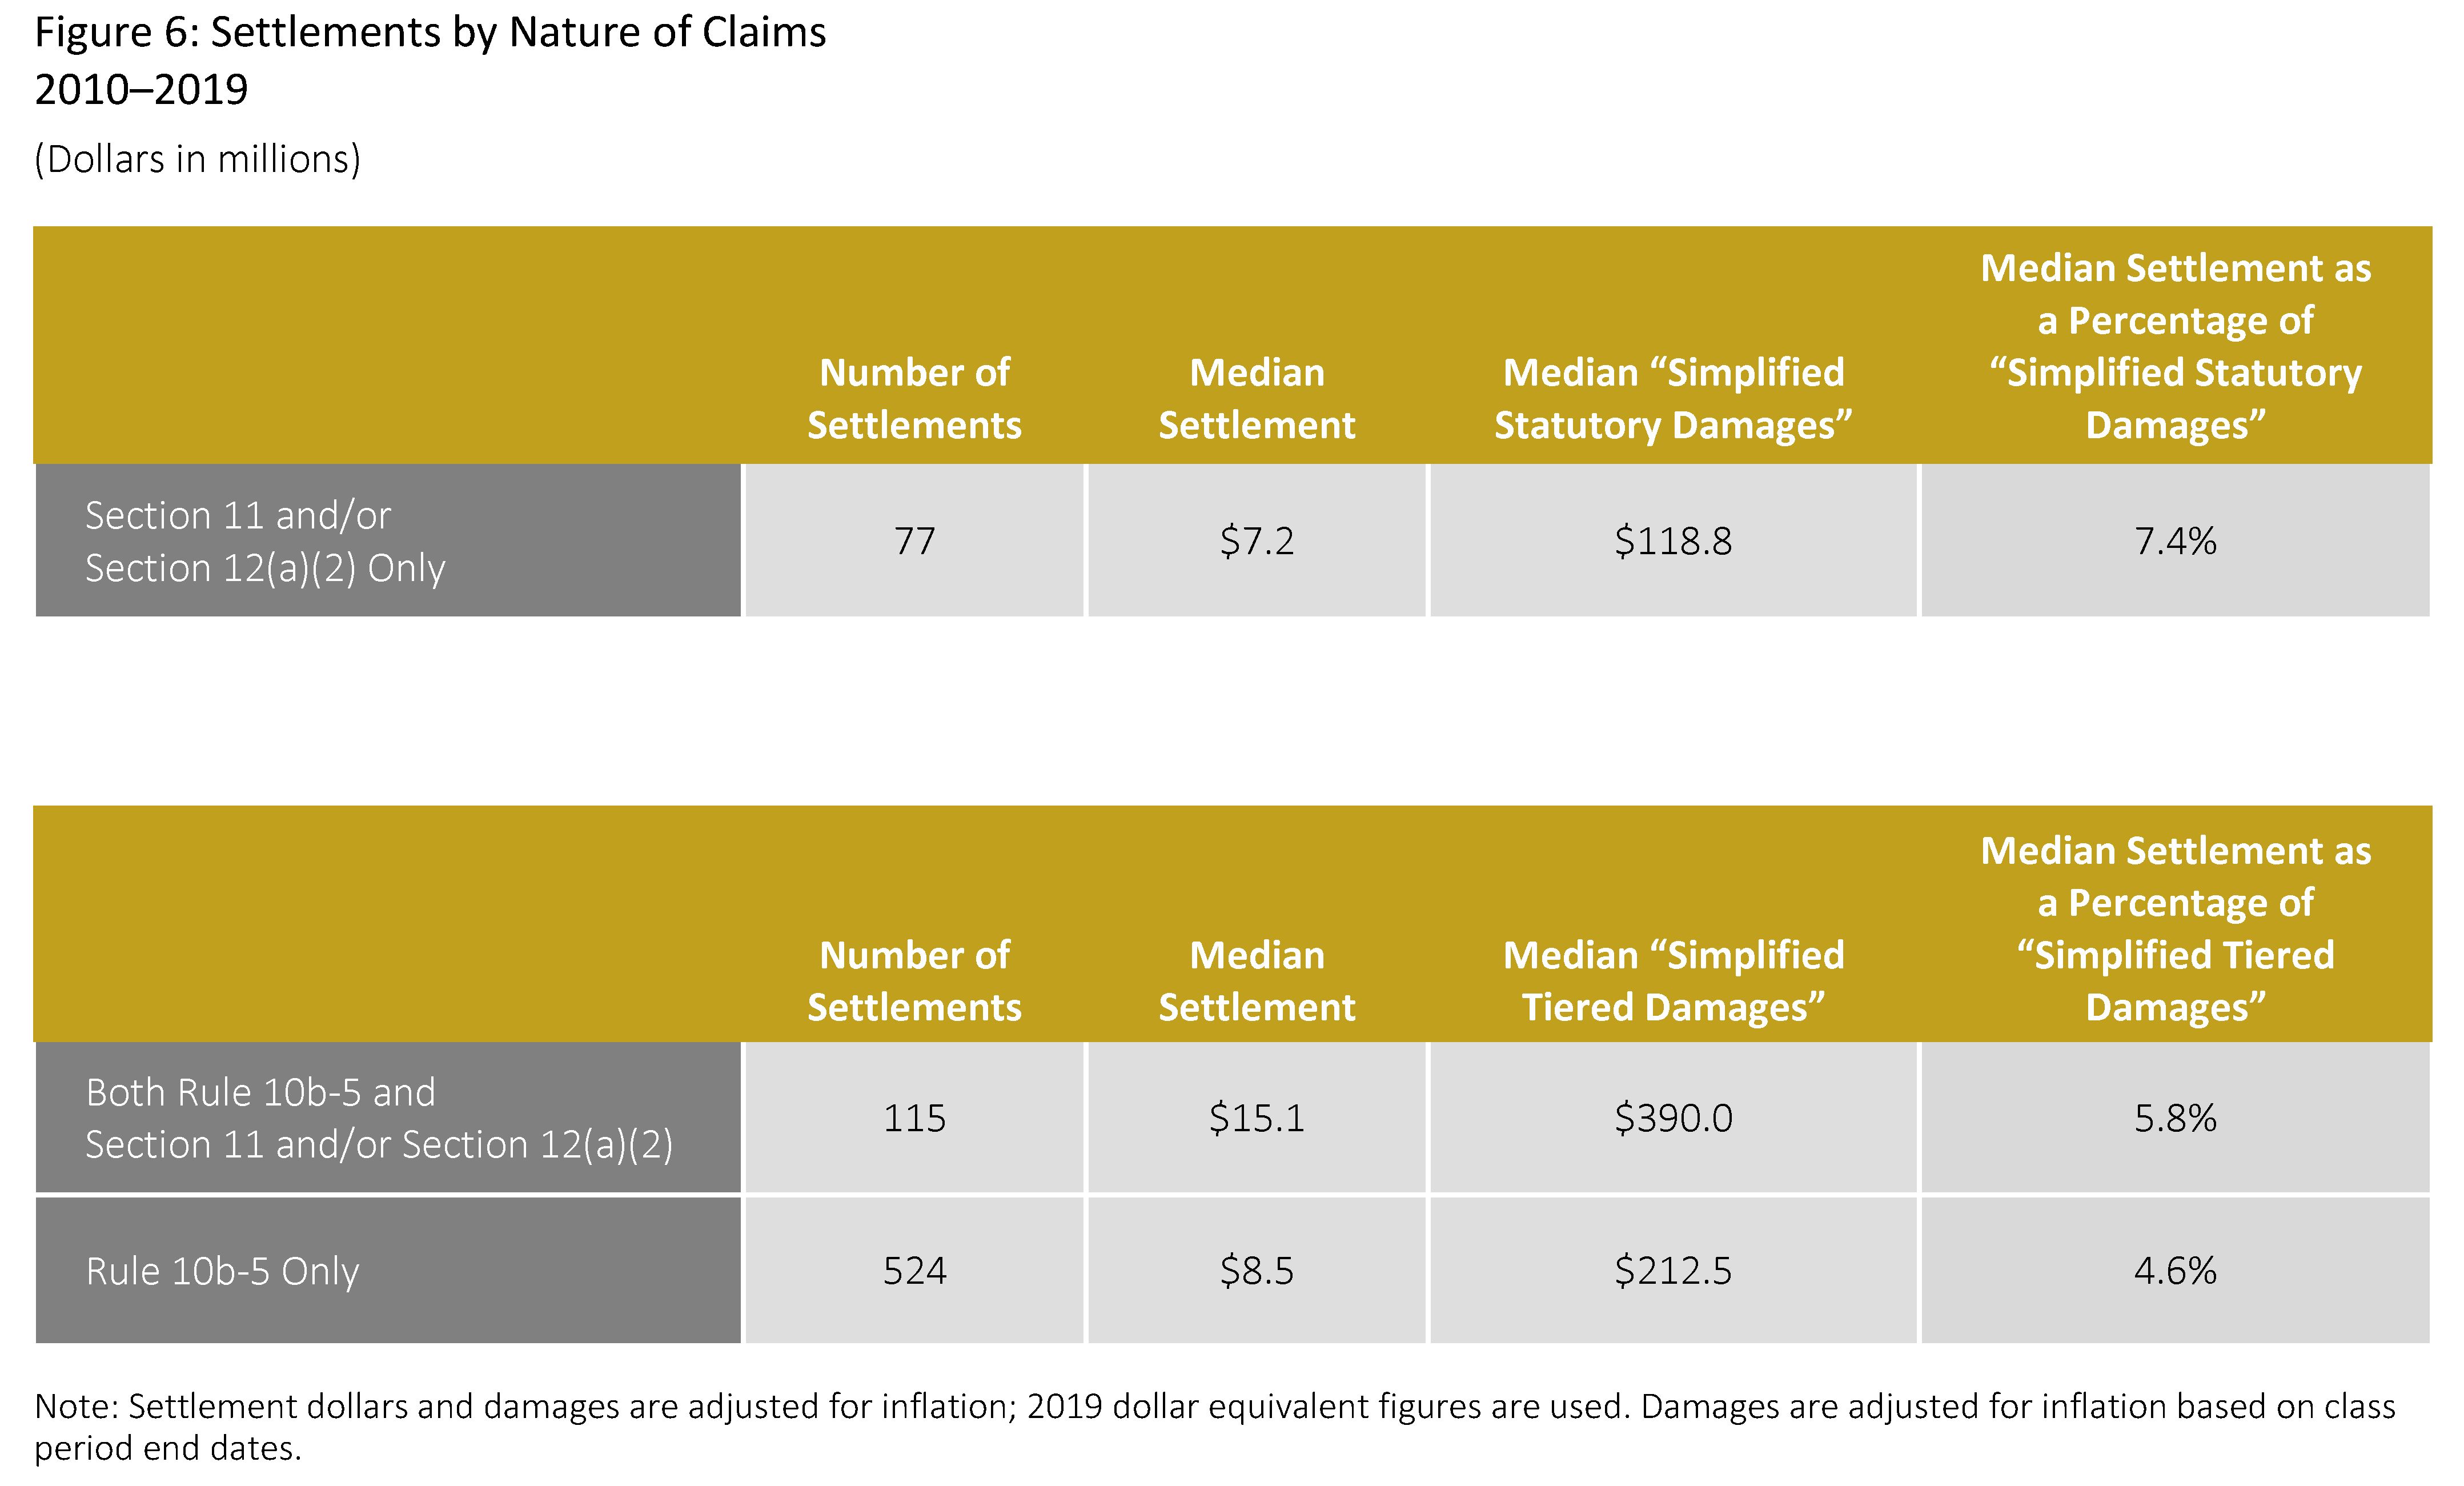
“Simplified statutory damages” are typically smaller than “simplified tiered damages,” reflecting differences in the methodologies used to estimate alleged inflation per share, as well as differences in the shares eligible to be damaged (i.e., only offered shares are included).
- Cases with only ’33 Act claims tend to settle for smaller median amounts than cases that include Rule 10b-5 claims.
- In 2019, among settlements involving ’33 Act claims only, the median time to settlement was only slightly longer than cases involving Rule 10b-5 claims only, 3.2 years and 2.9 years, respectively. When compared to the prior year, however, ’33 Act claim cases took more than 36 percent longer to resolve in 2019 (3.2 years compared to 2.3 years).
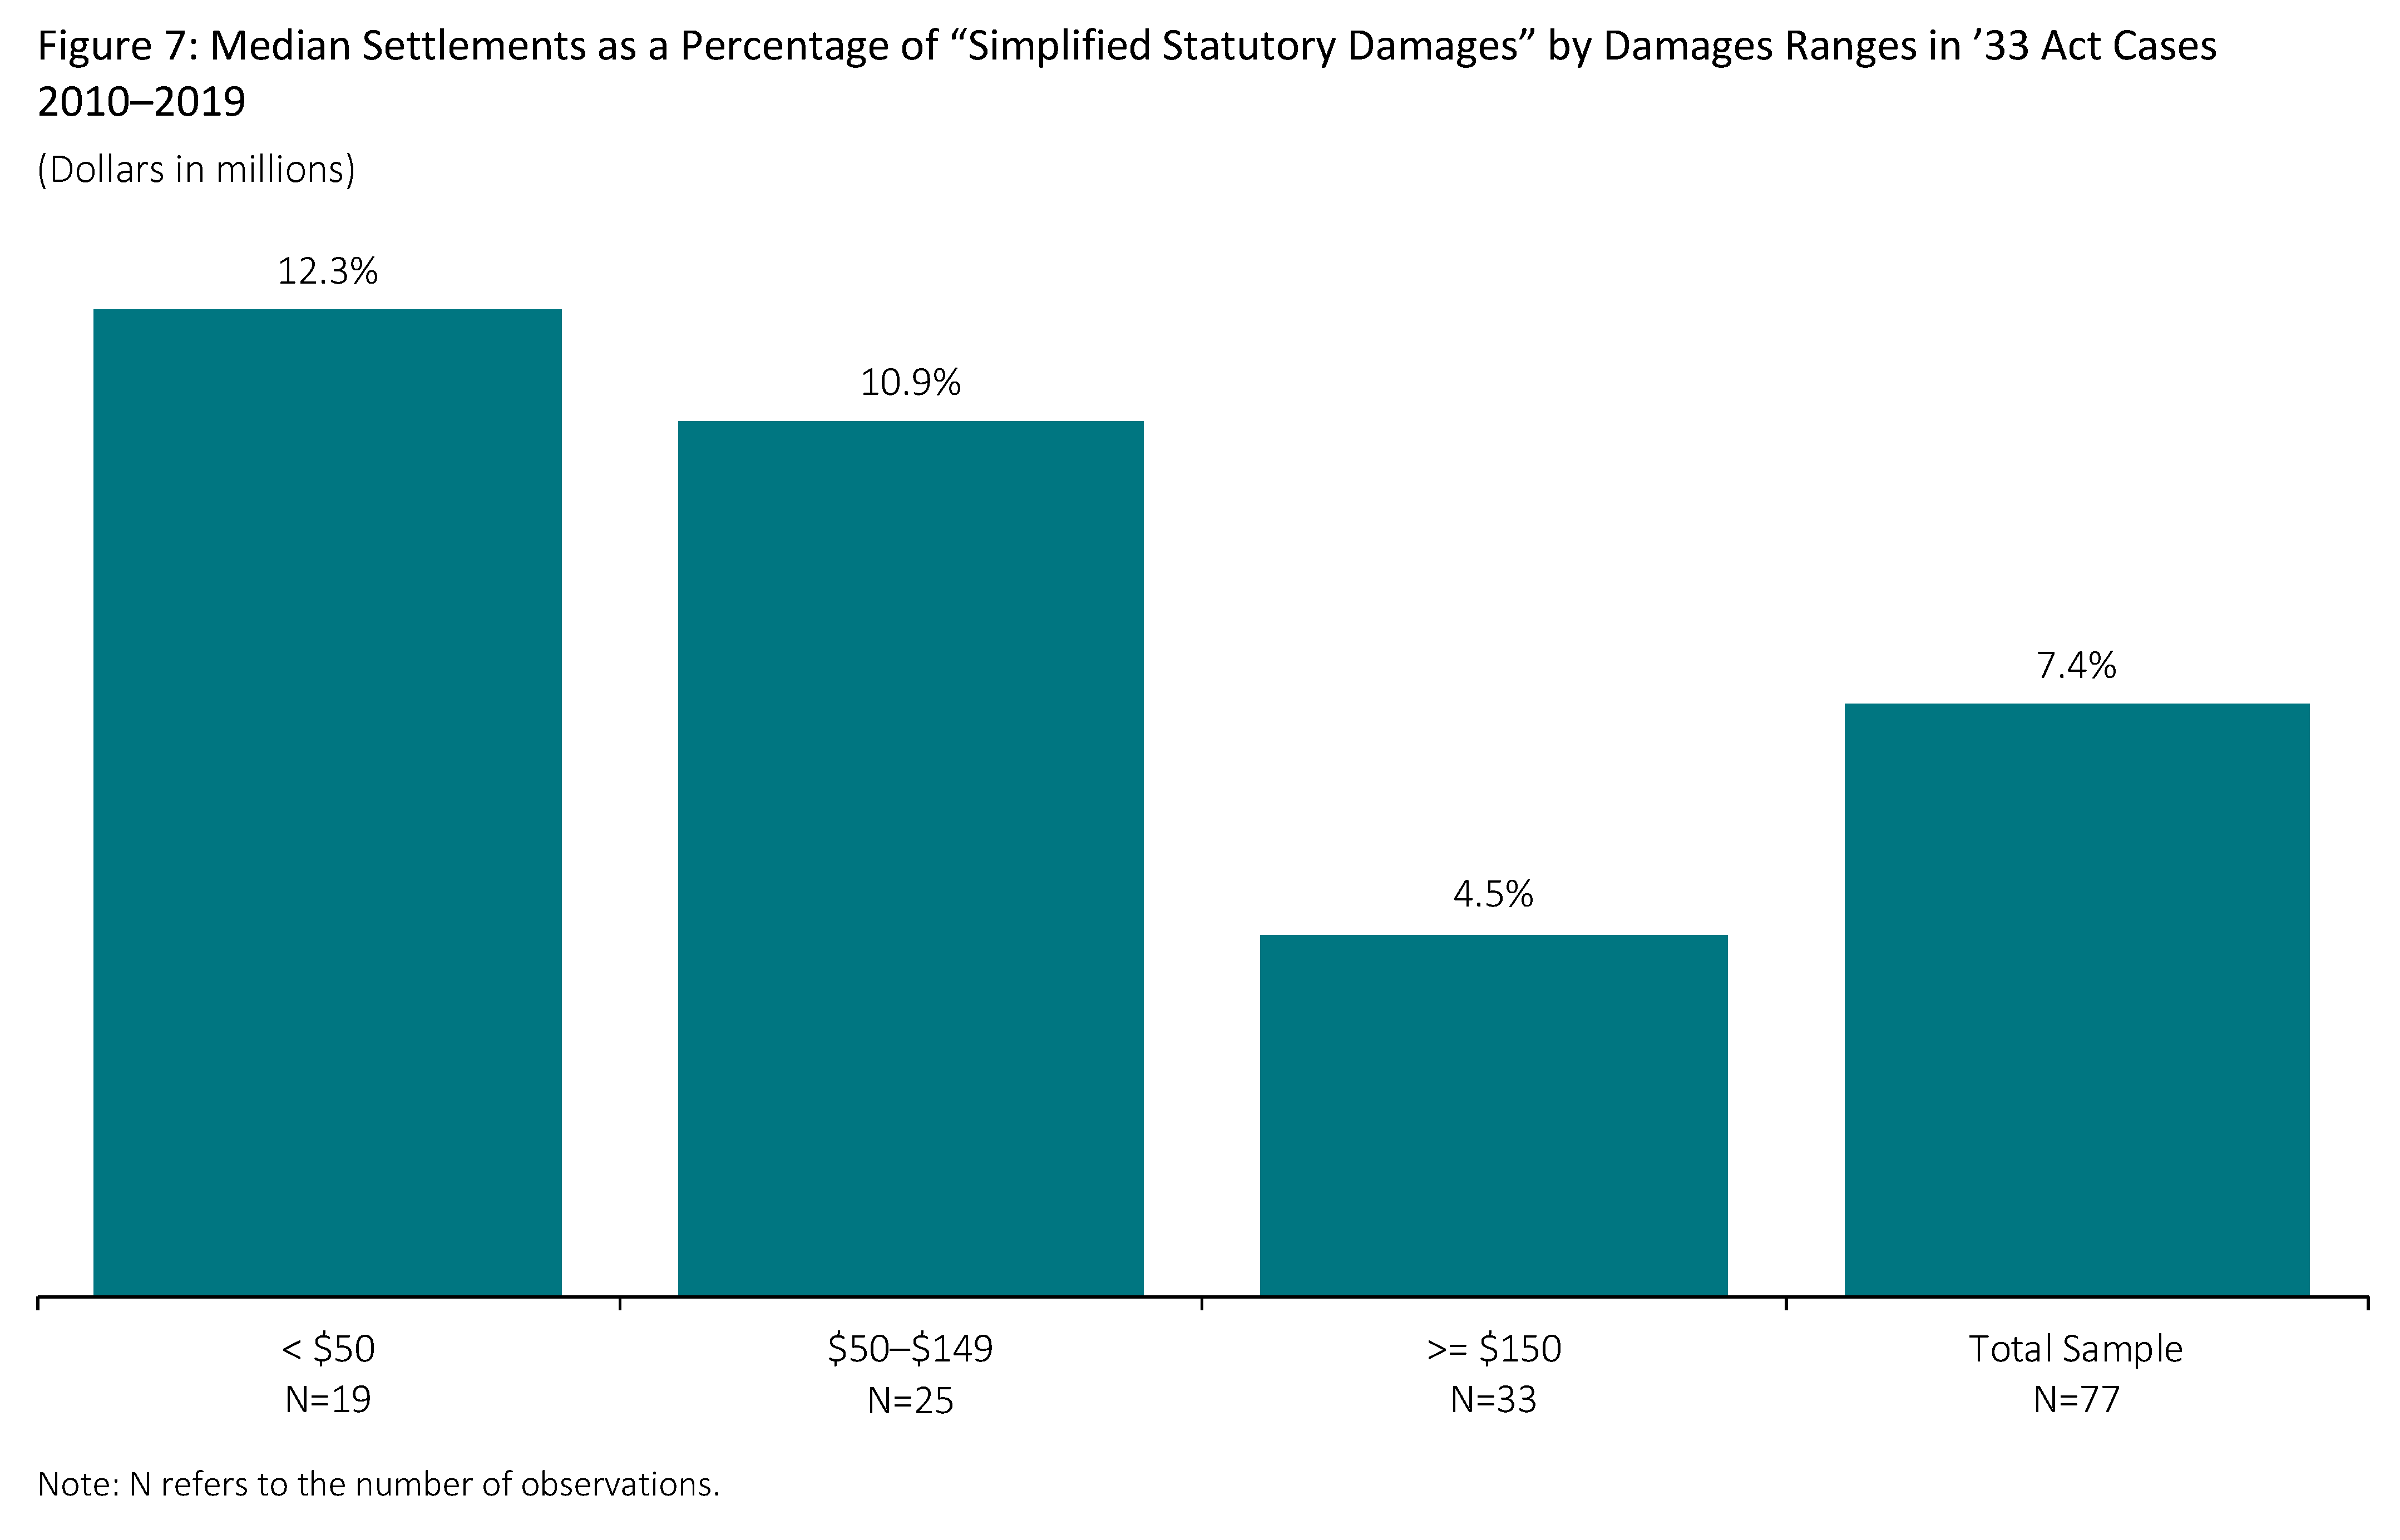
- Settlements as a percentage of “simplified statutory damages” are smaller for cases that have larger estimated damages. This finding holds for cases with ’33 Act claims only, as well as those with Rule 10b-5 claims.
- Over the period 2010–2019, the median size of issuer defendants (measured by total assets) was 68 percent smaller for cases with only ’33 Act claims relative to those that included Rule 10b-5 claims.
- The smaller size of issuer defendants in ’33 Act cases is consistent with the vast majority of these cases involving initial public offerings (IPOs). From 2010 through 2019, 83 percent of all cases with only ’33 Act claims have involved IPOs.
The complete publication, including footnotes, is available here.
