 Print
PrintJames Garriga and Alex Yu are Consultants and Steven Knotz is a Principal at FW Cook. This post is based on their FW Cook report. Related research from the Program on Corporate Governance includes Paying for Long-Term Performance by Lucian Bebchuk and Jesse Fried (discussed on the Forum here).
Introduction
Fair Value Transfer
Best measure of a company’s aggregate annual long-term incentive grant levels because it adjusts for differences in cost between LTI grant types
Grant Date Fair Value of All Long-Term Incentive Awards Made During Year
________________________________________________________
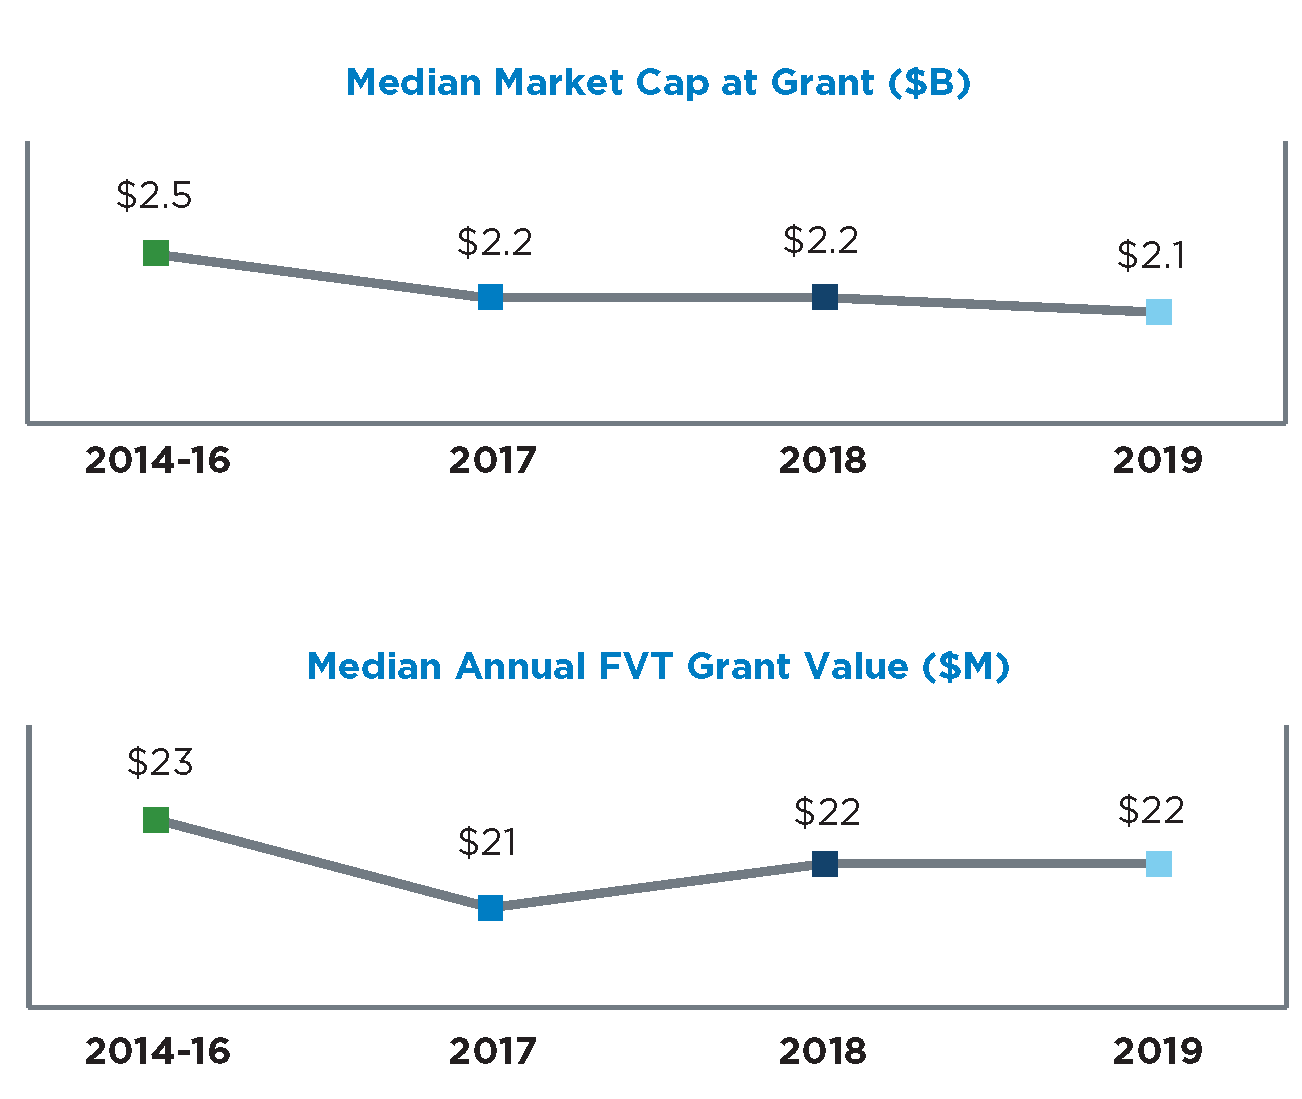
Company Market Capitalization at Grant
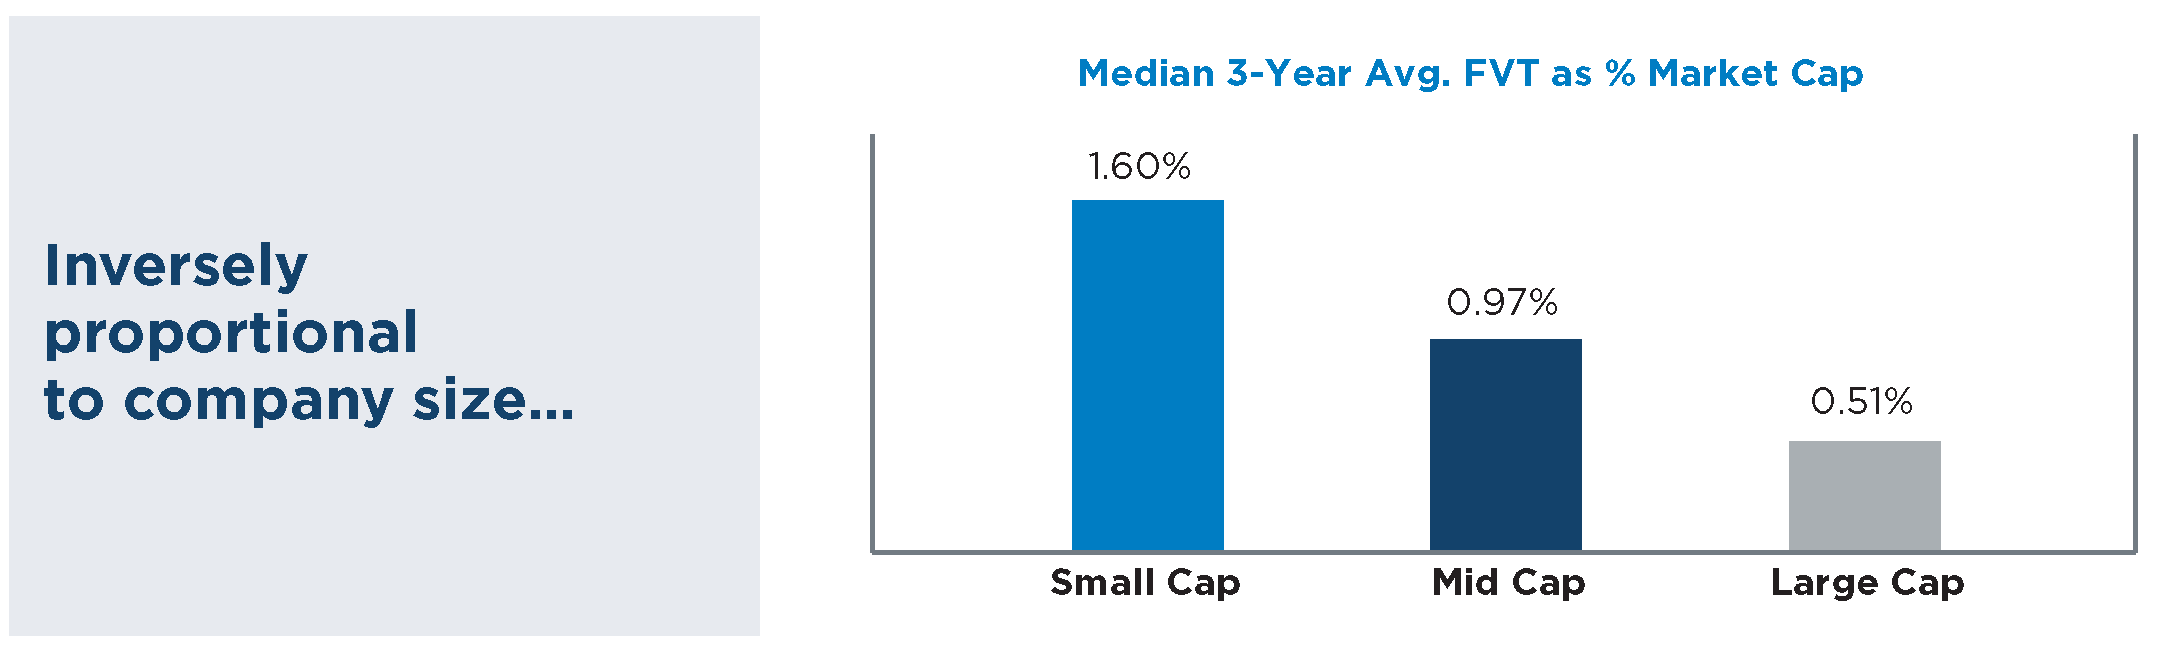
Inversely proportional to company size…
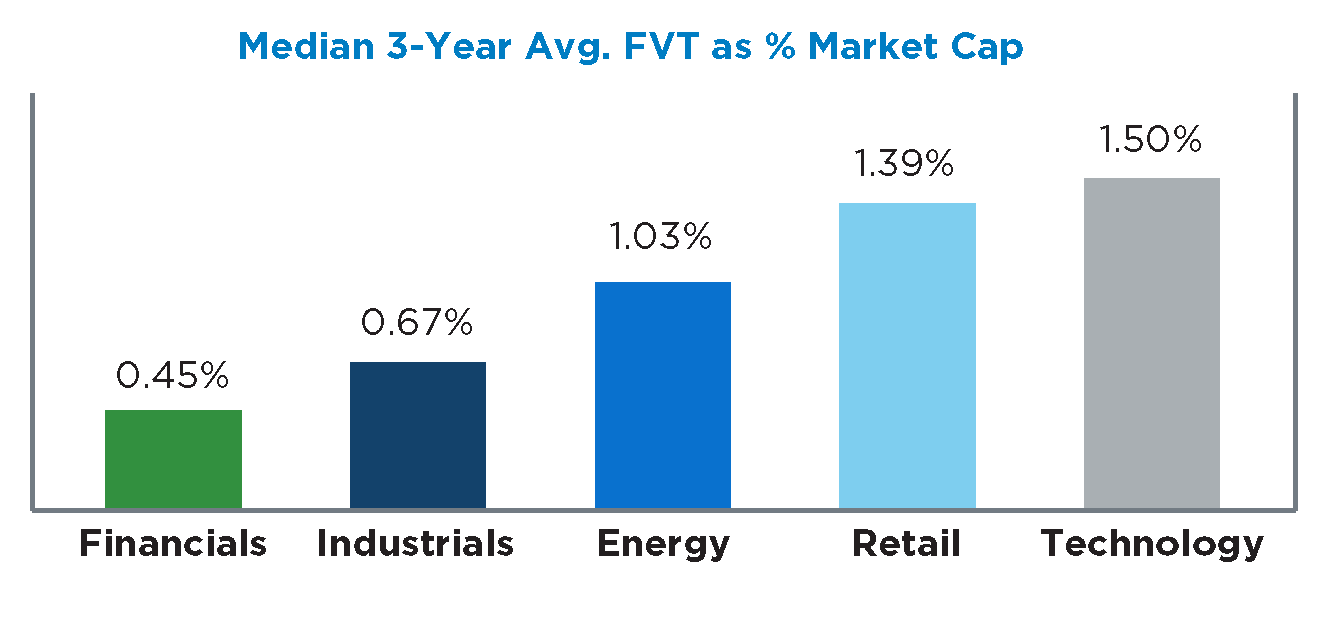
Varies by industry…
Relatively stable over last three years…
Executive Summary
We are pleased to present our fourth study of aggregate share-based compensation. This post covers the three-year period from 2017 to 2019, and includes the following:
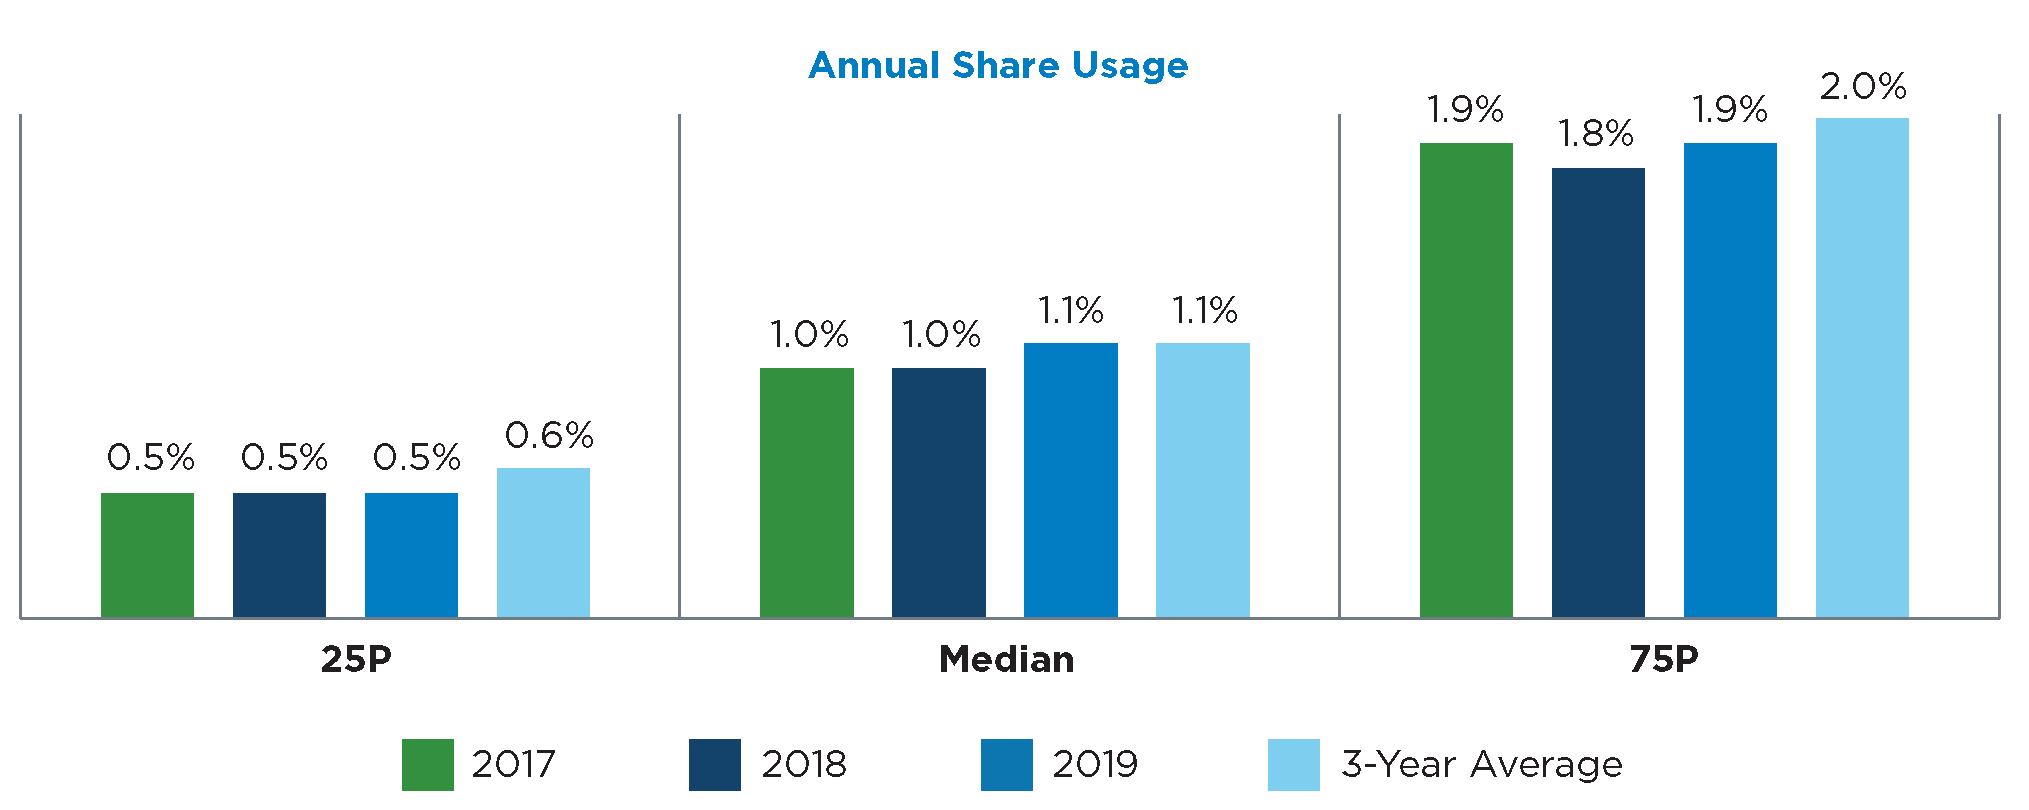
- Company-wide annual grant rates, measured based on annual share usage and fair value transfer (“FVT”).
- Annual share usage is the number of shares granted during a given year as a percentage of weighted average basic common shares outstanding.
- Fair value transfer is the aggregate grant date fair value of all long-term incentive awards granted during a given year as a percentage of company market capitalization value at grant and as a percent of revenue.
- Overhang, measured based on potential share dilution as well as the fair value of outstanding grants.
- Frequency and prevalence of long-term incentive plan share requests.
- Allocation of long-term incentive pools to the CEO and other proxy officers (“Top 5”).
Our research focused on 300 companies spread across five industry groups. This is generally the same sample of companies studied in our 2017 aggregate share-based compensation report (our most recent prior report, covering 2014 to 2016). Companies that were not available due to acquisitions or had grown / contracted outside the sample size range, were replaced by randomly selected companies in each size and industry category. The key findings of our 2020 aggregate share-based compensation study are shown below.
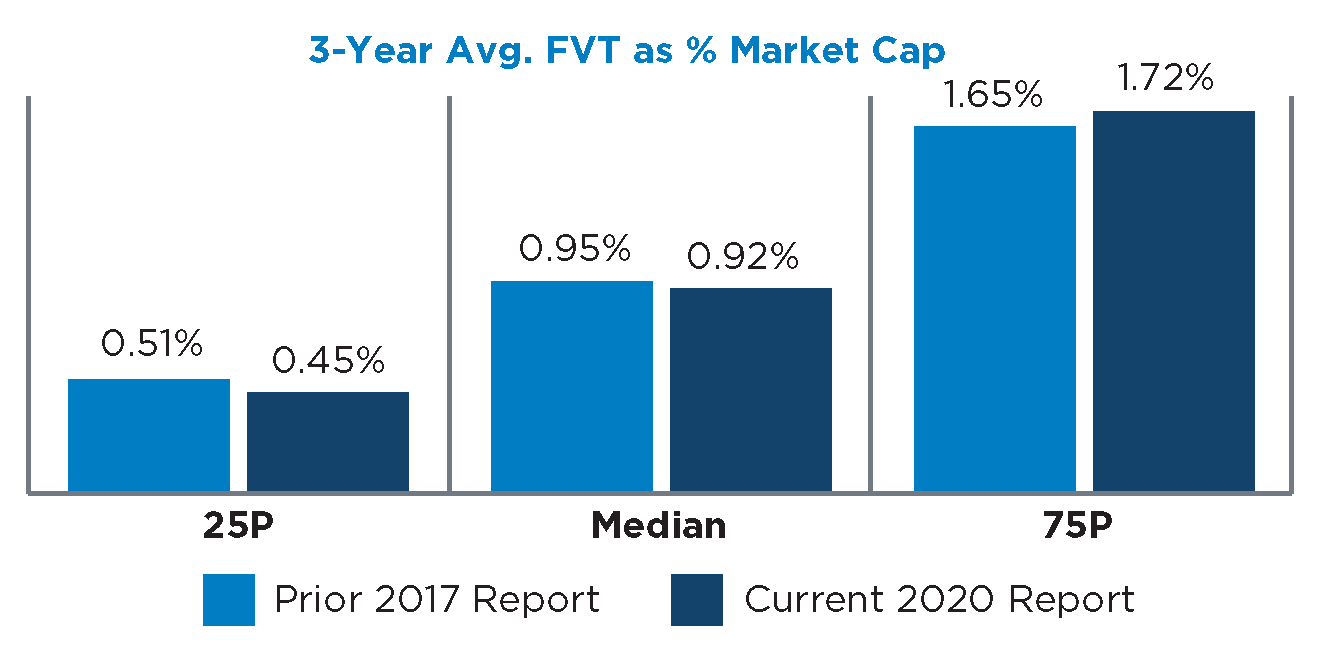
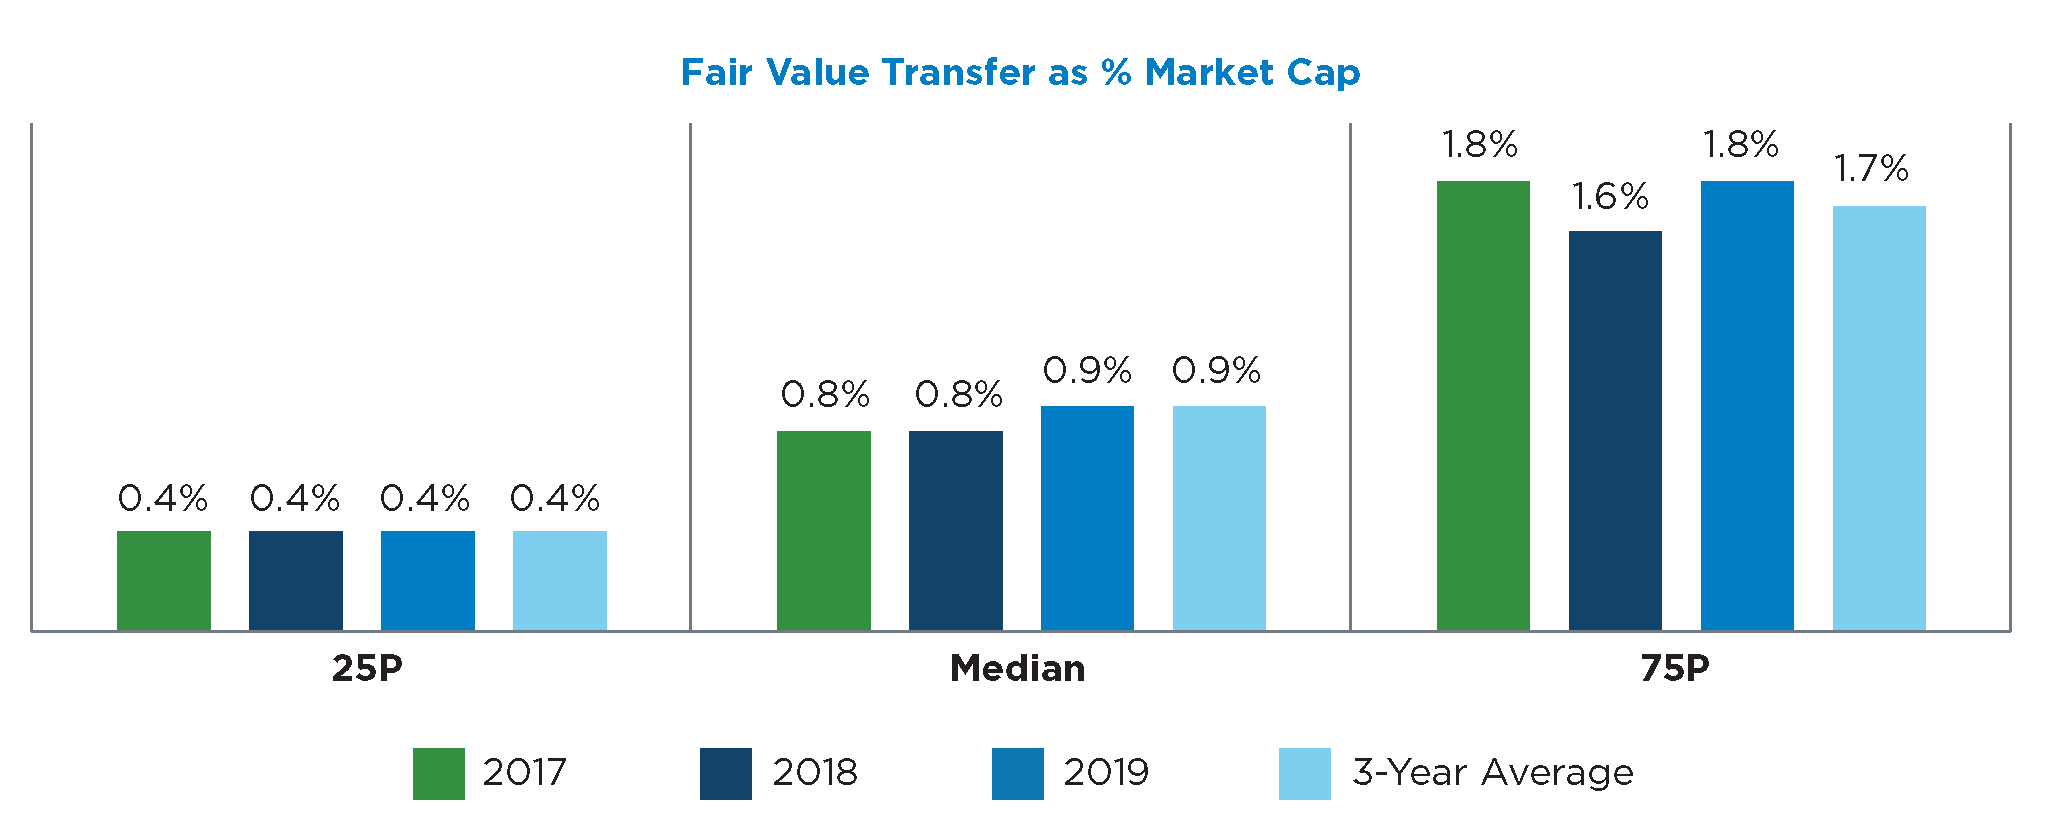
Annual Fair Value Transfer (Grant Date Fair Value as % Market Cap at Grant)
Annual fair value transfer rates as a percentage of market capitalization were generally stable compared to our prior 2017 study, with the median 3-year average annual rate decreasing from 0.95% in the prior study to 0.92% in the current study.

FVT rates decreased slightly for 2018 compared to 2017, followed by an increase in FVT rates for 2019 compared to 2018.
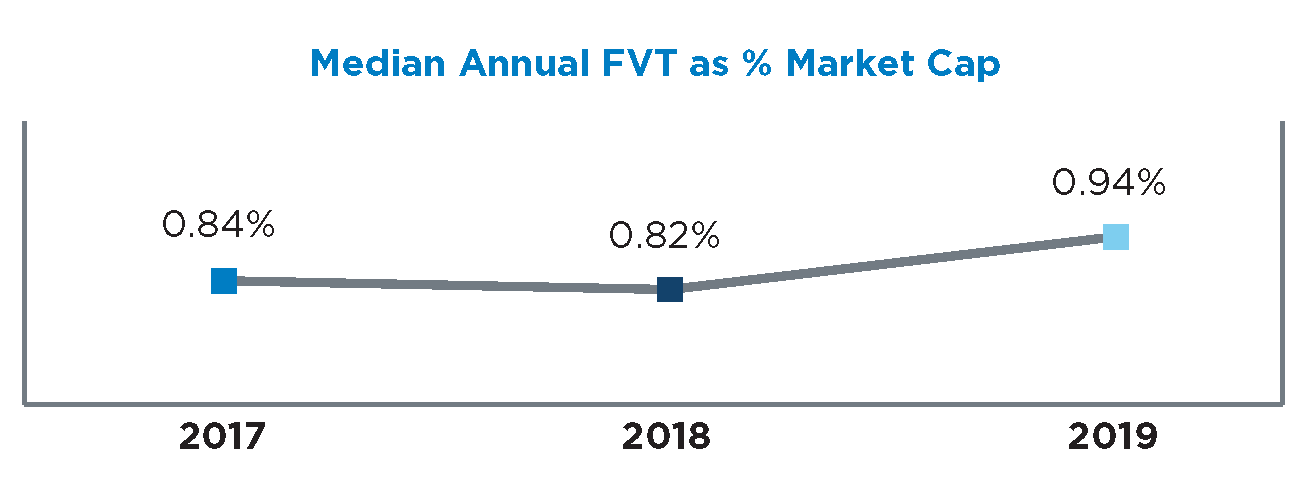
- Median market capitalization at grant and median annual FVT grant value have been generally
stable the last three years. - Continues a trend observed in our prior study.
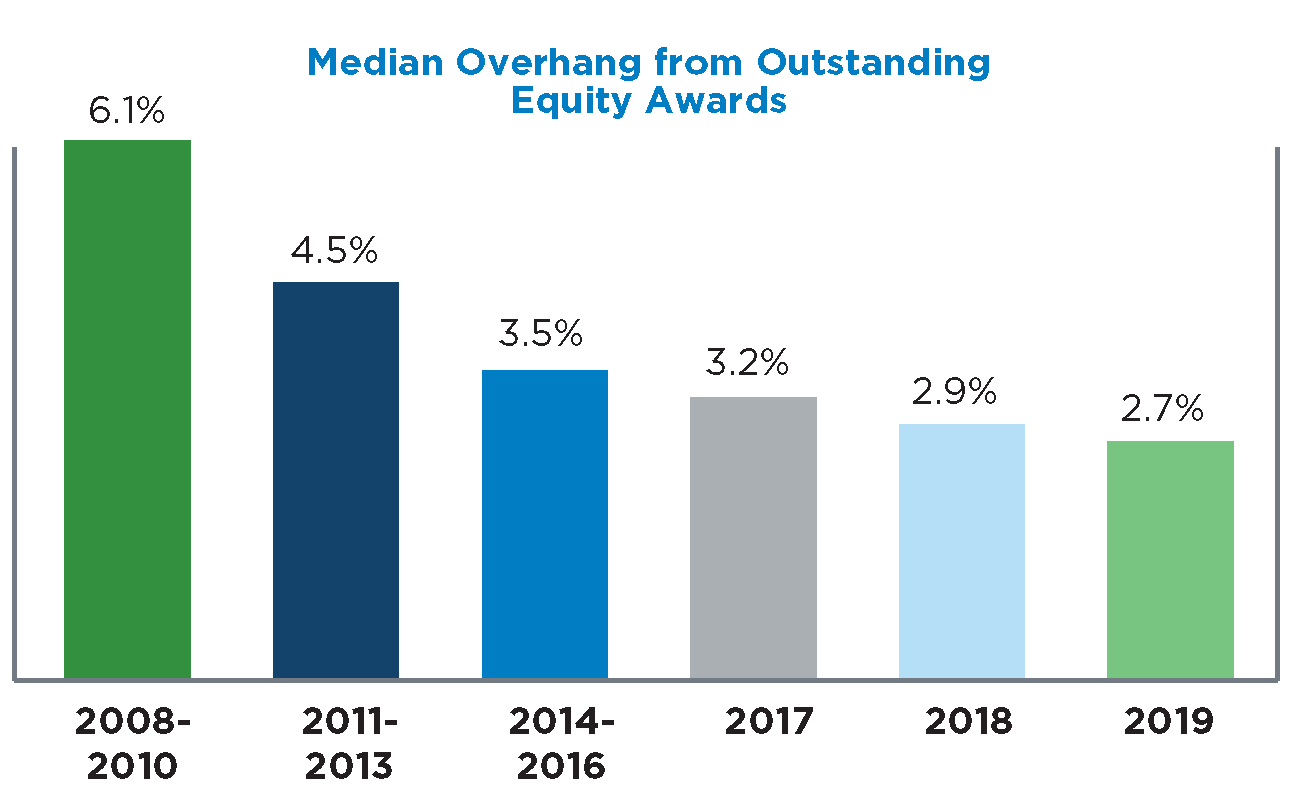
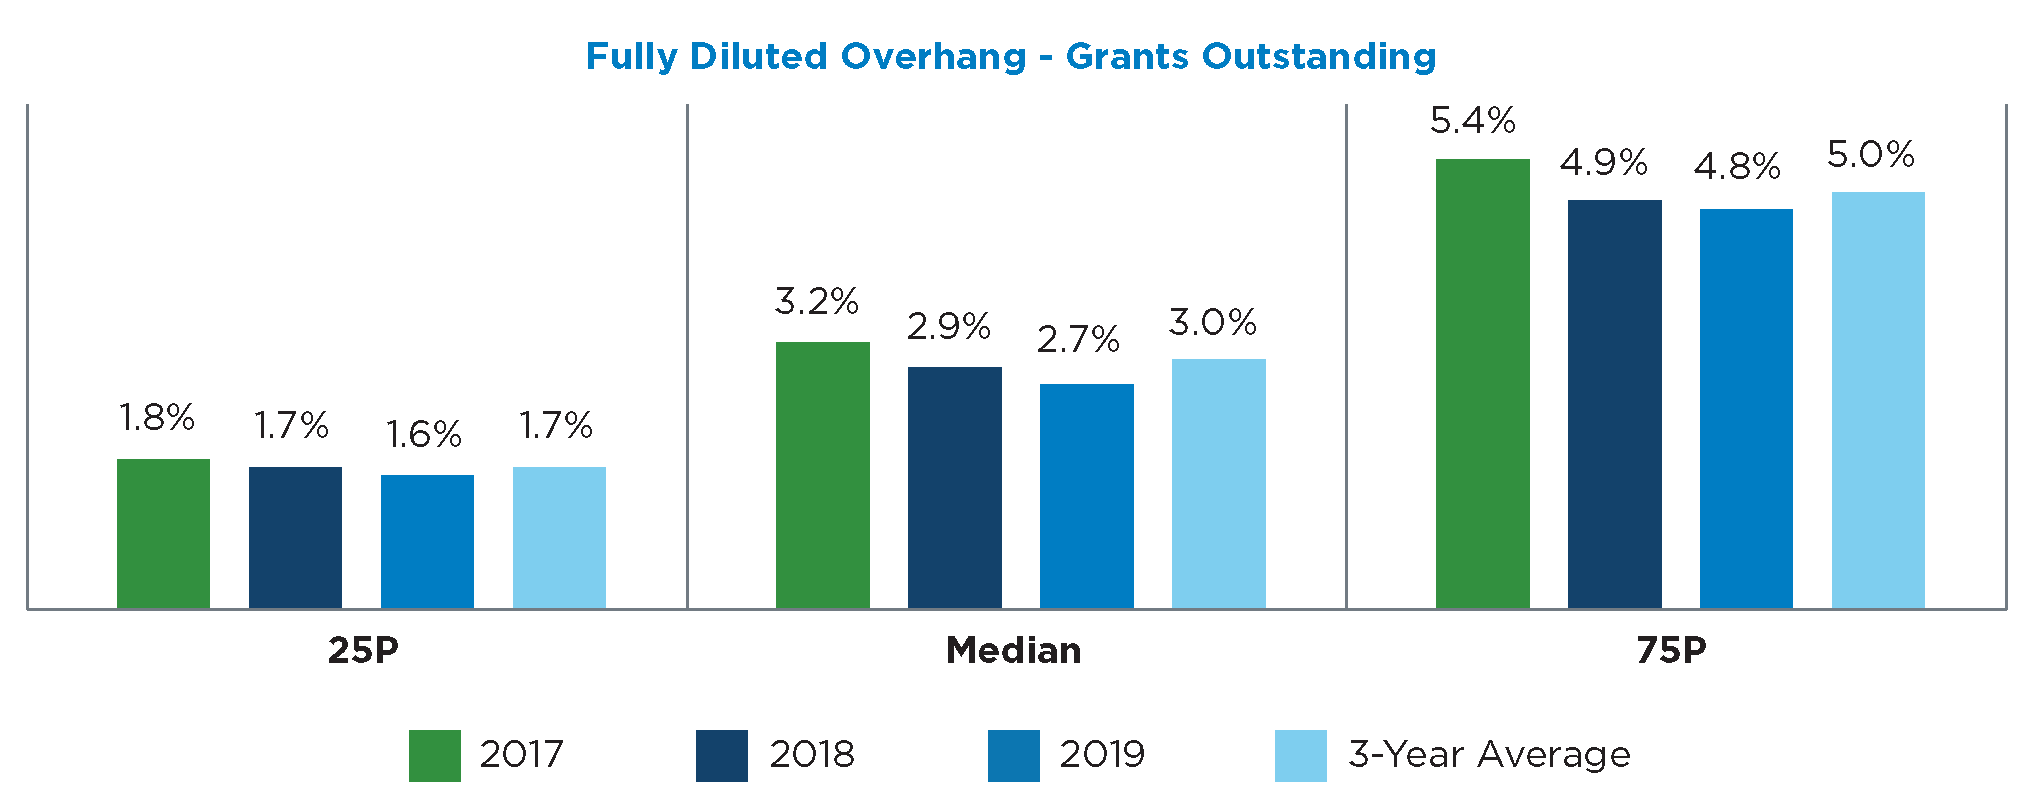
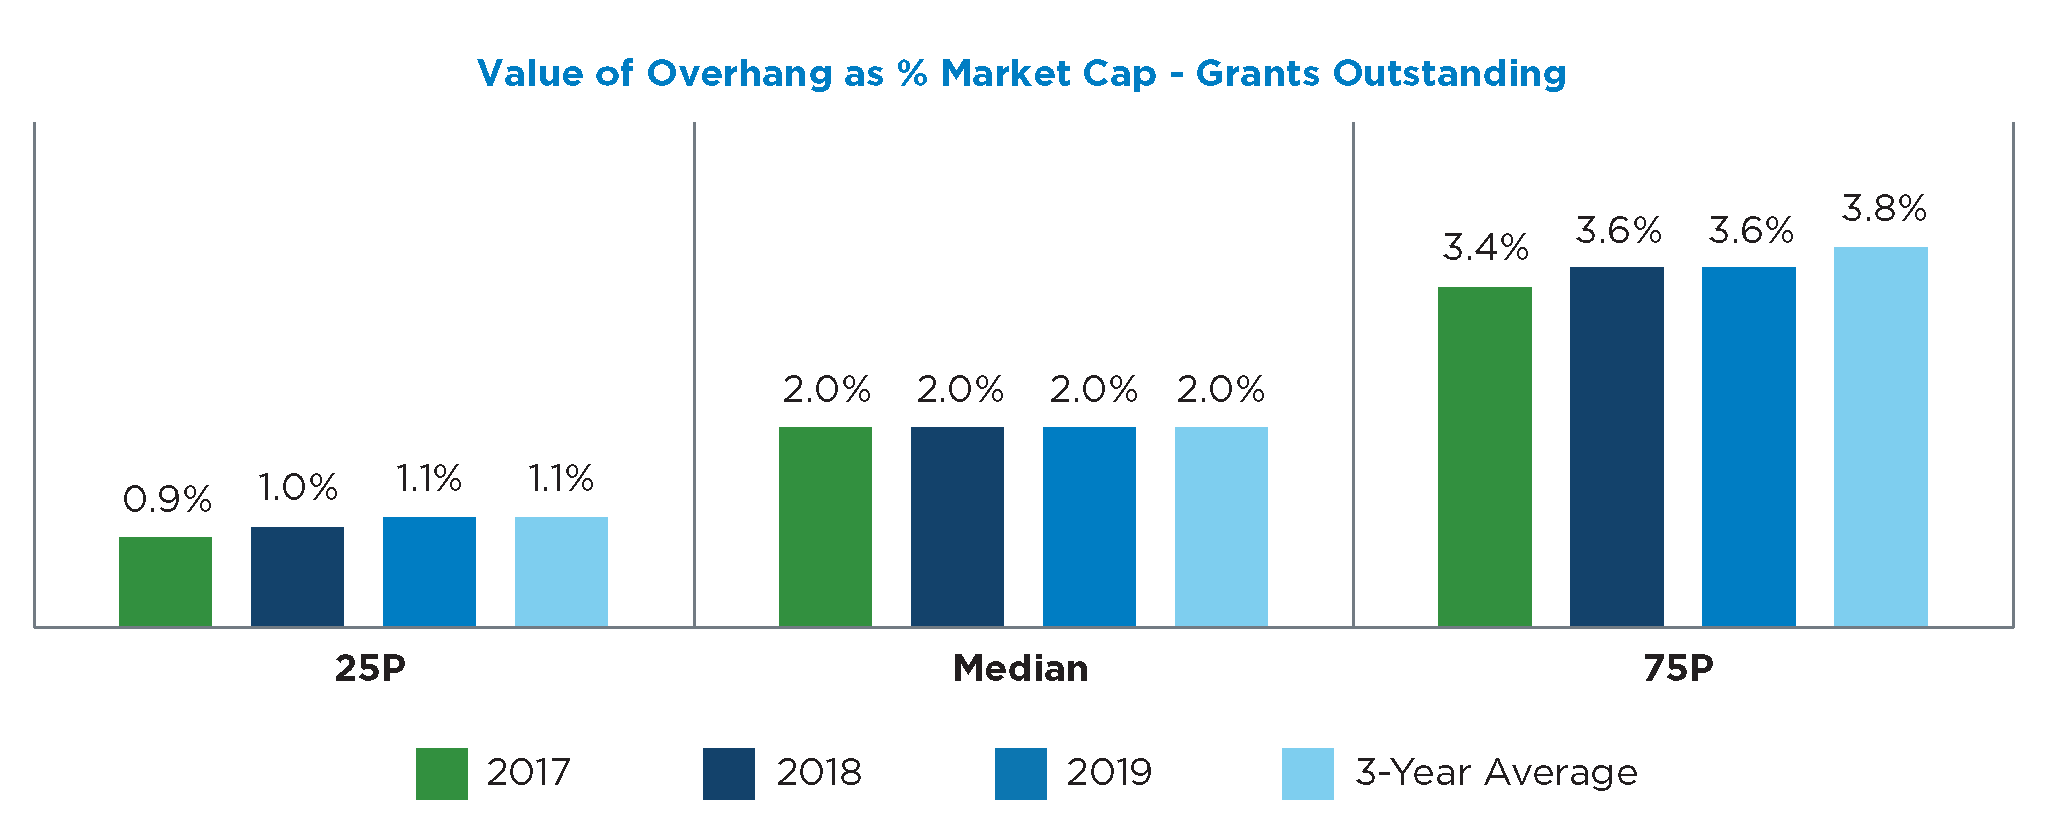
Overhang
- Potential dilution from outstanding equity awards has trended downward over the last
three years, falling from 3.2% at the median in 2017 to 2.7% in 2019. - Continues a trend observed over the last twelve years in our previous three studies.
- Driven by companies granting a greater proportion of equity awards in the form of restricted
and performance shares, which generally use fewer shares than stock options for equivalent
grant value and remain outstanding for far shorter periods of time.
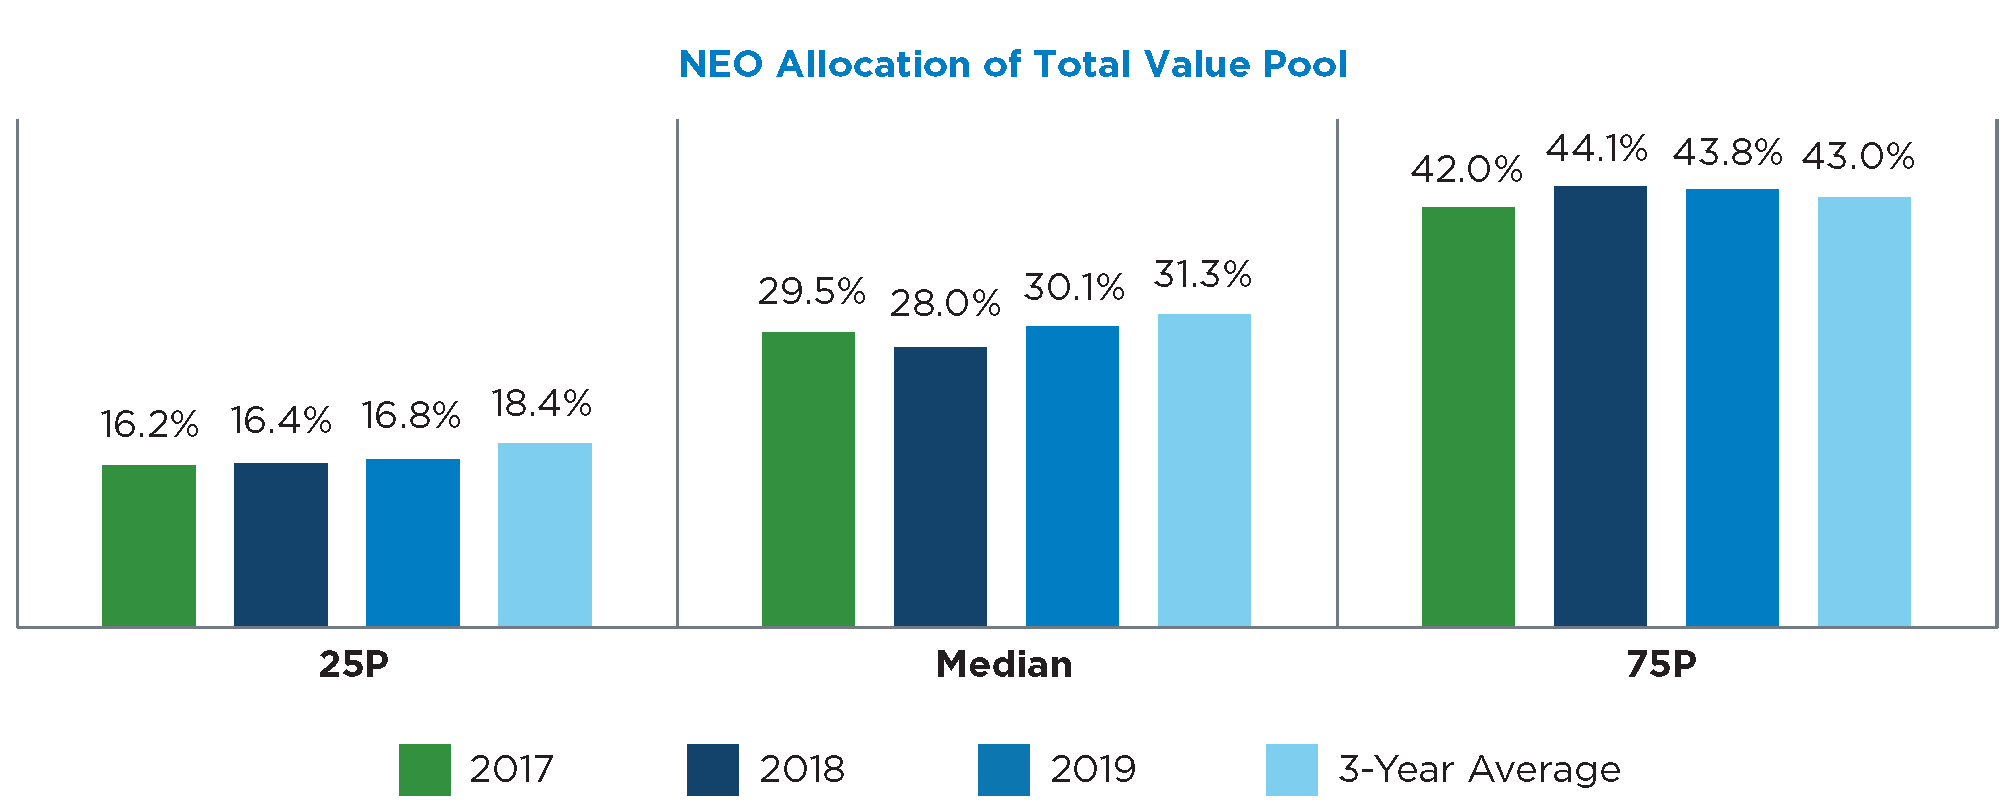
Allocation of Long-Term Incentives
- Allocation of the long-term incentive pool to the CEO and to the Top 5 proxy-reported
officers is closely linked to company size, as small-cap companies grant a significantly higher percentage of the overall pool to their top officers compared to large-cap companies, who generally have more long-term incentive participants. - Technology companies continue to have the lowest concentration of awards granted to the CEO and the Top 5 proxy-reported officers, reflecting traditionally broad-based equity participation in this industry.

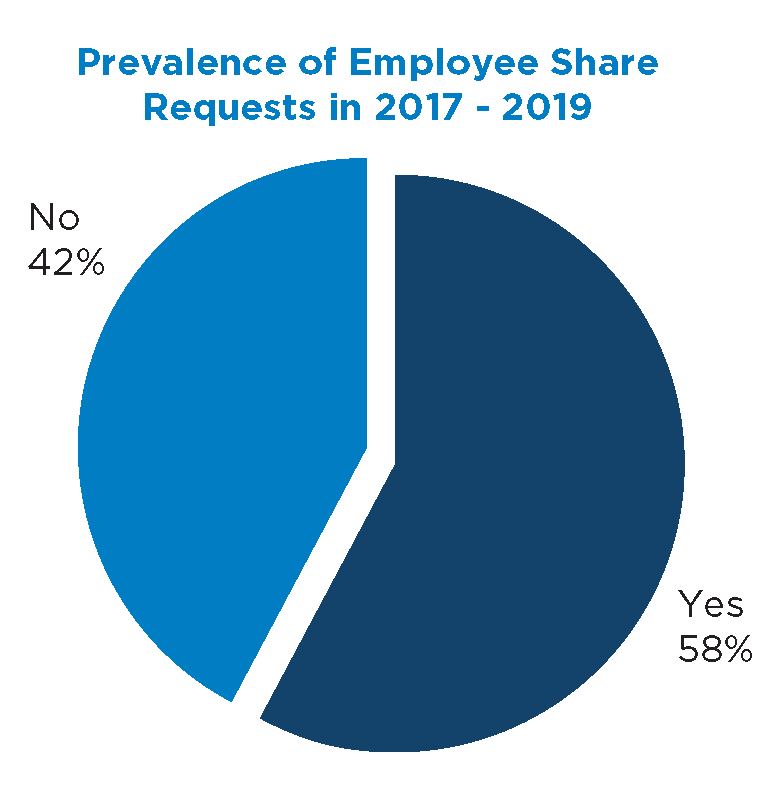
Share Requests
- Over the last three years, 58% of our sample companies sought shareholder approval of a new
employee stock plan share authorization. - The median size of the requests was approximately 4% of common shares outstanding, with slight variation based on company size and year of request.
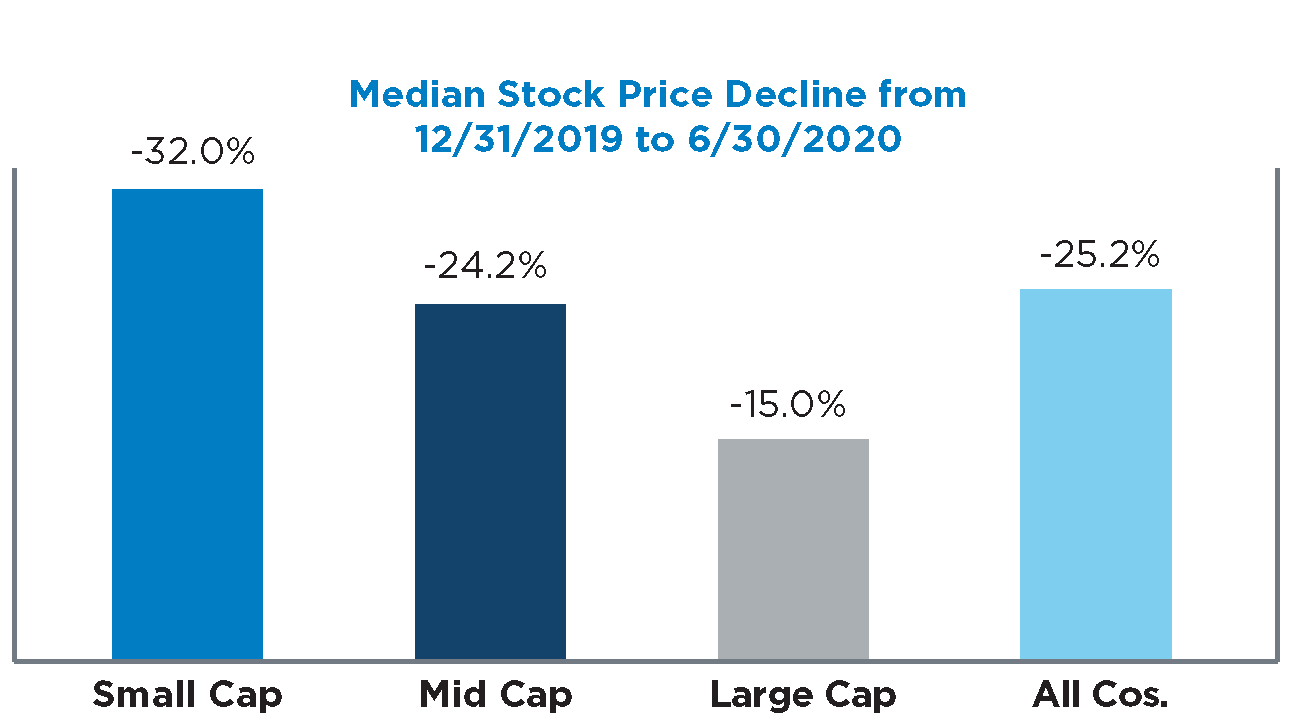
Looking Forward
- If companies face sustained stock price decreases for the remainder of 2020 and into 2021, we would expect to see increased FVT rates as the result of companies granting more shares to offset the market decline.
- For reference, following the market crash of 2008 there was a 22% increase in FVT at the median when comparing grants made in Q1 2009 to Q1 2008.
- In 2009, we observed large cap companies take a “split-the-difference” approach where the number of shares granted was increased to offset half of the decline in grant value due to a lower stock price, whereas small cap companies had a decline in the grant values that was closer to the decline in stock prices.
Overview and Methodology
Research Sample
This study is based on a sample of 300 U.S. public companies equally divided among small-, mid- and large-cap segments (100 companies in each) and further classified into five industries: energy, financials, industrials, retail, and technology (60 companies in each). Industry classifications are based on Standard & Poor’s Global Industry Classification Standard (GICS) Industry Group codes. For a complete list of the companies included in this study, refer to pages 26-28 of the complete publication.
Market capitalization and trailing 12-month revenue as of June 30, 2020 are shown below:

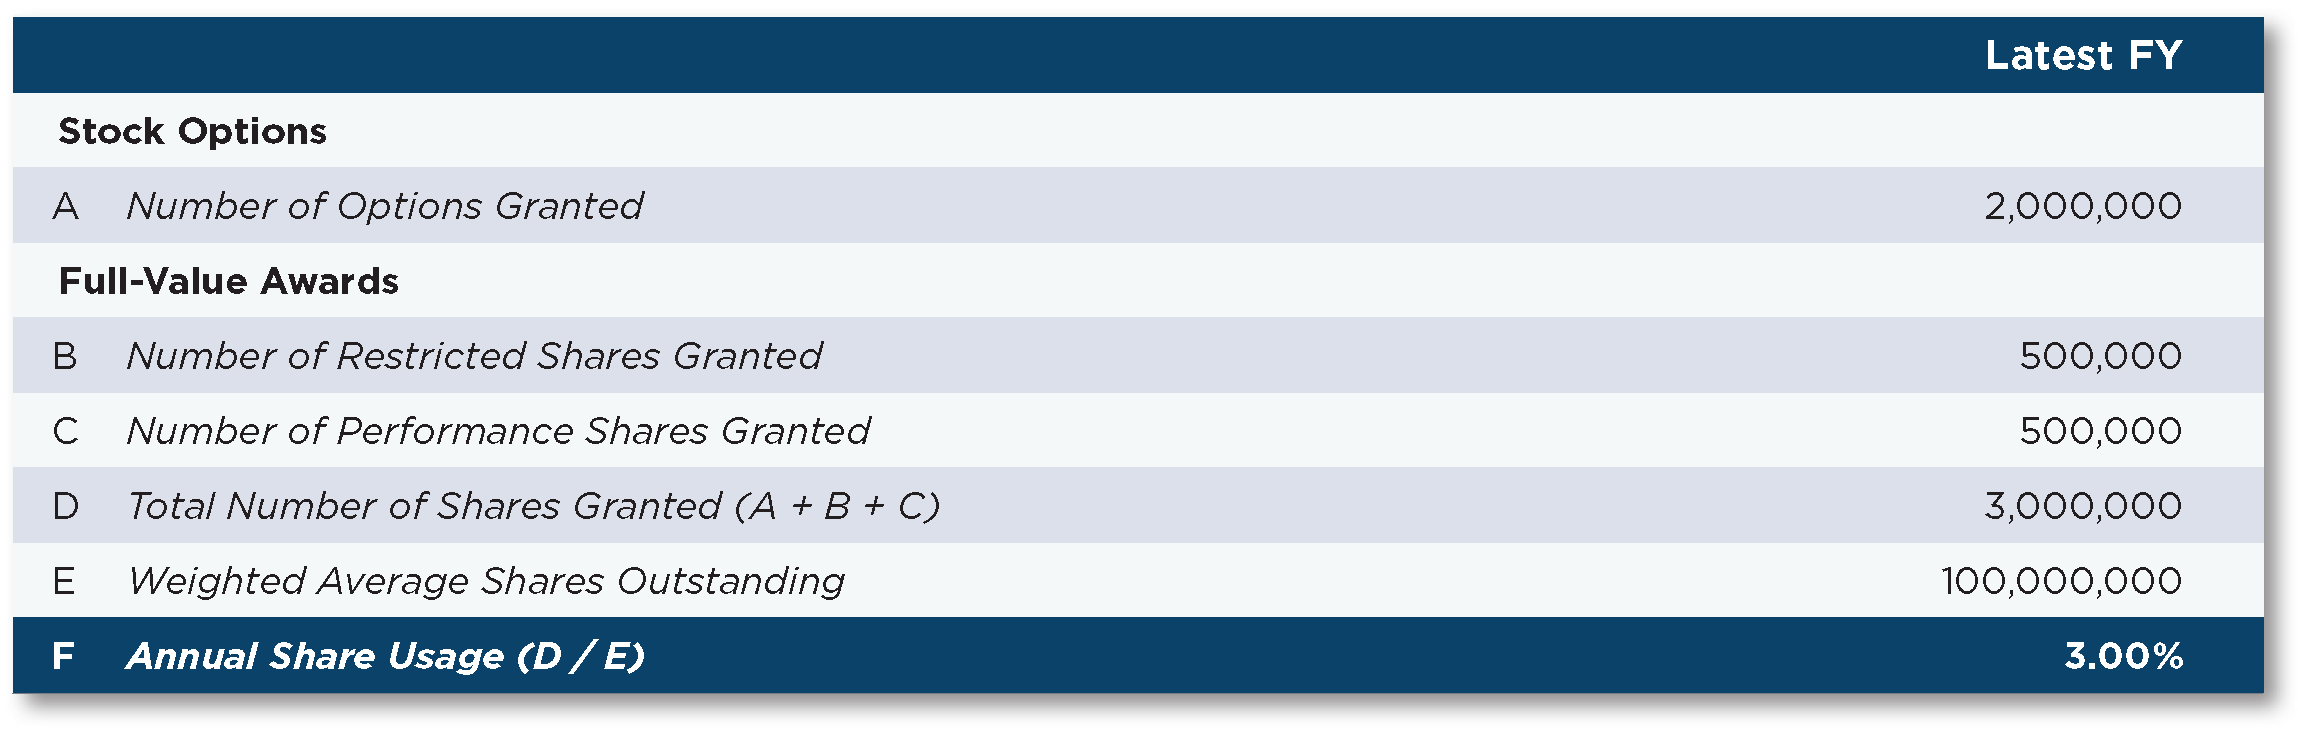
Annual Share Usage
- Measures the company’s annual share usage rate as a percentage of weighted average basic common shares outstanding (i.e., the “run rate” or “burn rate”).
- Unlike other measures such as FVT, does not consider relative differences in cost between stock options and full-value shares such as restricted stock or RSUs.
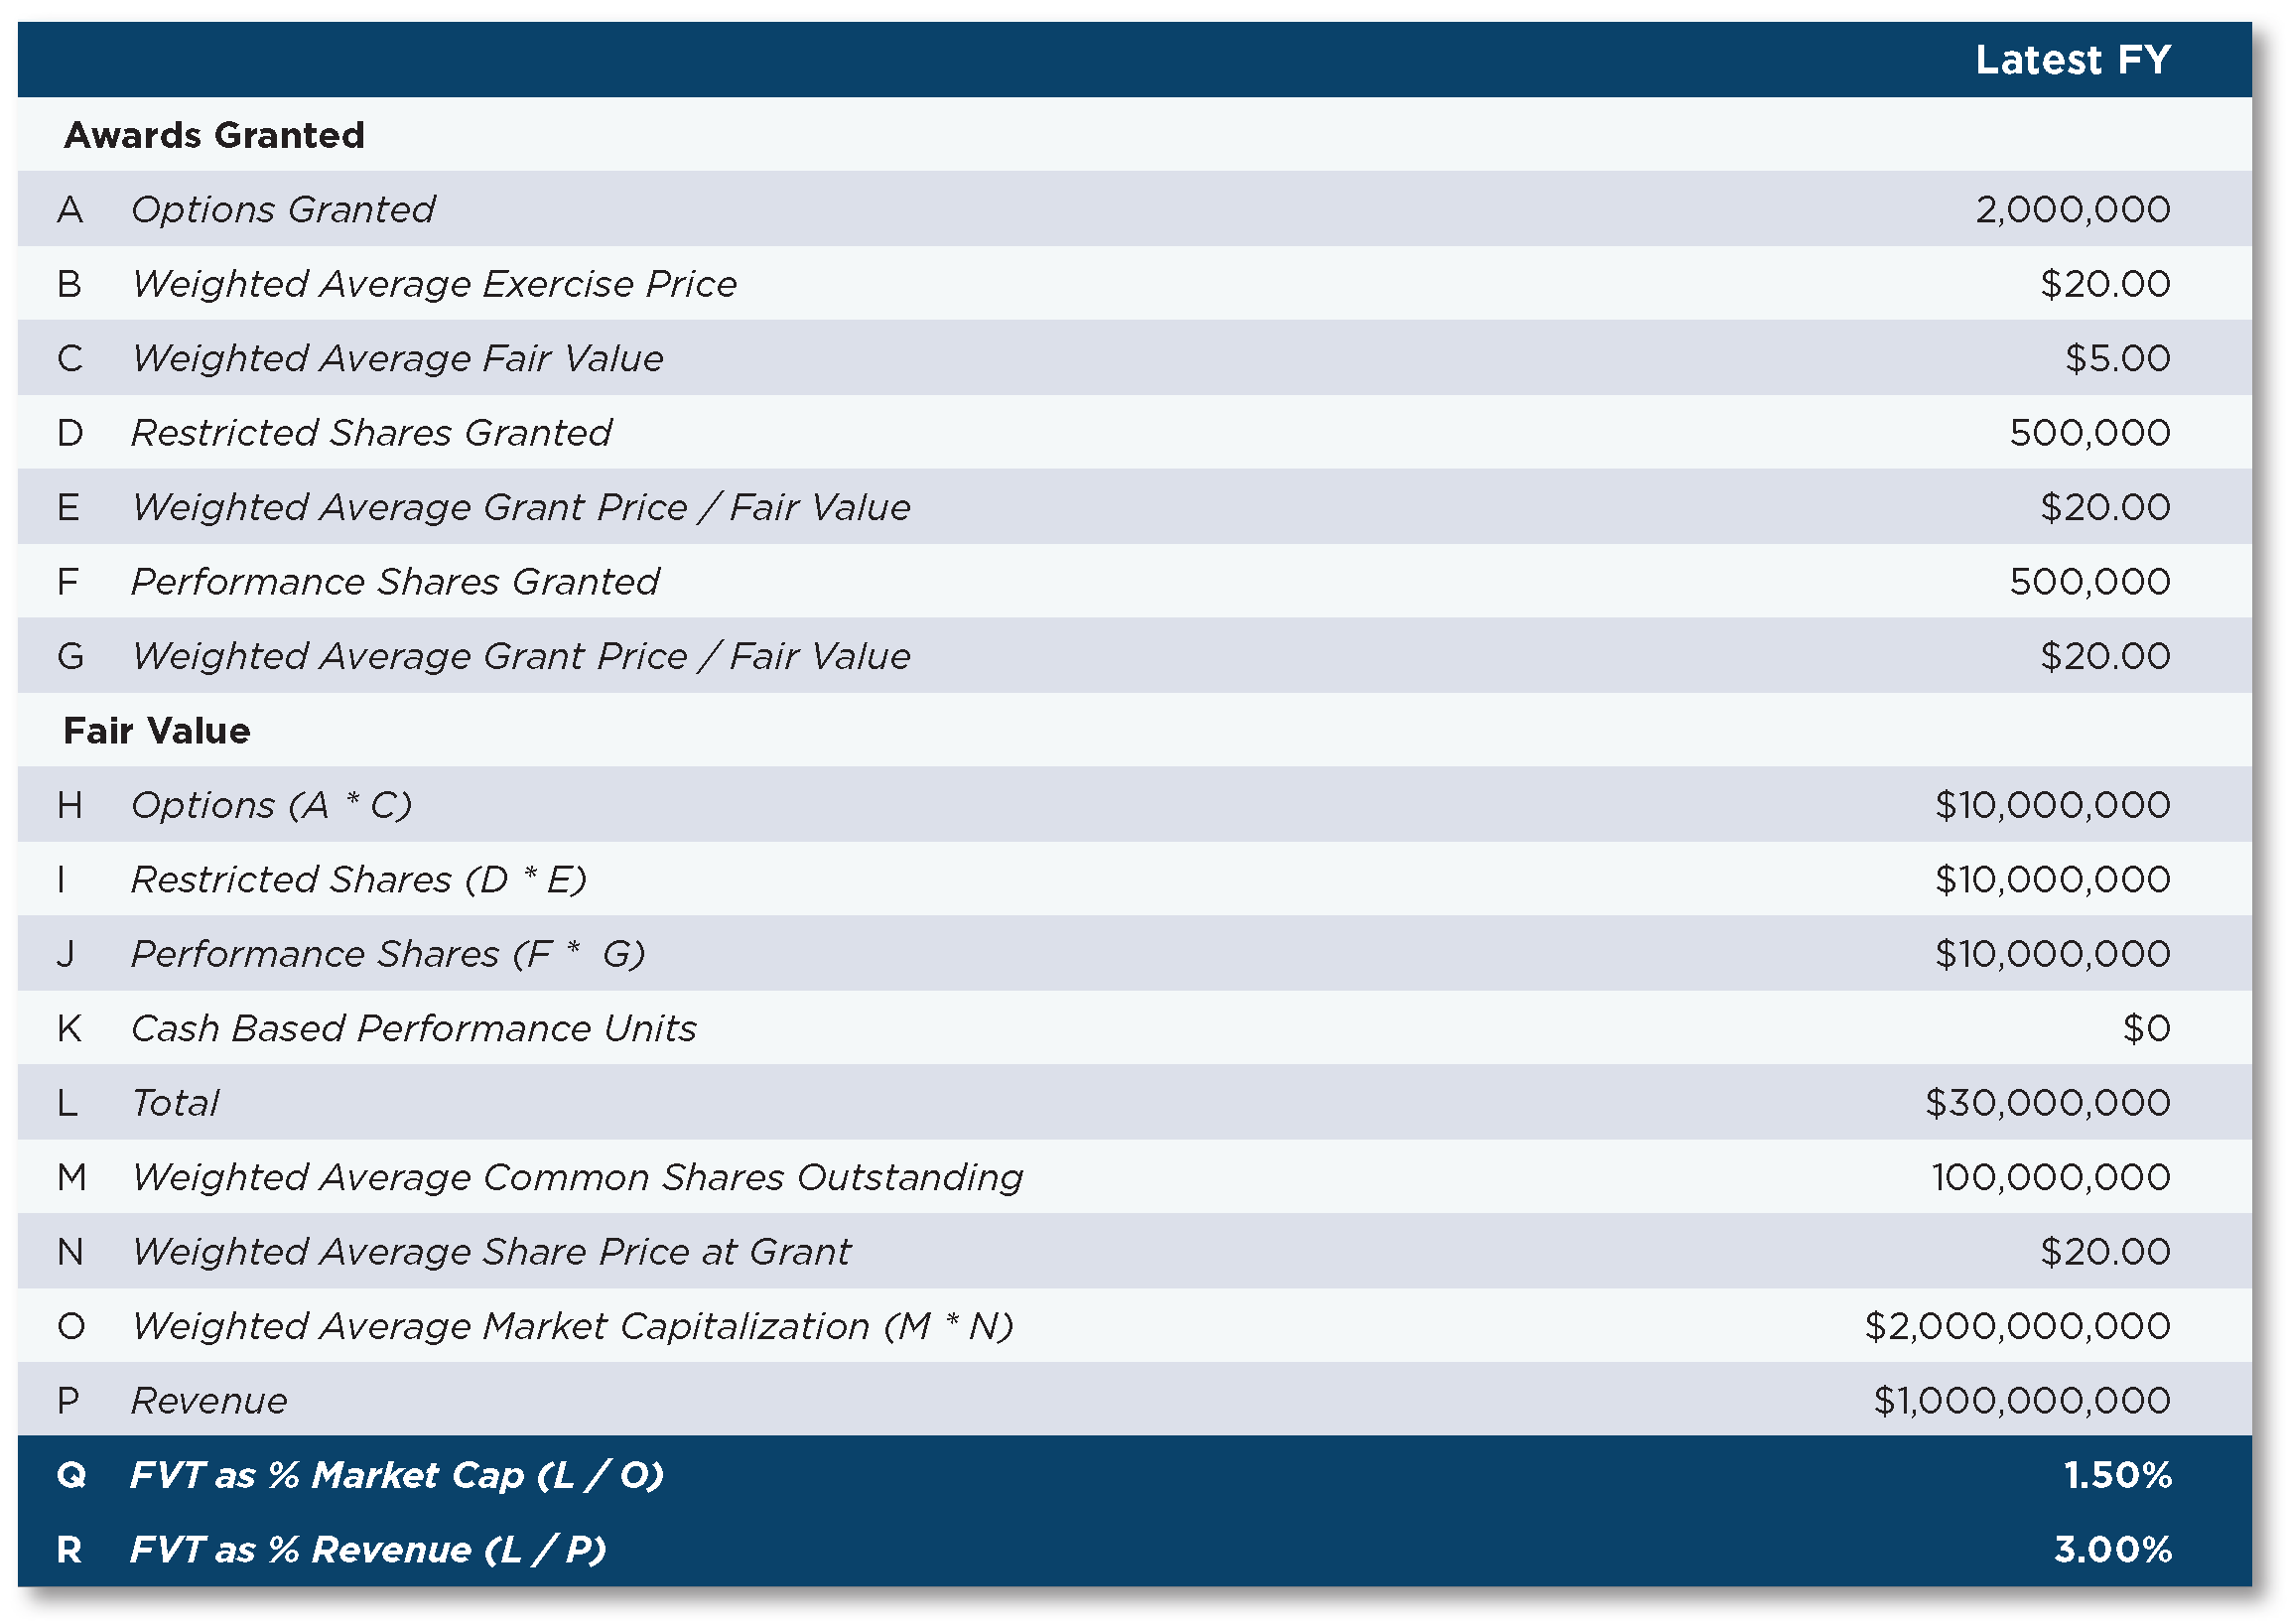
Fair Value Transfer (FVT)
- Measures the aggregate pre-tax compensation cost of grants made in each year (the cost of which will likely be spread over multiple years for profit and loss purposes), and divides by weighted-average market cap to make cost proportionate to company size.
Grant Date Fair Value of All Long-Term Incentive Awards Made During Year
___________________________________________________________
Company Market Capitalization
- Unlike traditional share usage, differentiates the cost impact of various grant types (i.e., recognizes that an option has a lower cost than a full-value share).
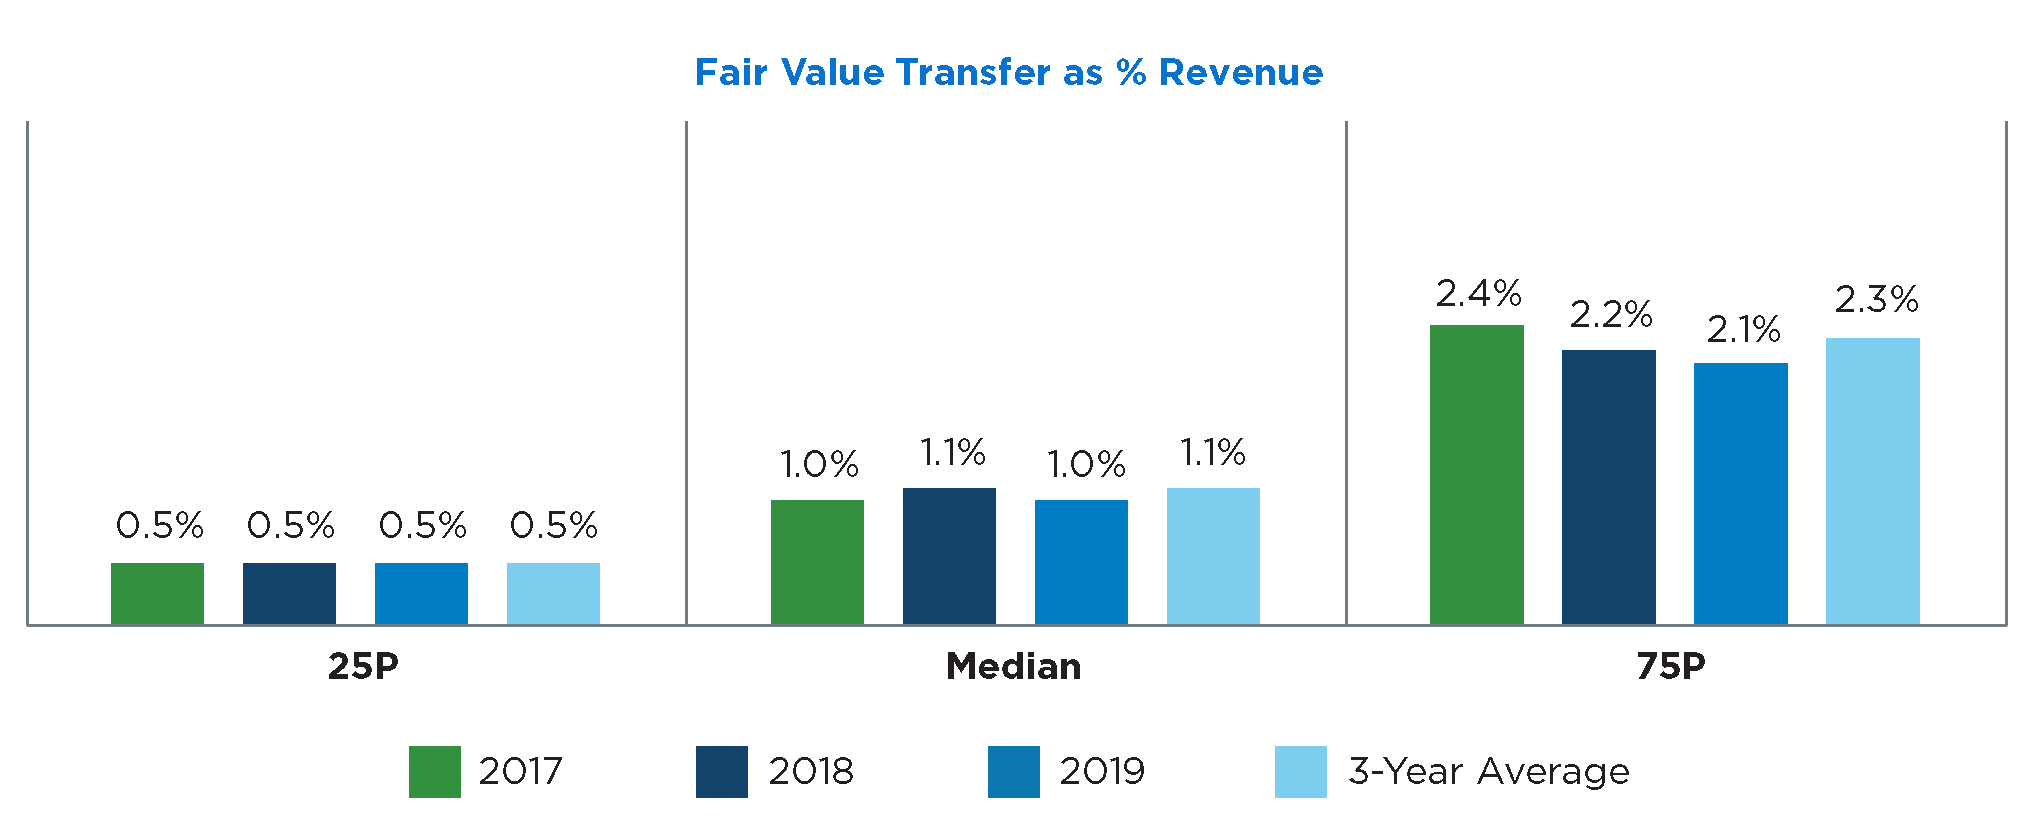
- Alternatively, can also be expressed as a percentage of revenue instead of market capitalization.
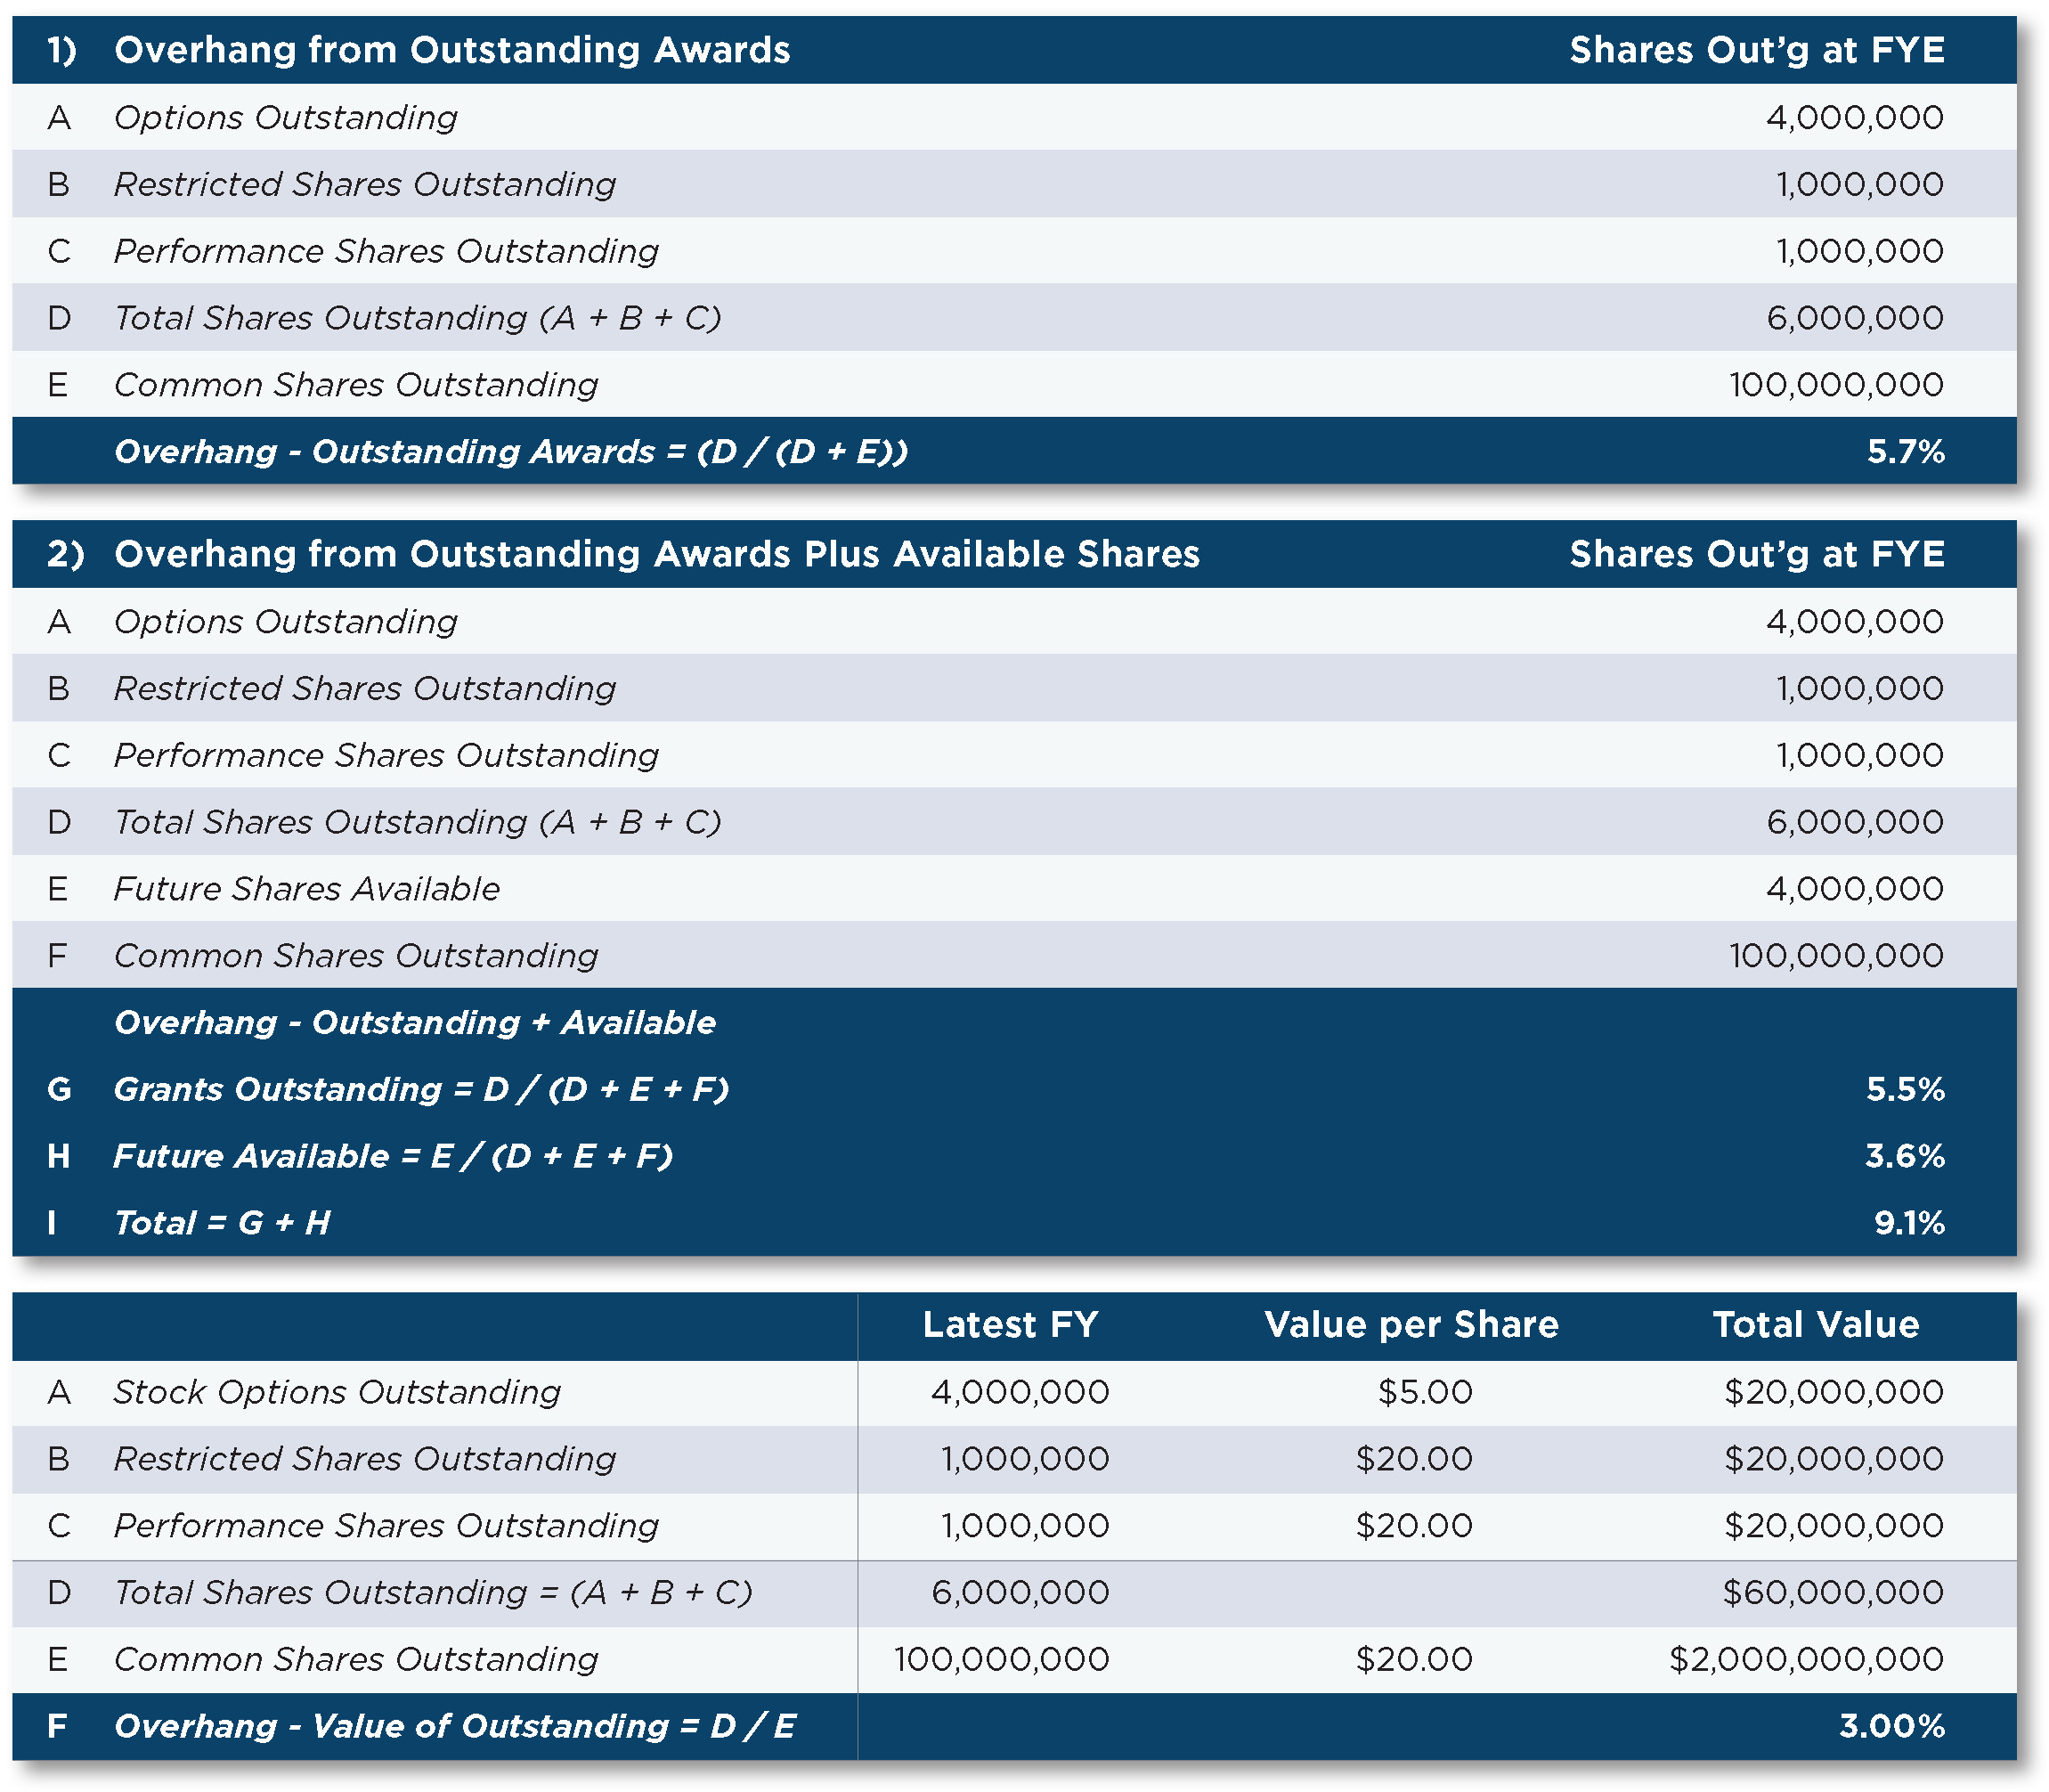
Overhang
- Measures the extent to which stockholders may be diluted by outstanding and future equity awards.
- Can be calculated in three different ways:
- Percentage of shares already granted and still outstanding and/or unvested as a percentage of fully diluted shares outstanding (i.e., common shares outstanding plus outstanding/unvested grants).
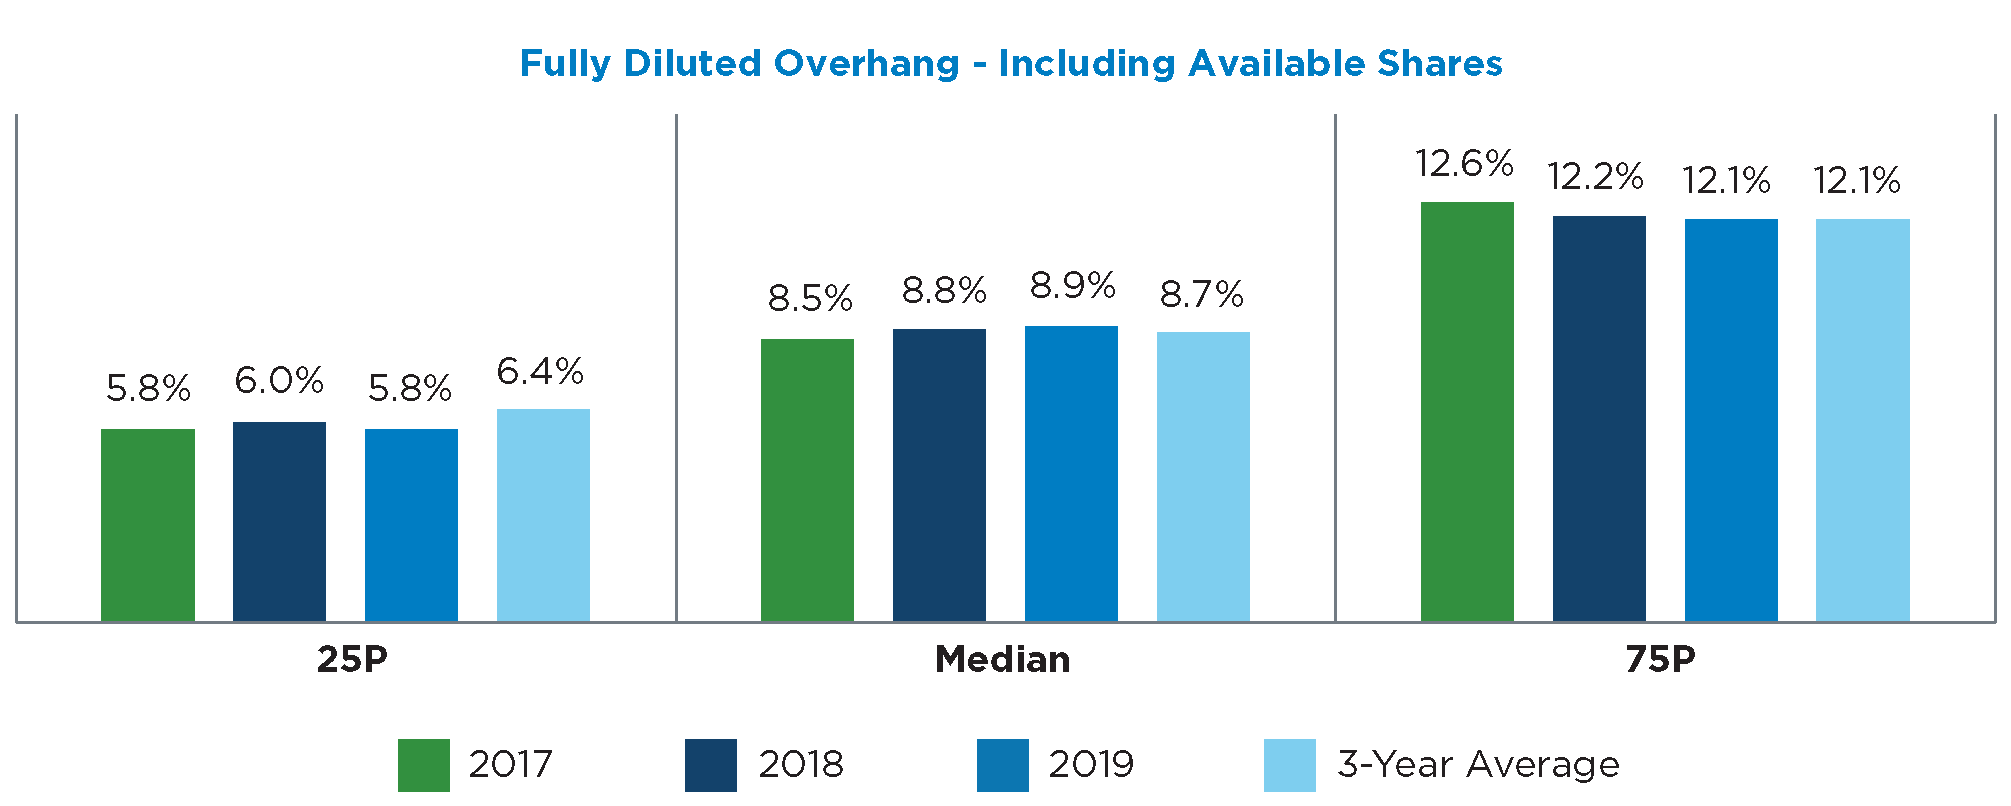
- Same as (1) above, except adding shares available for future grant to both the numerator and denominator.
- Value of shares already granted and still outstanding and/or unvested as a percentage of market capitalization.
- Stock options are valued based on a Black-Scholes model that accounts for changes in the intrinsic value of outstanding options since the date of grant and updates other key inputs.
Top 5 Officer Allocation
- Measures the percentage of total share grants during the year allocated to the CEO and to the Top 5 proxy officers.
- Provides perspective on how deep a company grants equity in the organization as well as the distribution of long-term incentives among the eligible population.

Summary Exhibits
The following section includes summary charts presenting data for the full sample.

The complete publication is available here.
