 Print
PrintMichael Ferrante and Connor Damon are consultants at FW Cook. This post is based on their FW Cook memorandum.
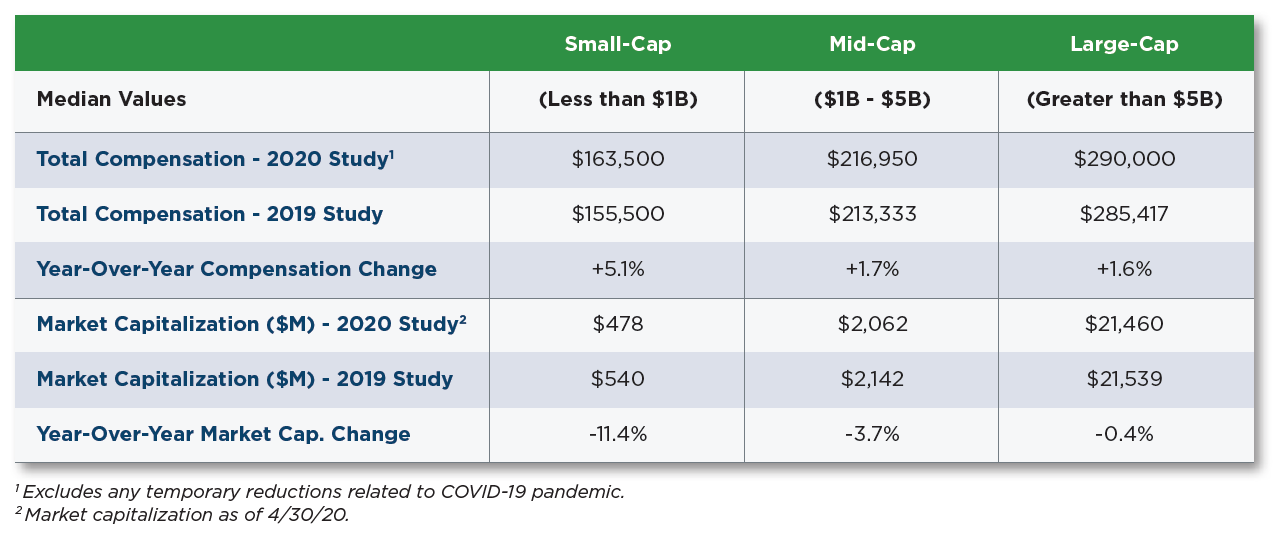
FW Cook’s 2020 Director Compensation Report studies non-employee director compensation at 300 companies of various sizes and industries to analyze market practices in pay levels and program structure. Year-over-year increases to total compensation, at the median, were modest among large-cap and mid-cap companies compared to small-cap companies, which had a relatively significant increase: the large-cap median increased 1.6% to $290,000, the mid-cap median increased 1.7% to $216,950, and the small-cap median increased 5.1% to $163,500. Changes were relatively stable across industries; we observe that Financial Services, Industrials, and Technology companies had no increases in median total compensation, while Energy and Retail companies had increases of 3% and 2%, respectively.
Director compensation structure remains consistent with prior years, with an average mix of 57% equity and 43% cash across the entire sample. Small-cap companies tend to have the highest cash weighting (average of 47%) and large-cap companies tend to have the lowest (average of 37%). Most companies continue to use fixed-value equity award guidelines, with full-value stock awards remaining the most common form of equity compensation and providing the most consistent means to align director pay with shareholder interests. Equity grants most commonly vest immediately, or cliff-vest after one year.
We continue to observe an increasing number of women on Boards: 94% of companies in the study have at least one woman on the Board (90% last year), 59% of large-cap companies have three or more women on the Board (50% last year) and 25% of both mid-cap and small-cap companies have three or more female members (22% and 13% last year, respectively).
Due to the COVID-19 pandemic, 15% of S&P 500 companies and roughly 13% of Russell 3000 companies reported taking pay actions through the third quarter of 2020, which generally consisted of cash retainer reductions. The median decrease in director compensation was 50% at S&P 500 companies and 40% at Russell 3000 companies. The compensation analysis excludes any temporary reductions to director compensation implemented due to the pandemic.
The following chart summarizes total non-employee director pay levels and market capitalizations of the 300 companies in our study (100 companies in each size grouping):
| Cash vs. Equity |
|
|---|---|
| Cash Compensation for Board Service |
|
| Equity Compensation for Board Service |
|
| Committee Compensation |
|
| Non-Executive Board Chairs and Lead Directors |
|
| Stock Ownership Guidelines and Retention Requirements |
|
| Annual Limits on Director Compensation | Prevalence of annual limits on director compensation remains high, with equity-only limits continuing to be the most common approach, though use of total compensation limits increased slightly year-over-year (from 39% to 41%). |
The complete publication is available here.