 Print
PrintDavid F. Larcker is the James Irvin Miller Professor of Accounting at Stanford Graduate School of Business; Phillip Quinn is Assistant Professor of Accounting at the University of Washington Foster School of Business; and Brian Tayan is a Researcher with the Corporate Governance Research Initiative at Stanford Graduate School of Business. This post is based on a recent paper by Prof. Larcker, Mr. Quinn, Mr. Tayan; Daniel Taylor, Associate Professor of Accounting at the Wharton School of the University of Pennsylvania; and Bradford Lynch, PhD Student at The Wharton School.
We recently published a paper on SSRN, Gaming the System: Three “Red Flags” of Potential 10b5-1 Abuse, that provides evidence that some executives use 10b5-1 trading plans to engage in opportunistic, large-scale selling of company shares.
Federal securities law prohibits corporate executives from trading company securities while aware of material nonpublic information (MNPI). Because executives are regularly exposed to MNPI, those who wish to sell a portion of their holdings to diversify their personal wealth are at risk of violating insider trading laws if they trade in advance of this information becoming public.
In 2002, the Securities and Exchange Commission adopted Rule 10b5-1, which outlines procedures that, if followed, provide an affirmative defense against allegations of illegal insider trading. To qualify for protection under Rule 10b5-1, executives enter into a nonbinding contract that instructs a third-party to execute trades on their behalf according to a written plan––known as a 10b5-1 plan. The plan must be adopted at a time when the executive is not aware of MNPI. Through the plan, the executive specifies a set of instructions or schedule by which trades are to be made, such as the number or value of shares to be transacted, the frequency of transactions, price limits, etc. (See Exhibit 1 for examples of 10b5-1 plans.) Once it is in place, the plan can be modified so long as the executive is not aware of MNPI at the time of the modification. The plan and any associated trades can also be cancelled at any time, regardless of whether the executive is in possession of MNPI. The latter aspect of 10b5-1 plans is particularly controversial, as it has the effect of allowing executives to set up routine sales, and then pause or cancel sales if they know the company will be announcing news that will push the stock price higher.
The expectation is that the executive will rely on Rule 10b5-1 to sell (or purchase) a large block of shares using multiple transactions spread out over time. However, the rule does not require that shares be traded in this manner. Rule 10b5-1 does not specify a minimum number of transactions, and an executive can use a Rule 10b5-1 plan for a single trade. Executives are also not required to spread transactions over time, as might be recommended by a financial advisor when exiting a concentrated stock position.
Currently, researchers, regulators, and shareholders have a limited understanding of how 10b5-1 plans are used in practice. The SEC does not require public disclosure of 10b5-1 plans, and executives are not required to indicate whether the trades they report on Form 4 are made pursuant to such plans. Executives are only required to notify the SEC if a 10b5-1 plan is used to sell restricted stock through Form 144, and if so, provide the date the plan was adopted (Exhibit 2). Strangely, the SEC does not require electronic submission of Form 144 and continues to allow such forms to be mail-filed. From 2016 to 2019, 99 percent of Form 144 filings (over 90,000 filings) were filed by mail and are not publicly available through EDGAR. Instead, the paper filings are stored in the SEC reading room and destroyed 90 days after receipt. As a result, comprehensive data on the structure and use of 10b5-1 plans is not widely available either to the public or to the Commission.
In response to reports of potential 10b5-1 abuse, former SEC chairman Jay Clayton informally proposed amending Rule 10b5-1 to require a minimum “cooling-off period” of 4 to 6 months, between plan adoption and the first planned trade. Currently, no cooling-off period is required. Direct empirical evidence has not been available to evaluate this proposal.
In this Closer Look, we present new evidence on the trading behavior of corporate executives using a unique dataset of over 20,000 10b5-1 plans, including their associated adoption dates and trades. To our knowledge, the evidence presented here is the first large sample evidence on both plan adoption and the trades under these plans. We show that a subset of executives use 10b5-1 plans to engage in opportunistic, large-scale selling of company shares.
We identify three “red flags” associated with opportunistic use of 10b5-1 plans.
- Plans with a short cooling-off period
- Plans that entail only a single trade
- Plans adopted in a given quarter that begin trading before that quarter’s earnings announcement.
Sales made pursuant to these plans avoid significant losses and foreshadow considerable stock price declines that are well in excess of industry peers.
Data on Trading Activity Under 10b5-1
Our sample includes data on all sales of restricted stock filed on Form 144 between January 2016 and May 2020 and the adoption date of any corresponding 10b5-1 plans. In total, we have data on 20,595 plans, which covers the trading activity by 10,123 executives at 2,140 unique firms. These plans are responsible for a total of 55,287 sales transactions totaling $105.3 billion during our sample period. Average (median) trade size is $1.9 million ($0.4 million—see Exhibit 3).
Because our dataset includes plan adoption dates and the trades associated with these plans, we are able to measure the elapsed time between plan adoption and the date of the first planned trade (which we refer to as the “effective cooling-off period”); the number of trades made under each plan; and the time between plan adoption, trading, and quarterly earnings announcements.
Cooling-off Period
Panel A of Exhibit 4 shows effective cooling-off periods vary widely across plans. The mean (median) cooling-off period is 117.9 (76) days. Approximately 14 percent of plans commence trading within the first 30 days, and 39 percent within the first 60 days. These represent very short cooling-off periods. 82 percent of plans commence trading within 6 months.
Panel B of Exhibit 4 shows the set of plans that start trading in the first 30 days. We find that 1 percent of plans begin trading the same day as plan adoption, and that there also appears to be a regular pattern of executives waiting 2 weeks (14 days) before the first planned trade. A spike in initial trading also occurs 30 days after plan adoption, suggesting some executives voluntarily follow a 30-day cooling-off period.
Exhibit 5 shows that initial trade size varies with the length of cooling-off period. The trades of plans with cooling-off periods less than 30 days are approximately 50 percent larger than trades of plans with a 6+ month cooling-off period (median trade size of $573,000 v. $360,000).
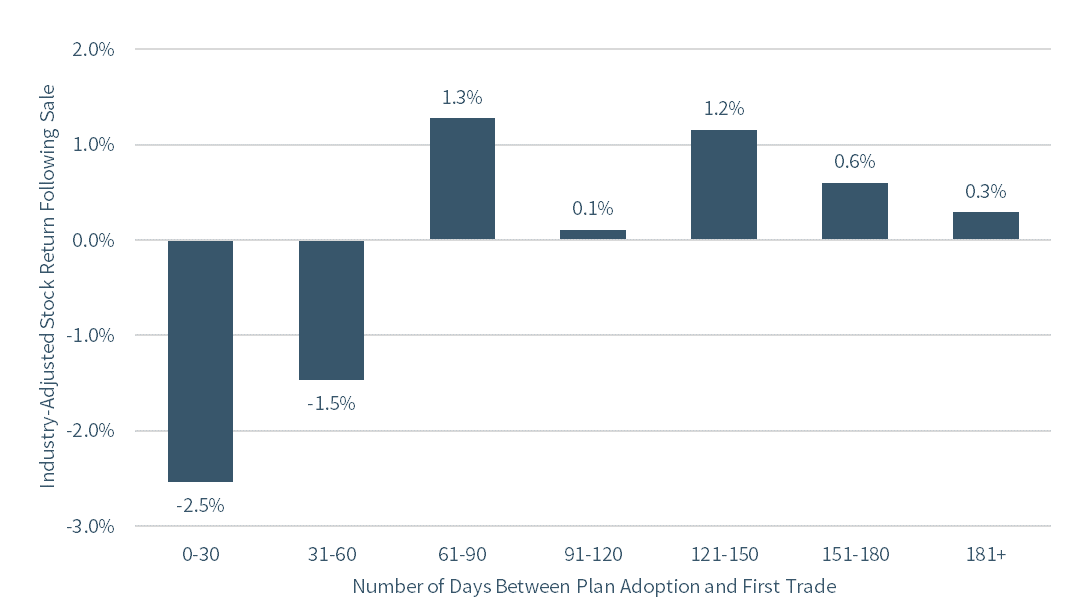
Exhibit 6 shows that the duration of cooling-off period is associated with loss avoidance. To measure loss avoidance, we calculate the industry-adjusted stock return over the 6 months (120 trading days) following the date of the first planned sale. When industry-adjusted returns following the sale are negative, an executive selling stock avoids holding a security that underperforms its industry peers. The greater the negative return following the sale, the greater the loss avoidance. We find that trades of plans with short cooling-off periods avoid significant losses and foreshadow considerable stock price declines that are well in excess of industry peers.
The first planned trade with a cooling-off period of less than 30 days is associated with a subsequent industry-adjusted return of -2.5 percent. Similarly, the first planned trade with a cooling-off period between 30 and 60 days is associated with a subsequent -1.5 percent return. When the cooling-off period is extended beyond 60 days, evidence of loss avoidance disappears.
Single-Trade Plans
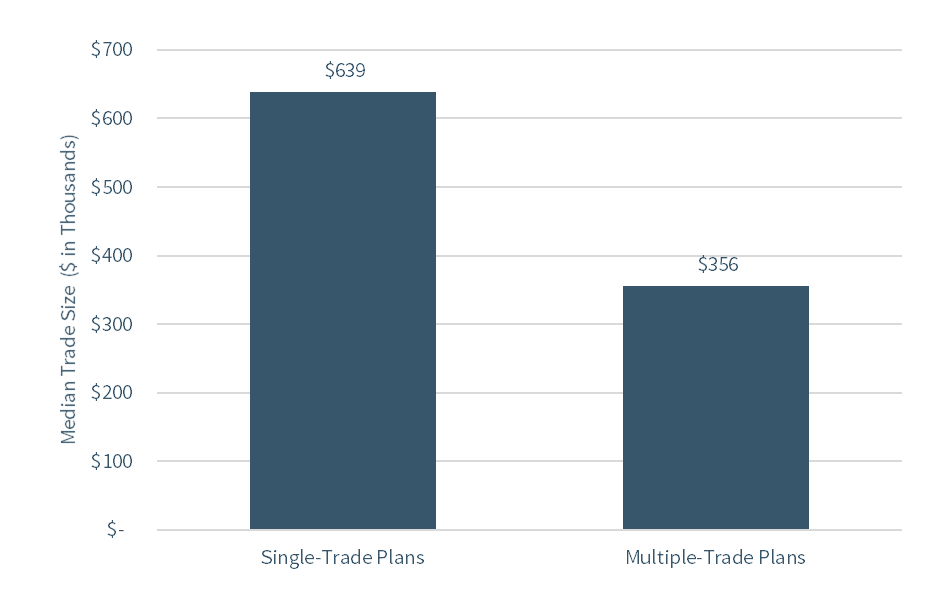
Approximately half (49 percent) of the 10b5-1 plans in our sample cover only a single trade. Single-trade plans have a median size of $639,000. In contrast, trades under multiple-trade plans have a median size of $356,000. Trade size is smaller in multiple-trade plans but, in aggregate, multiple-trade plans are used to sell a larger amount of total stock: $79 billion was sold under multiple-trade plans compared to $26 billion under single-trade plans (Exhibit 7).
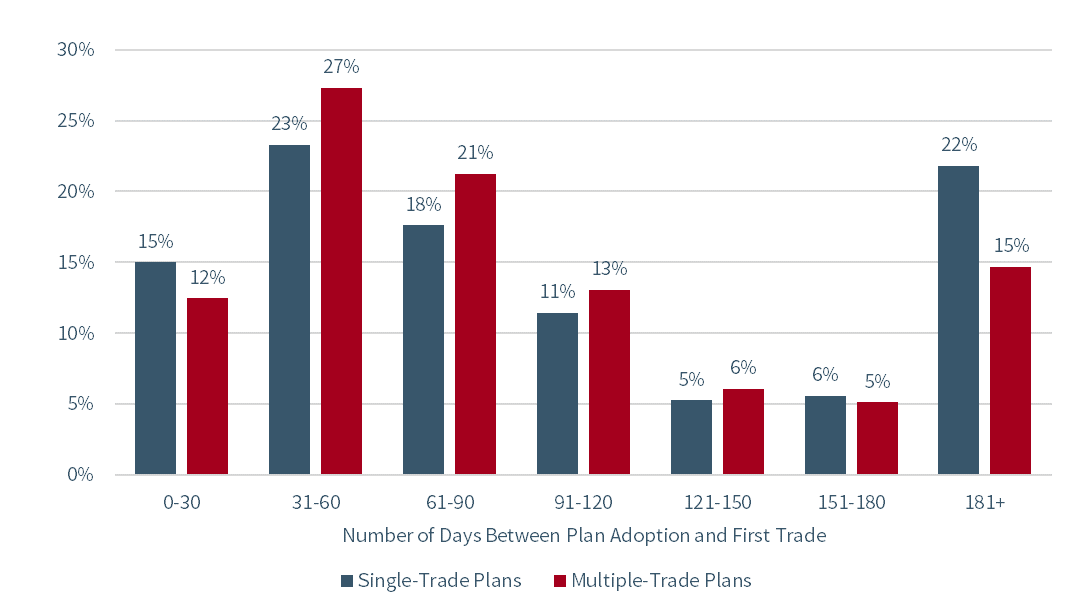
Exhibit 8 shows that the distribution of cooling-off periods is similar for single- and multiple-trade plans, with approximately 40 percent of single-trade plans executing the trade within 60 days of plan adoption.
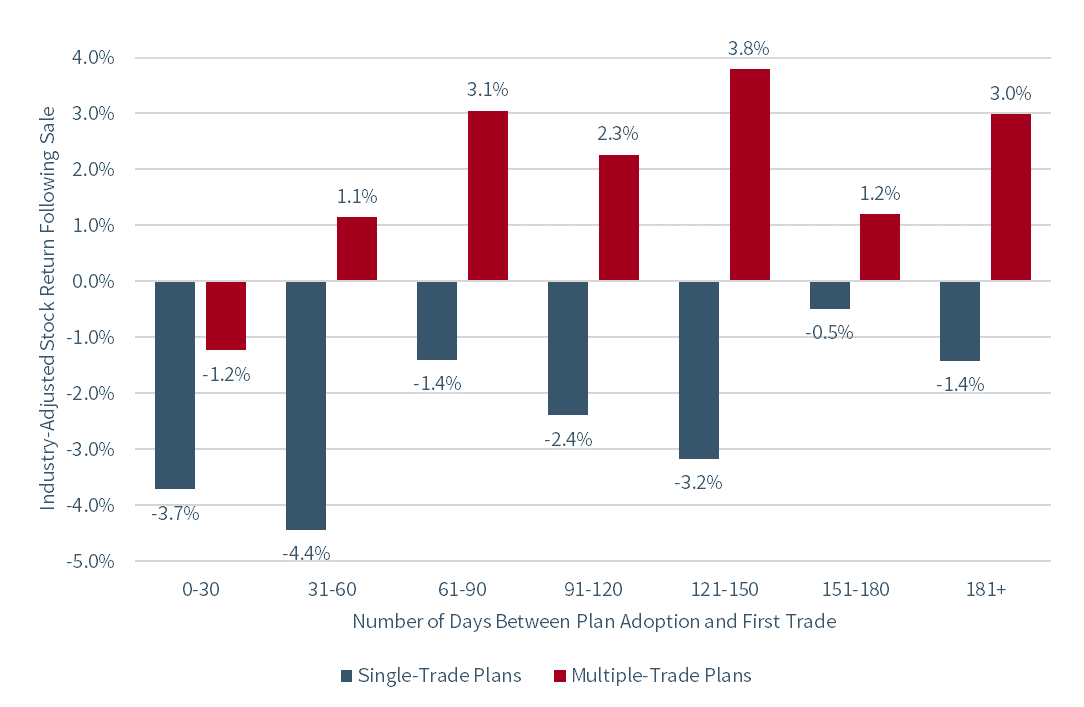
Exhibit 9 shows the trades of single-trade plans are consistently loss-avoiding regardless of cooling-off period. Single-trade plans with short cooling-off periods exhibit the highest average loss avoidance, avoiding an industry-adjusted price decline of -4 percent. In contrast, the trades under multiple-trade plans are only loss-avoiding within 30 days of plan adoption (industry-adjusted price decline of -1 percent). Beyond this, trades of multiple-trade plans are not loss avoiding.
Timing of Adoption and Trade Relative to Earnings Announcements
Finally, we study the timing of plan trades in relation to the quarterly earnings announcement immediately after the plan was adopted.
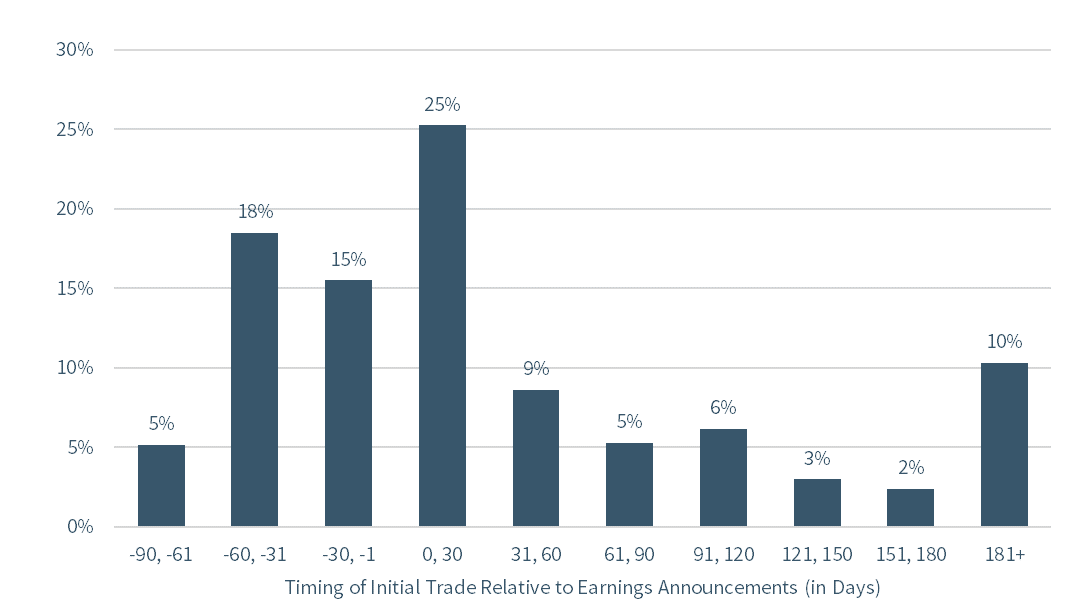
Exhibit 10 shows the timing of trades relative to the earnings announcement immediately following plan adoption. 38 percent of plans adopted in a given quarter also execute trades before that quarter’s earnings announcement (i.e., in the 1 to 90 days prior to earnings. Sixty-two percent do not execute the first trade until after that quarter’s earnings announcement. (Exhibit 10).
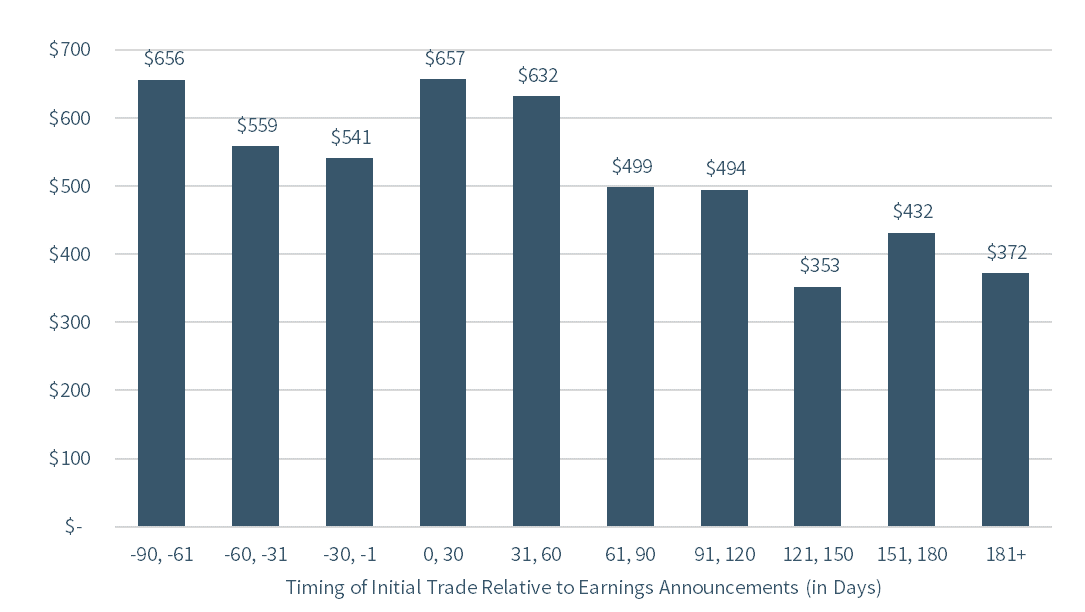
The size of the initial trade declines the further it is from the earnings announcement. Sales occurring between the adoption date and earnings announcement are about 25 percent larger than sales occurring more than six months after the earnings announcement (Exhibit 11).
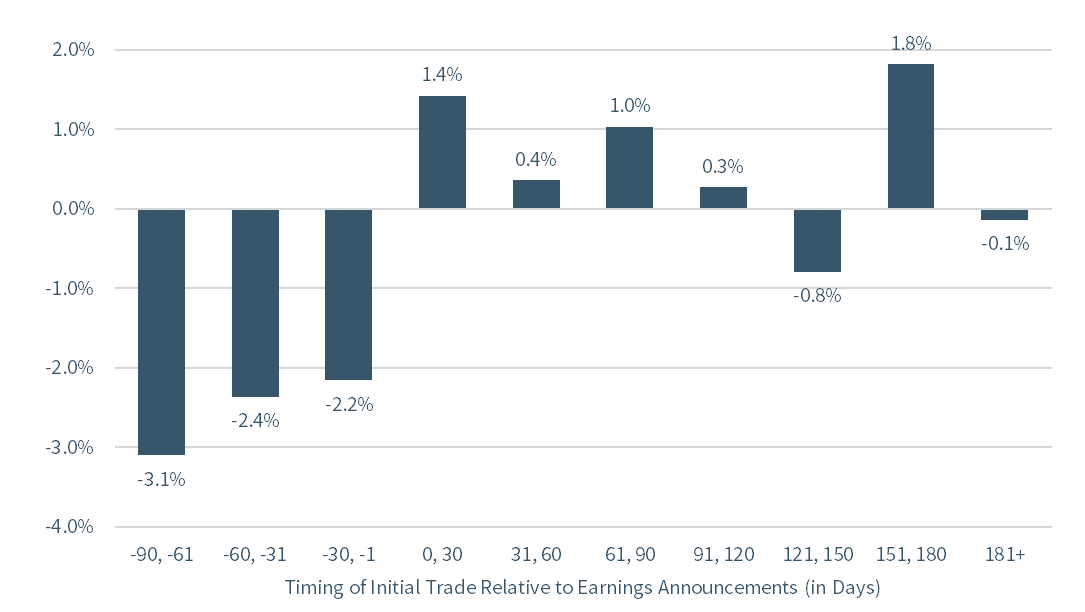
Exhibit 12 shows that plans that execute a trade in the window between when the plan is adopted and that quarter’s earnings announcement anticipate large losses and foreshadow considerable stock price declines. Over the 120 days after the sale, the stock underperforms industry peers by between -2 percent and -3 percent. In contrast, loss avoidance is not evident for trades occurring after the earnings announcement.
Red Flags and Recommendations
The data described above provide evidence of three “red flags” associated with opportunistic planned trading under Rule 10b5-1. Planned trades with these characteristics systematically avoid losses and foreshadow considerable stock price declines over the subsequent six months. Planned trades without these characteristics do not appear to systematically avoid losses and do not predict subsequent stock price declines.
- Minimal cooling-off periods. The shorter the interval between plan adoption and the first trade, the more likely it appears that the plan is being used opportunistically. With longer cooling-off periods, opportunistic trading disappears.
Recommendation. Require a minimum cooling-off period. A cooling-off period of 4 to 6 months, as suggested by former SEC Chairman Clayton, is supported by the data in our sample. We find that initial trades occurring four to six months after plan adoption do not systematically anticipate stock price declines. At a minimum, trading on the same day as plan adoption should not be allowed.
- Single-trade plans. In the extreme, if the plan is designed to execute only a single trade, it is economically equivalent to a traditional limit order (or date-triggered order). Single-trade plans are inconsistent with traditional financial advice for exiting a concentrated equity position over time. They are also inconsistent with the original expectation that Rule 10b5-1 governs trades made under a “regular, pre-established program.”
Recommendation. Disallow single-trade 10b5-1 plans. Require multiple transactions to be spread out over a certain time period in order for a plan to qualify for affirmative defense.
- Plans adopted and with the initial trade occurring prior to earnings. Because senior executives are routinely aware of corporate performance between the end of quarter and the earnings announcement, it is unlikely that they can enter a plan during this period without having MNPI. Companies adopt trading blackout windows to prevent this activity, but our data suggests some executives use 10b5-1 plans to circumvent the purpose of these blackout windows, and adopt plans during periods when they are almost surely in possession of MNPI.
Recommendation. Remove the affirmative defense of Rule 10b5-1 for plans that are both adopted and start selling shares before the next earnings announcement. Because earnings are announced quarterly, the requirement of a 4- to 6-month cooling-off period would also prevent this behavior and obviate the need for additional restrictions.
Recommendations for Disclosure Policy
Evidence of these abuses has not been known to the public because relatively basic but critical information is not required public disclosure, and companies are choosing not to publicly disclose it. The SEC should consider requiring the following:
- Disclosure of 10b5-1 plans or, at a minimum, the adoption, modification, suspension, or termination of a plan, and the maximum number of shares scheduled to be sold under a 10b5-1 plan.
- Filers to indicate on Form 4 whether the reported transaction is pursuant to a 10b5-1 plan and, if so, the date of plan adoption or modification.
- Electronic EDGAR reporting of Form 144.
Separate from these, companies should consider requiring general counsel approval of 10b5-1 plans, and should disallow plans to be adopted inside trading blackout windows.
Why This Matters
- This Closer Look reviews evidence on the adoption and trading of 10b5-1 plans. We identify three red flags indicative of opportunistic use of such plans: 1) short cooling-off periods, 2) single-trade plans that cover a single block trade instead of spacing multiple trades over time, and 3) plans that are adopted and commence trading immediately prior to the next earnings announcements. Plans with these characteristics tend to place trades that are associated with significant loss avoidance and foreshadow considerable stock price declines. Simple modifications to Rule 10b5-1 can prevent such opportunistic trades, while preserving the core purpose and functioning of the rule.
- Given some of the abuses of 10b5-1 trading plans, should the SEC require disclosure of 10b5-1 plans? Should the SEC require disclosure of 10b5-1 trades on Form 4? Would disclosure of this information reduce a significant portion of 10b5-1 plan abuse?
- Current SEC rules require disclosure in Form DEF14-A about whether an executive’s equity holdings are (or can be) hedged or pledged. Pre-scheduled sales through 10b5-1 are similar in spirit to a hedging or pledging contract. Should the SEC require companies to disclose the number of shares under contract to be sold through 10b5-1?
- A subset of the plans in our sample appear to have been adopted and executed during company blackout windows. If so, are these executives using 10b5-1 plans as a means of circumventing blackout restrictions? Should counsel allow 10b5-1 plans to be adopted inside trading blackout windows?
- Does the board or compensation committee monitor executive stock sales? Although separate from SEC rules, why don’t more boards follow best practices and require executives to schedule their sales through 10b5-1 plans, with general counsel preapproval?
The complete paper is available for download here.
Exhibit 1: Examples of Voluntary Disclosure of 10b5-1 Plans
Datalink Corporation
“On February 13, 2006, our Chairman, Greg R. Meland, established a pre-arranged, personal stock trading plan under SEC Rule 10b5-1 (the ‘Plan’) to sell a portion of his holdings of our Common Stock. Mr. Meland has advised us that he intends to use proceeds from sales under his Plan to diversify his personal investments. The Plan covers the sale of up to 120,000 shares over a one-year period. Subject to a minimum $3.00 per share price, Mr. Meland’s broker will make sales under the Plan of up to 30,000 shares per month. Sales will take place only during the first ten business days of the month. Following completion of the planned sales, and assuming the broker sells all of the shares subject to the Plan, Mr. Meland will continue to own 3,330,690 shares of our Common Stock.”
McDATA Corporation
“On May 8, 2002, John A. Kelley, Jr., McDATA’s President and COO, entered into a Rule 10b5-1 Stock Purchase Plan with Deutsche Bank Alex Brown to purchase $20,000 worth of McDATA Class B Common Stock on each of the following dates: May 29, 2002; June 26, 2002; July 31, 2002; August 28, 2002; and September 25, 2002, for an aggregate total amount of purchases equal to $100,000.”
Sources: Datalink Corporation, Form 8-K (Feb. 13, 2006); and McDATA Corporation, Form 8-K (May 13, 2002).
Exhibit 2: Sample Form 144 Filing
Source: The Securities and Exchange Commission, available: https://www.sec.gov/files/form144.pdf.
Exhibit 3: Sample Description
Total Sample
- Dataset has 20,595 unique plans.
- The plans involve $105,263,555,580 total transaction volume
- The plans span 55,287 trades
- The plans span 2,140 unique firms
- The plans span 10,123 unique executive filers
Source: Data from The Washington Service; analysis by the authors.
Exhibit 4: Distribution of Cooling-off Periods
Panel A: Cooling-Off Periods (Full Sample)
Panel B: Cooling-Off Periods (First 30 Days Only)
Source: Data from The Washington Service; analysis by the authors.
Exhibit 5: Median Size of Preplanned Sale, by Cooling-Off Period
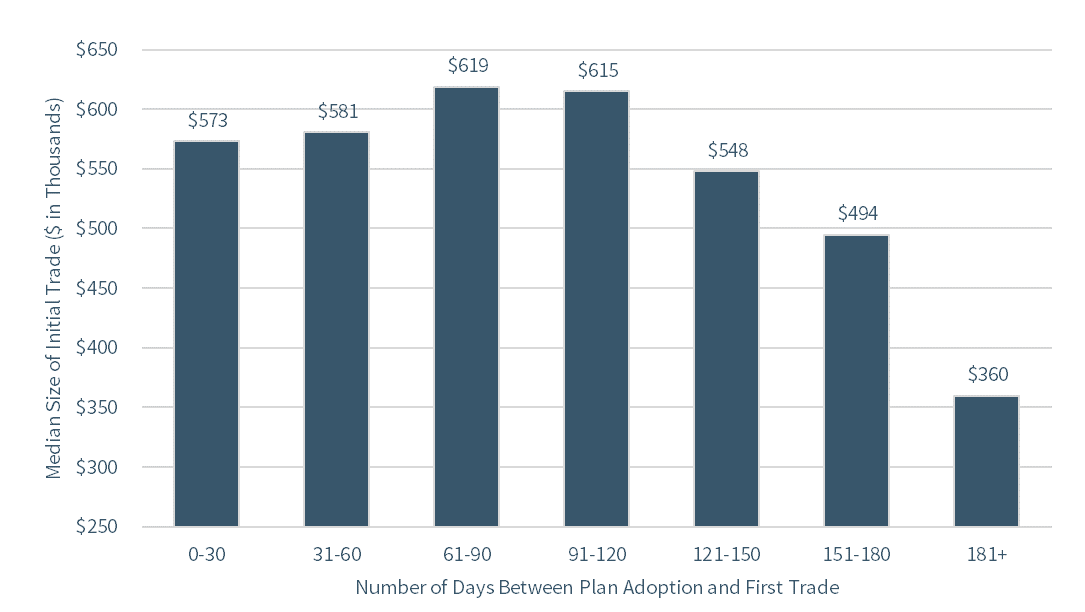
Source: Data from The Washington Service; analysis by the authors.
Exhibit 6: Industry-Adjusted Stock Return Following the Planned Sale, by Cooling-Off Period
Source: Data from The Washington Service; analysis by the authors.
Exhibit 7: Single- and Multiple-Trade Plans
Single-Trade Plans
- Dataset has 10,104 single-trade plans
- The single-trade plans involve $26,218,746,447 total transaction volume
- The single-trade plans median trade size is $638,744
- The single-trade plans span 1,837 unique firms
- The single-trade plans span 6,557 unique executive filers
Multiple-Trade Plans
- Dataset has 10,491 multiple-trade plans
- On average, a multiple-trade plan has 4.31 trades
- The multiple -trade plans involve $79,044,809,134 total transaction volume
- The multiple -trade plans median trade size is $355,851
- The multiple -trade plans span 1,691 unique firms
- The multiple -trade plans span 6,257 unique executive filers
Median Trade Size
Source: Data from The Washington Service; analysis by the authors.
Exhibit 8: Distribution of Cooling-Off Periods For Single- and Multiple-Trade Plans
Source: Data from The Washington Service; analysis by the authors.
Exhibit 9: Industry-Adjusted Stock Return Following the Planned Sale for Single- and Multiple-Trade Plans
Source: Data from The Washington Service; analysis by the authors.
Exhibit 10: Initial Trade of Plans Adopted within 90 Days of Earnings Announcements
Initial Trade Occurs Before Earnings Announcement
- Dataset has 6,858 pre-earnings trade plans
- The pre-earnings trade plans involve $16,217,986,149 total transaction volume
- The pre-earnings trade plans median trade size is $568,545
- The pre-earnings trade plans span 1,473 unique firms
- The pre-earnings trade plans span 4,637 unique executive filers
Initial Trade Occurs After Earnings Announcement
- Dataset has 11,522 post-earnings trade plans
- The post-earnings trade involve $25,941,276,666 total transaction volume
- The post-earnings trade median trade size is $527,713
- The post-earnings trade span 1,680 unique firms
- The post-earnings trade span 6,711 unique executive filers
Source: Data from The Washington Service; analysis by the authors.
Exhibit 11: Median Size of Initial Trade of Plans Adopted within 90 Days of Earnings Announcements
Source: Data from The Washington Service; analysis by the authors.
Exhibit 12: Industry-Adjusted Returns of Initial Trade Relative to Earnings Announcements
Source: Data from The Washington Service; analysis by the authors.