Pamela Marcogliese and Lori Goodman are partners and Elizabeth Bieber is counsel at Freshfields Bruckhaus Deringer LLP. This post is based on a Freshfields memorandum by Ms. Marcogliese, Ms. Goodman, Ms. Bieber, and Maj Vaseghi. Related research from the Program on Corporate Governance includes Paying for Long-Term Performance by Lucian Bebchuk and Jesse Fried (discussed on the Forum here).
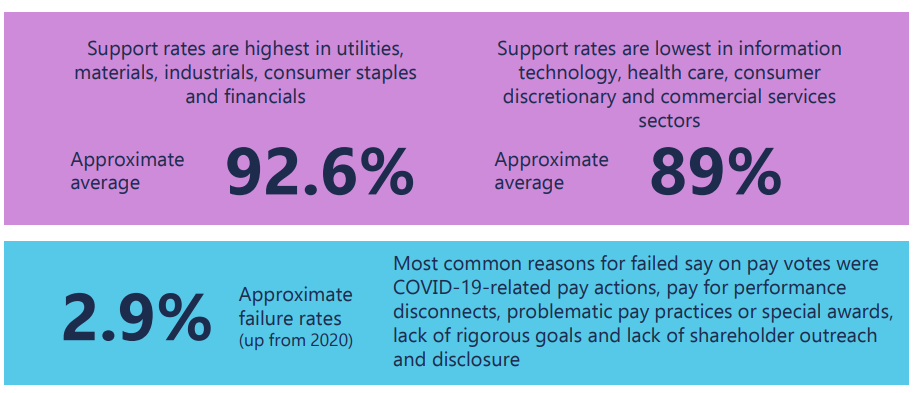
Average support remains high in 2021, currently approximately 90.8% at Russell 3000 companies, reflecting similar averages compared to 2020 in the same period, despite a higher failure rate in 2021 to date compared to 2020 (see below)
Proxy advisory firms continue to have a significant impact on vote results, although current ISS “against rates” are slightly lower in 2021 than in 2020
Say-on-Pay Trends
Although the average say-on-pay approvals were minimally affected, investor scrutiny of executive compensation continues to be a focus, particularly related to the impact of the COVID-19 pandemic
- 17 companies in the S&P 500 received between 50% support and 65% support on say-on-pay proposals and 13 companies received under 50% support
- In the S&P 500, say-on-pay averages have decreased over the last five years, from 92.3% average in 2016 to 88.2% in 2021, reflecting slightly less support for more companies over the period
- Some significant investors have expressed a willingness to oppose say-on-pay votes, which is reflective of the results
- Median CEO pay at over 300 of the biggest companies in the US was $13.7 million, compared to $12.8 million at the same companies the prior year
- Reflects changed targets or modified pay structures in response to the COVID-19 pandemic and that publicly-announced cash compensation salary cuts had limited effect on overall compensation, largely due to equity compensation and market performance in 2020
Pay Ratio
The pay ratio rule requires companies to disclose: the median of the annual total compensation of all employees except the CEO; the annual total compensation of the CEO; and the ratio of these two amounts
Trends
- With respect to S&P 500 companies, pay ratio is highest in consumer discretionary sector (370:1) and lowest in real estate (76.5:1)
- With respect to S&P 500 companies, median CEO pay across each major sector generally falls within a fairly small range ($7.7m to $17m), so sector-by-sector discrepancies in pay ratio likely more attributable to larger discrepancies in median employee pay
- Average CEO pay ratio of the S&P 500 is approximately 2.3x the average CEO pay ratio of the Russell 3000
Equity Plan Proposals
The effects of the COVID-19 pandemic have had less of an impact on equity plan proposals than anticipated during the 2020 proxy season
Director Compensation: Trends
Limits to annual non-executive director compensation have been included in shareholder-approved equity plans, with the median limit at $500,000 for small- and mid-cap companies and $750,000 for large-cap companies
Equity-only limits continue to be more common, but limits on director compensation on total pay have increased (from 39% to 41% between 2020 and 2019)
15% of S&P 500 companies and 13% of Russell 3000 companies reported taking pay actions for director compensation through the third quarter of 2020 (generally impacting cash retainer compensation) in light of the COVID-19 pandemic, although compensation overall increased in 2020 compared to 2019, most significantly for small-cap company directors
The complete publication, including footnotes, is available here.
 Print
Print


