 Print
PrintMatteo Tonello is Managing Director of ESG Research at The Conference Board, Inc. and Olivia Tay is Senior Consultant at Semler Brossy Consulting Group. This post is based on a Conference Board report by Mr. Tonello, Ms. Tay, Mark Emanuel, Paul Hodgson, and Todd Sirras, and relates to CEO and Executive Compensation Practices in the Russell 3000 and S&P 500: 2021 Edition, an annual benchmarking study and online dashboard published by The Conference Board, compensation consultancy Semler Brossy Consulting Group, and ESG data analytics firm ESGAUGE. Related research from the Program on Corporate Governance includes Paying for Long-Term Performance by Lucian Bebchuk and Jesse Fried (discussed on the Forum here).
CEO and Executive Compensation Practices in the Russell 3000 and S&P 500: 2021 Edition documents trends and developments in senior management compensation at 2,527 companies issuing equity securities registered with the US Securities and Exchange Commission (SEC) that filed their proxy statement in the period between January 1 and June 30, 2021, and, as of January 2021, were included in the Russell 3000 Index. The project is a collaboration among The Conference Board, compensation consulting firm Semler Brossy, and ESG data analytics firm ESGAUGE.
The following are the key findings and insights.
Insights for What’s Ahead
- For many companies with calendar fiscal year ends, target pay levels in 2020 were established before the onset of the pandemic, so target pay levels disclosed in next year’s proxy will likely account for performance during the COVID-19 pandemic. Year-over-year pay changes will loosely fall along business sector lines. Sectors that recovered quickly following the pandemic are expected to see larger increases in target pay levels and stronger incentive pay outcomes. Companies still experiencing headwinds will likely hold target pay levels flat and may continue to face below-target incentive pay outcomes. As a result, the spread between upper and lower quartile pay levels is expected to widen.
- There will also likely be a bigger variance in pay levels between top and bottom performers within business sectors. For example, retailers with well-established digital platforms were better situated to handle disruptions from the pandemic, enabling them to emerge as winners. Essential retailers also benefitted and out-performed expectations that they set before the onset of the pandemic. These strong performers will likely be able to take more aggressive pay actions (e.g., double-digit increases, one-time special awards, etc.) to retain and reward their top talent. On the flip side, shareholders and proxy advisors will expect retailers who face continued headwinds and longer paths to recovery to take more conservative pay actions (e.g., hold target pay levels flat) to demonstrate pay-for-performance alignment.
- With the elimination of the one-time pay cuts (typically in the form of base salary) instituted during the pandemic, 2021 pay levels are expected to increase year-over-year for both indices, particularly for the Russell 3000 since base salary comprises 22.0 percent of overall pay (vs. 10.1 percent for S&P 500 CEOs). For companies that have provided forward-looking disclosure on 2021 pay levels, the average increase in base salaries is X percent.
- As companies shift back toward more standard annual incentive designs such as those in place before the pandemic, we expect that bonus outcomes will continue to vary by sector. Companies that performed unexpectedly well last year and saw large increases in executive bonuses may see more normalized results this year, particularly if goals for 2021 assume similarly strong performance levels and growth from 2020 results. The uncertainty of the COVID-19 pandemic, which impacted the ability to set long-term operating and financial targets, prompted companies to shift away from performance-restricted stock to time-based vehicles, including stock options. As companies move past the extreme uncertainty from last year and look to recovery and returning to normal, there will likely be an uptick in the prevalence of performance-based equity as companies re-introduce this vehicle back into their long-term incentive plans. There may also be an increased usage of relative metrics and/or wider goal ranges to mitigate the challenges of establishing long-term goals in a situation of continued uncertainty. Companies facing headwinds and unable to set longer-term goals may continue to rely on stock options as a vehicle. However, given that time-based stock options are not viewed as performance-based vehicles by proxy advisors and select investors, it is unlikely that options will become a primary long-term incentive vehicle for most companies.
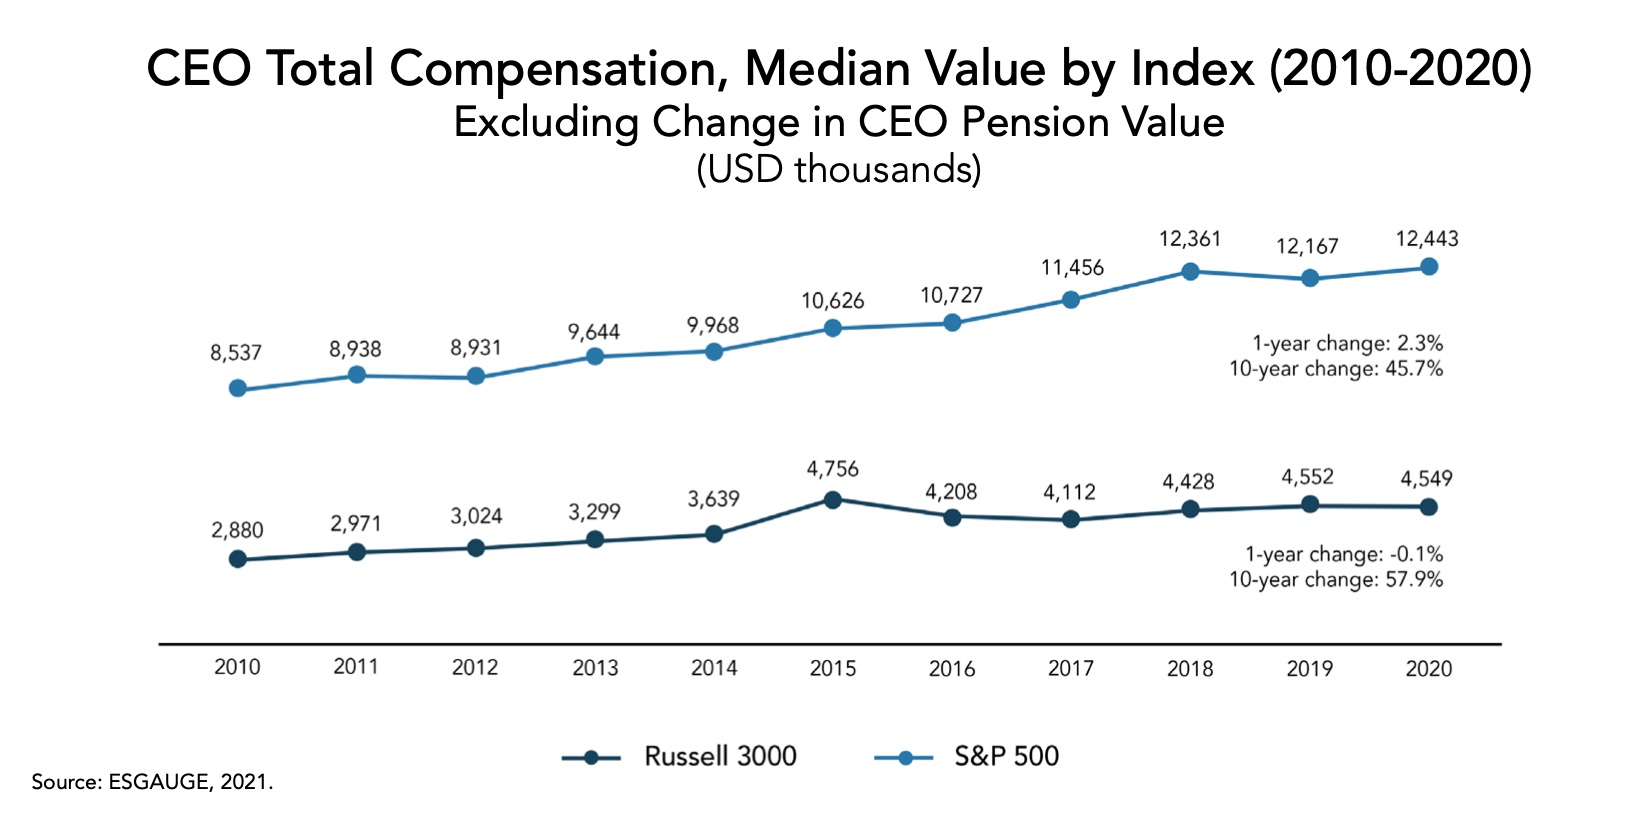
Median CEO total compensation (excluding change in pension values) for 2020 was up slightly from the levels recorded last year in the S&P 500 and roughly flat in the Russell 3000. Median CEO base salaries were down for both indices, impacted by salary reductions during the pandemic. While fewer than half of CEOs received salary increases, the mean increases were generally larger than those observed last year.
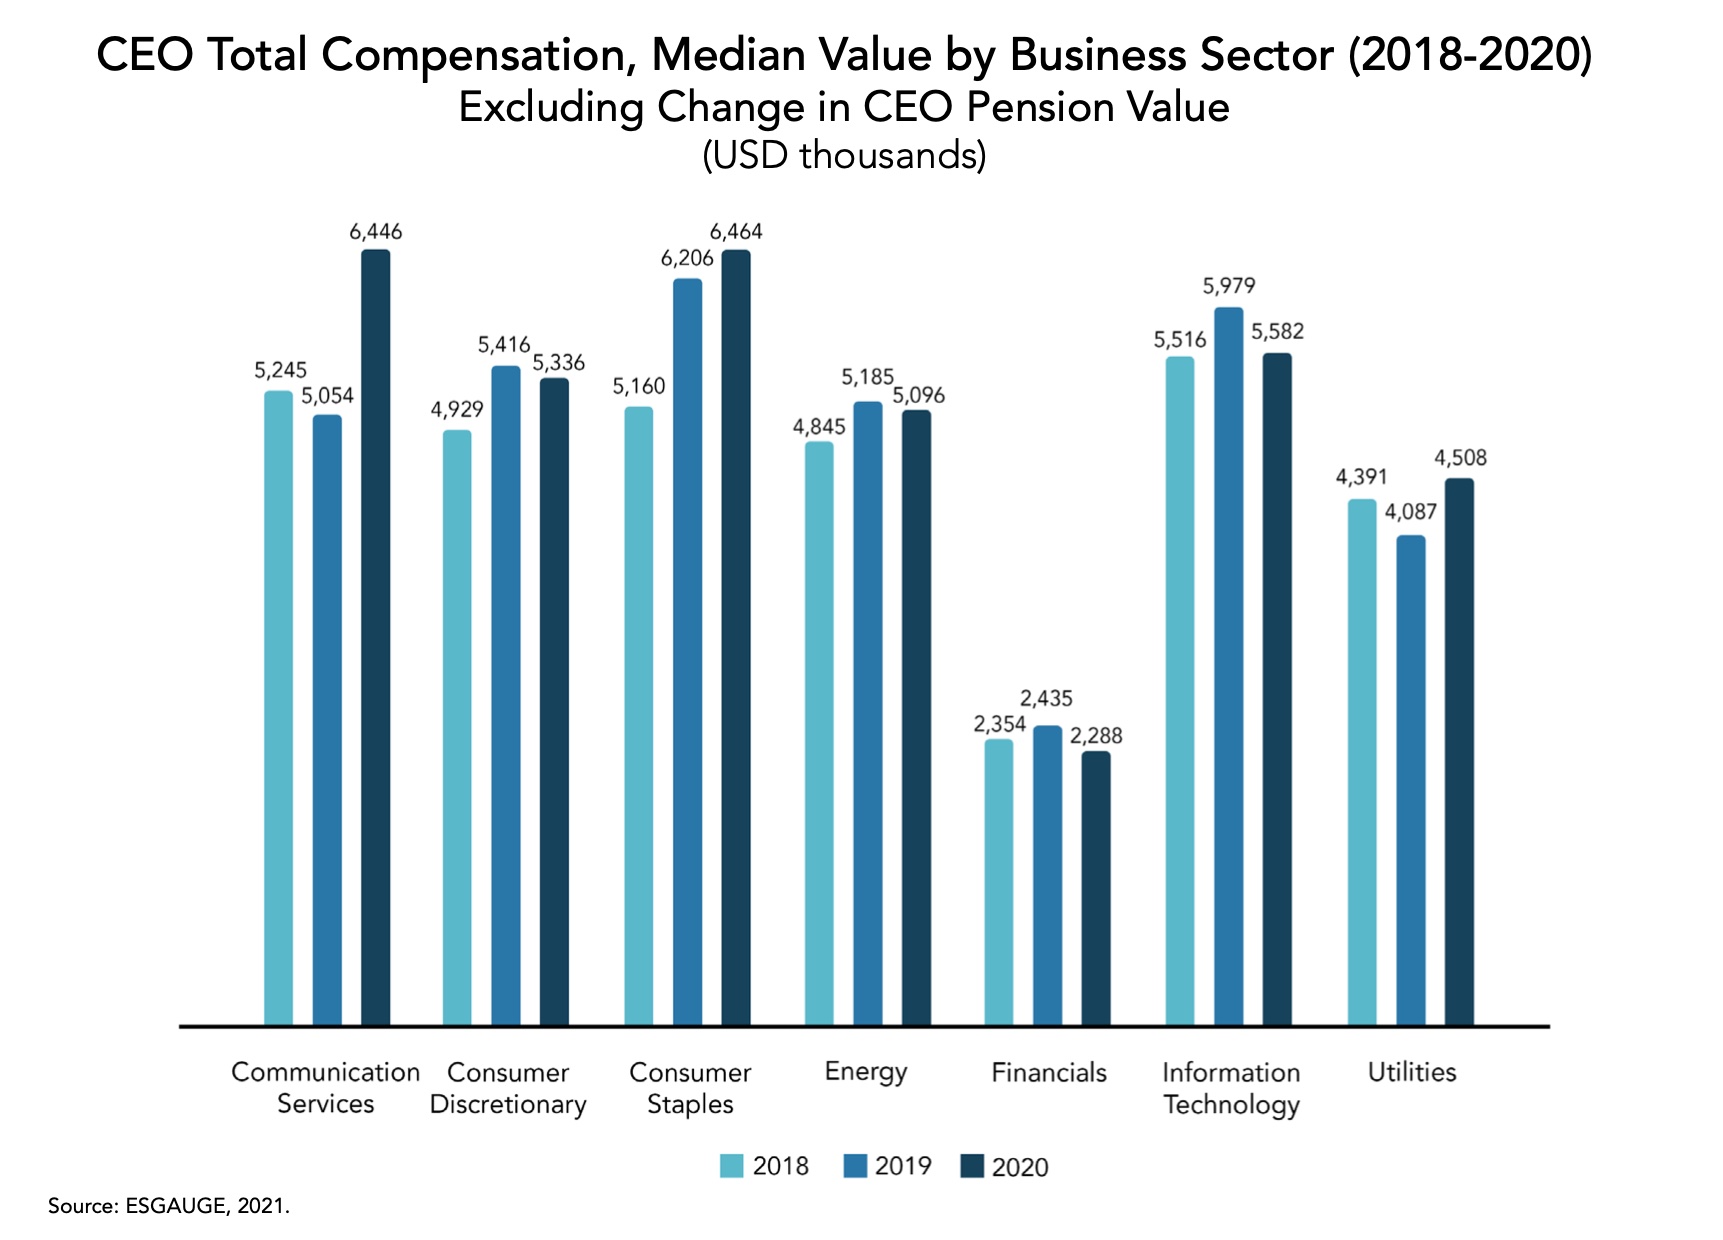
S&P 500 CEOs saw a 2.3 percent increase in median total compensation (excluding change in pension values) in 2020 while Russell 3000 CEOs had a 0.1 percent decrease in median total compensation. Median CEO total compensation (excluding change in pension values) was down in four business sectors (consumer discretionary, energy, financials, and information technology). By contrast, it was up by 4.2 percent for consumer staples, 10.3 percent for utilities and as much as 27.5 percent in communication services.
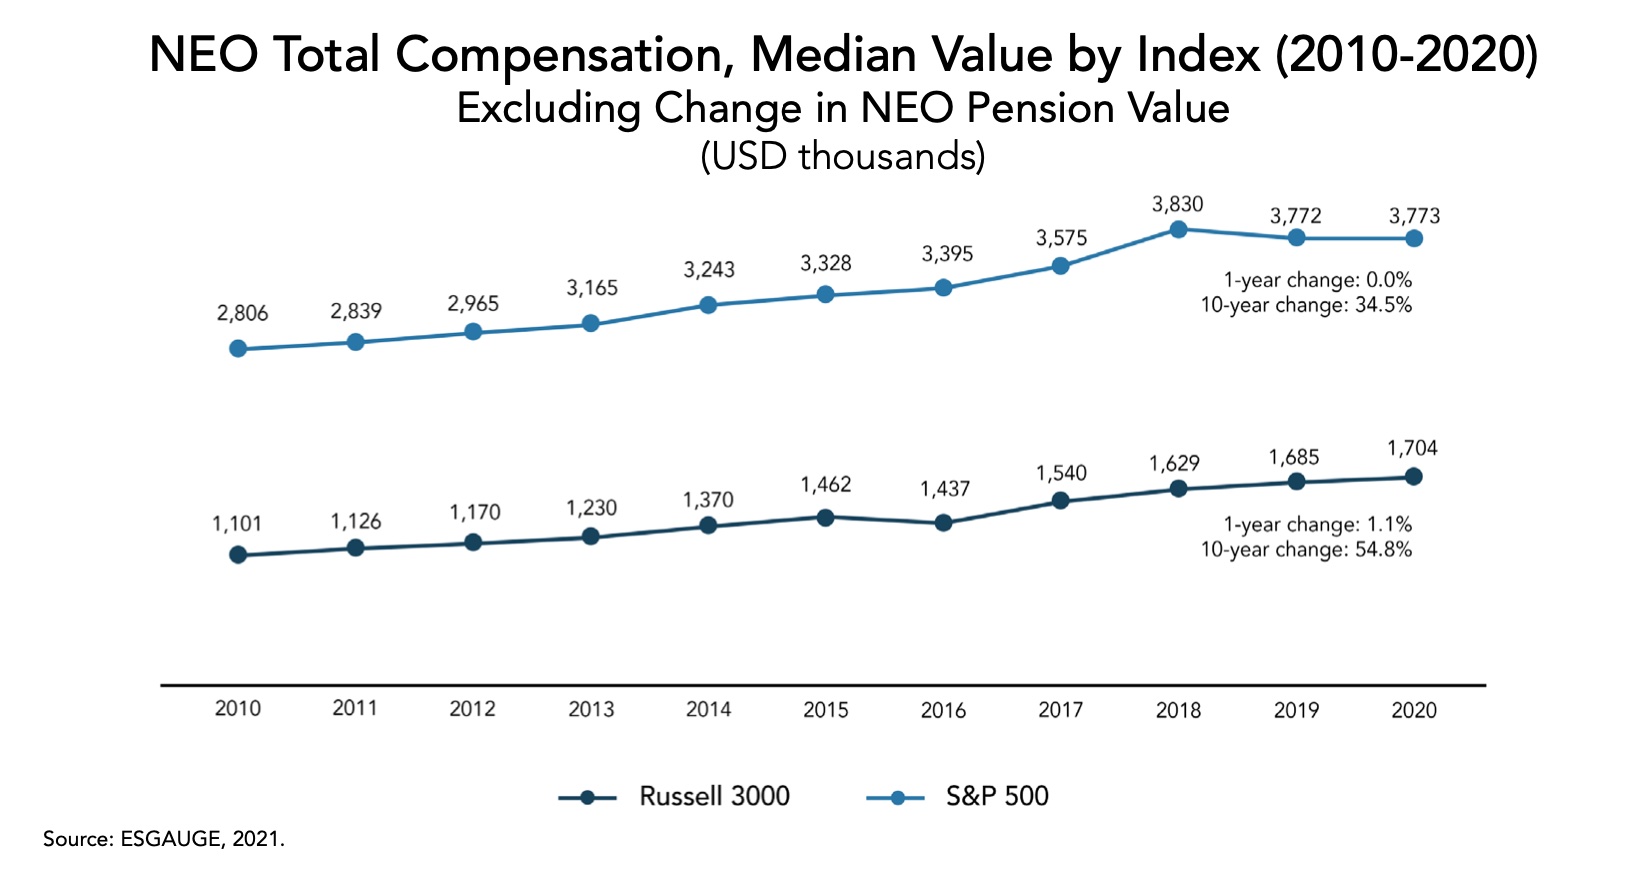
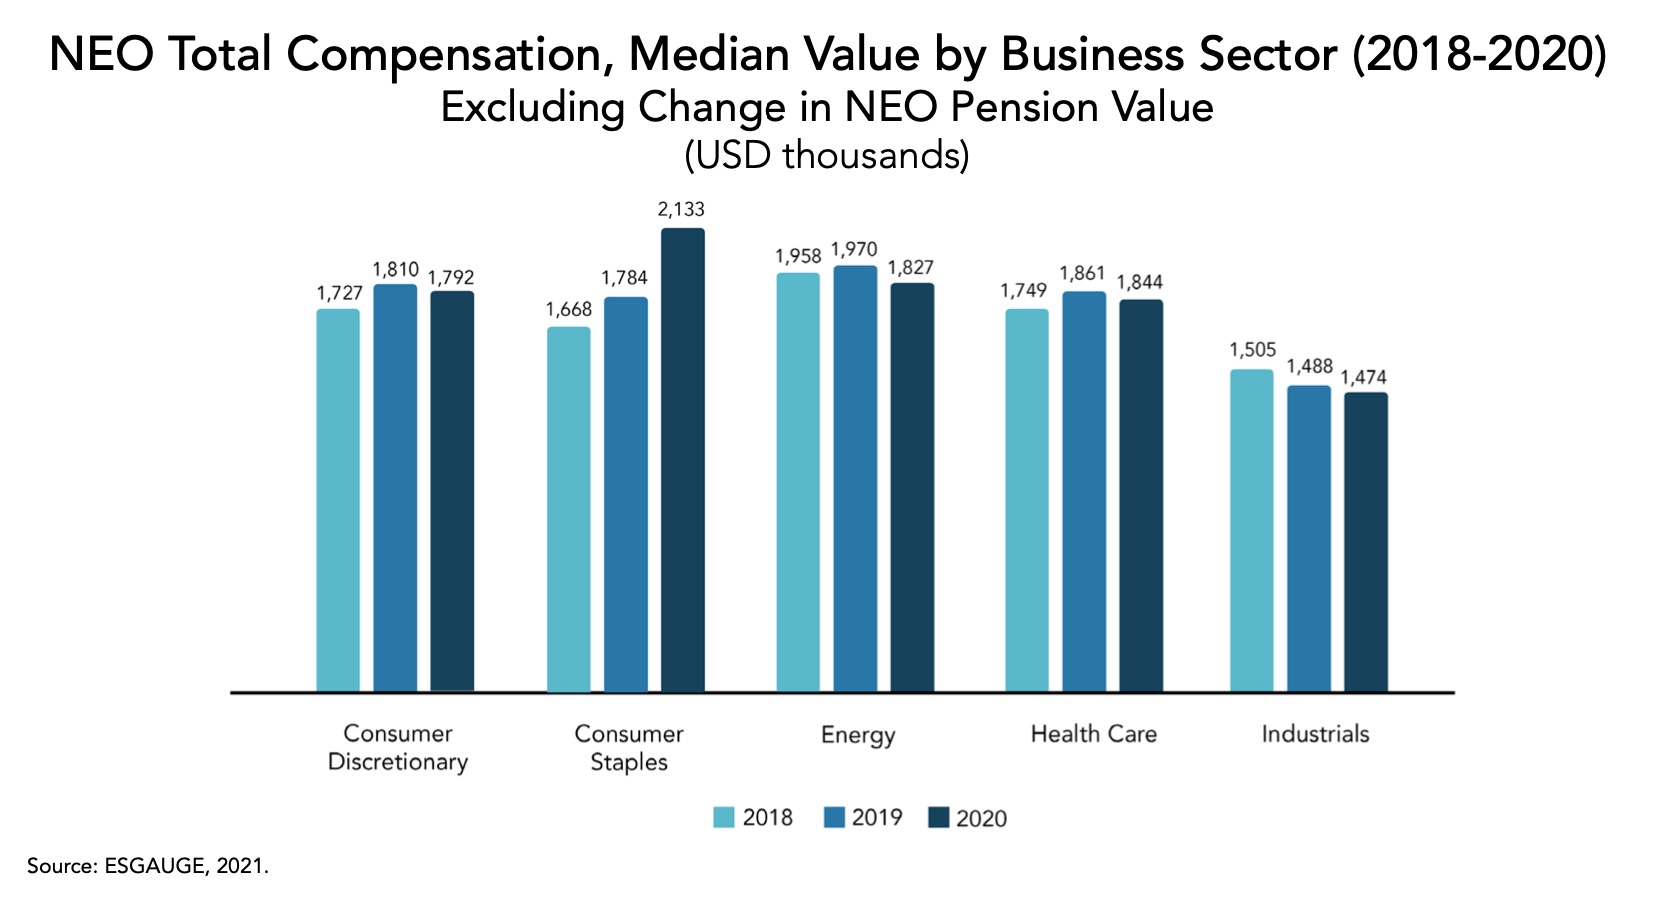
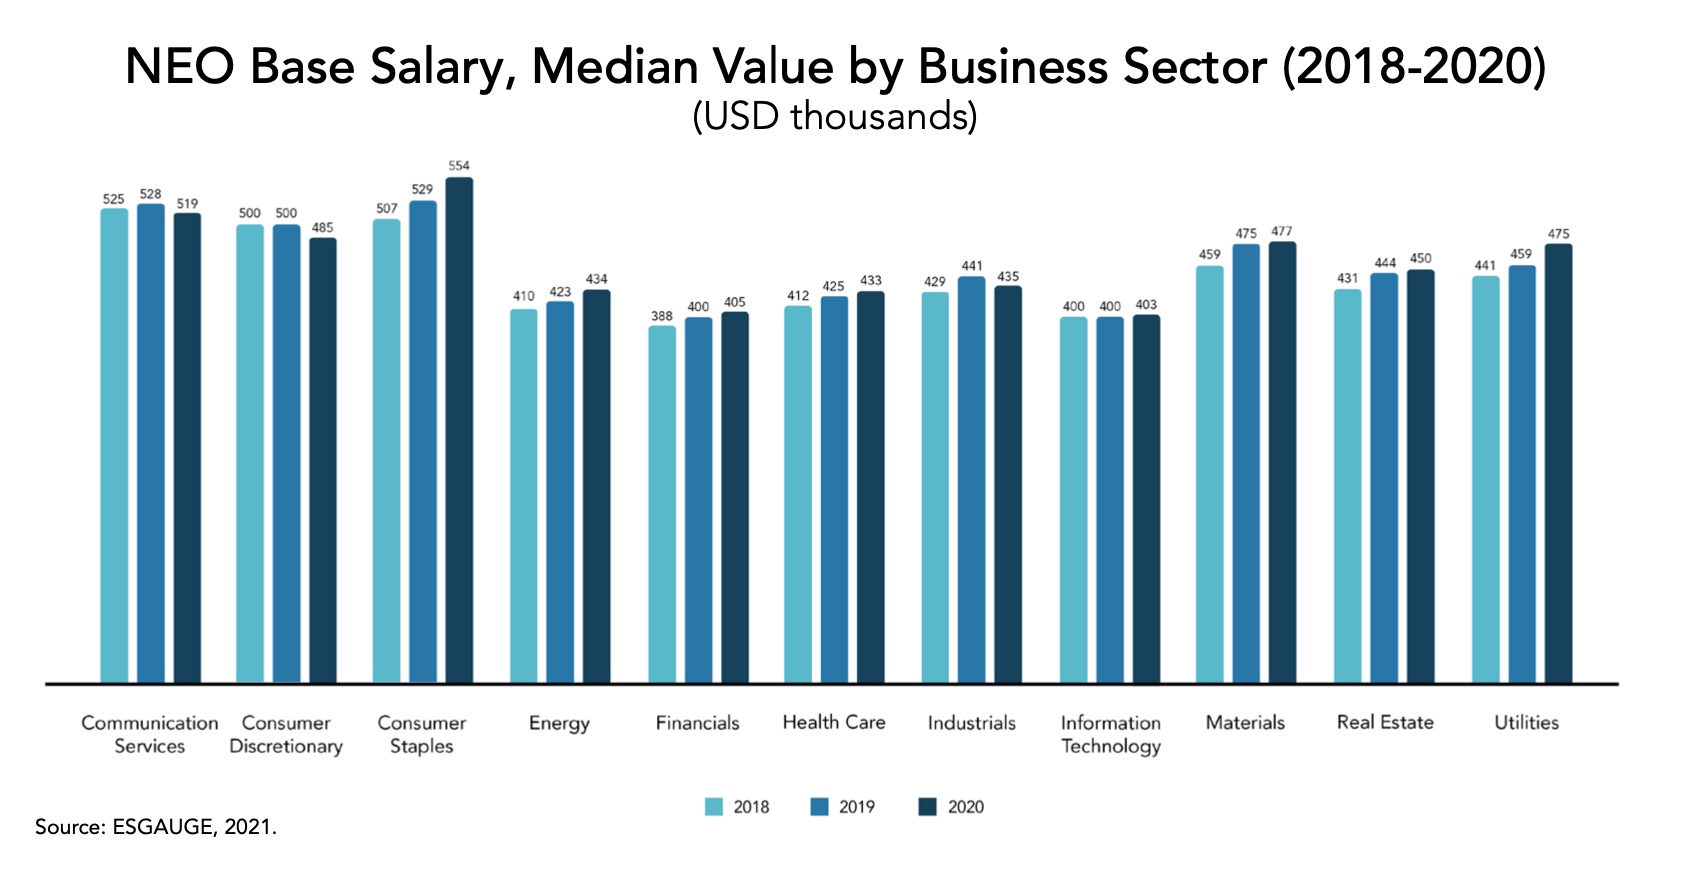
Median NEO total compensation (excluding change in pension values) was flat for the S&P 500 and up slightly at 1.1 percent for the Russell 3000. Like CEO pay, median NEO total compensation (excluding change in pension values) was down in four business sectors, two of which also saw decreases in CEO pay (consumer discretionary and energy). The other two sectors that saw declines were health care and industrials. Consumer staples saw the largest year-over-year increase in median NEO total compensation of nearly 20 percent, driven by increases across all pay elements (base, annual bonus, and equity). Nearly 70 percent of consumer staples companies reported NEO base salary increases (mean increase of 9.1 percent), up from 52.3 percent last year. Over 50 percent reported increases in annual bonuses, which had a mean increase of 172 percent, likely driven by strong performance in the last year and to a lesser extent, increases in base salaries.
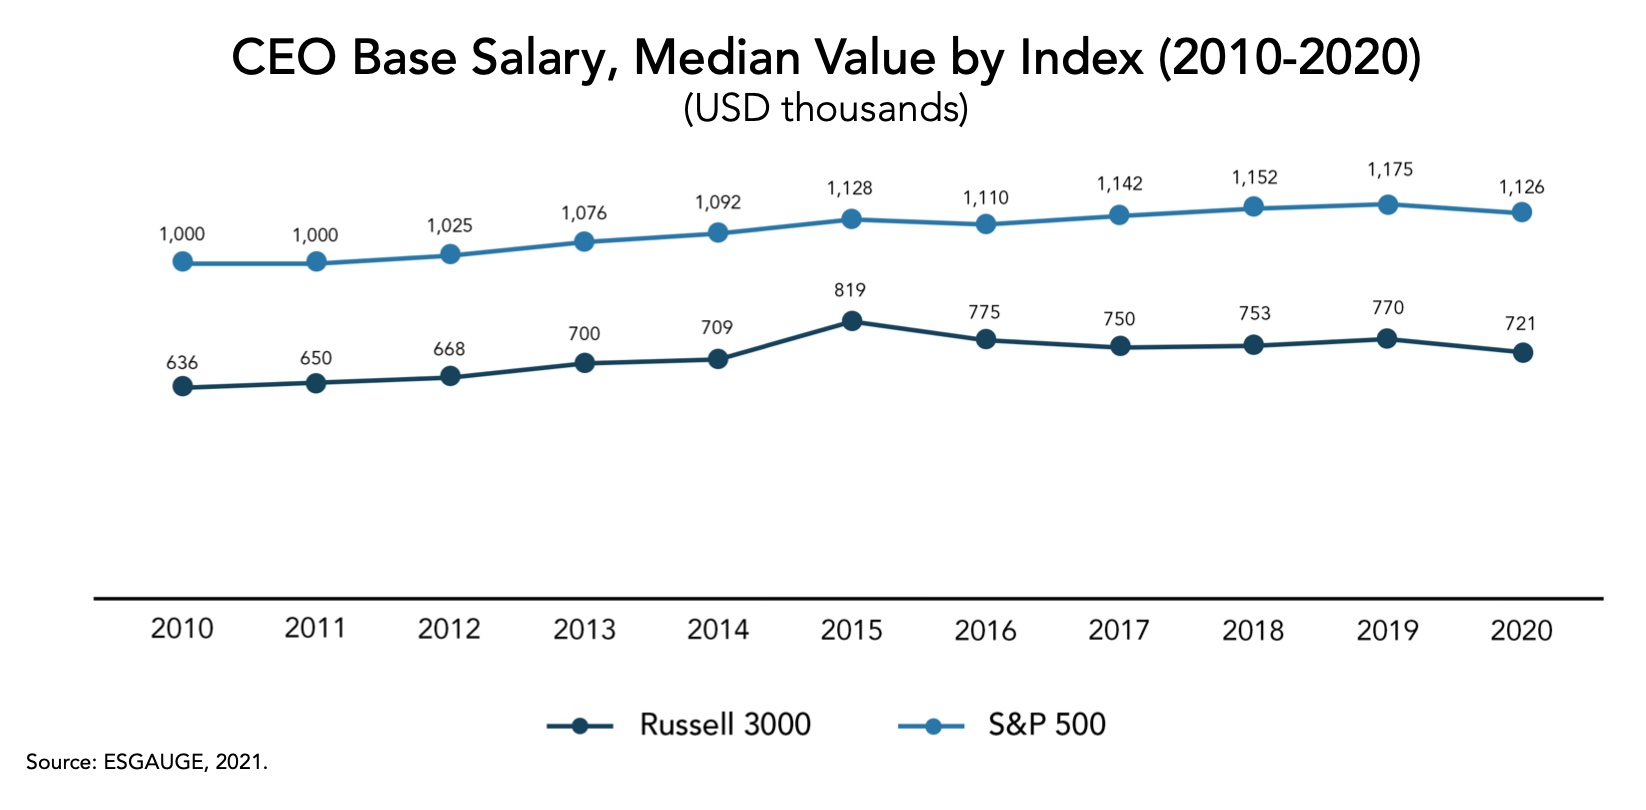
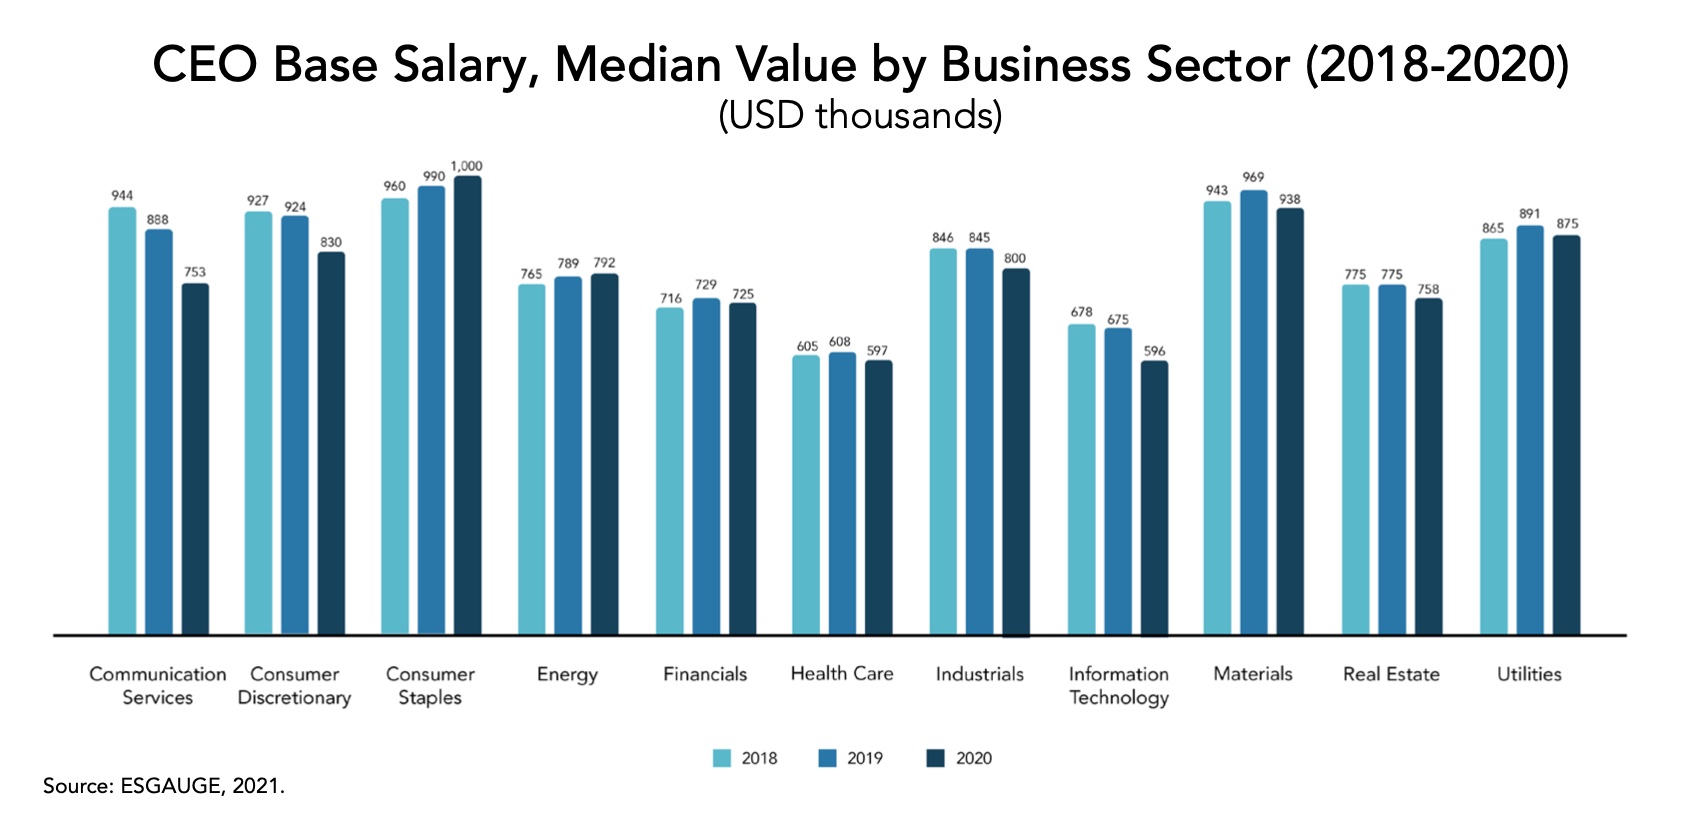
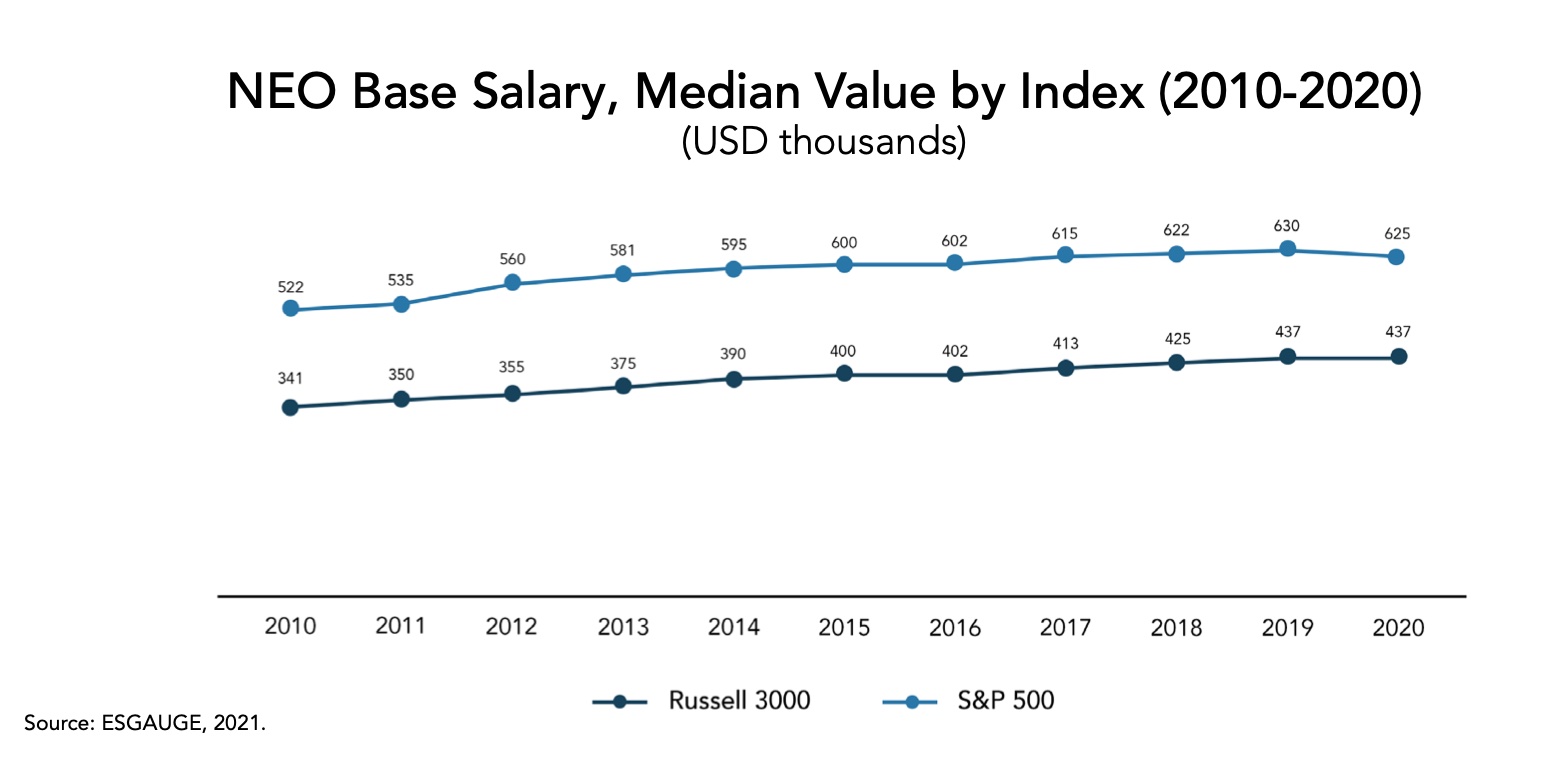
Because of the COVID-19 pandemic, 23.6 percent of S&P 500 and 24.8 percent of Russell 3000 companies reported 2020 salary reductions for management as a measure of liquidity preservation and a sign of solidarity with employees during the “lockdown.” While the reduction announcements began mostly with the consumer discretionary and industrials sectors, which were initially hardest hit by the pandemic, the salary reductions spread to include other sectors. Even though only a subset of companies adopted such measures, the number was high enough to affect overall compensation trends. Median CEO base salaries were down 4.2 percent and 6.4 percent for the S&P 500 and Russell 3000, respectively. All but two business sectors (Consumer Staples and Energy) also saw declines in median CEO base salaries. CEOs generally experienced larger pay reductions than their NEO counterparts. As a result, the year-over-year change in median NEO base salaries was more muted—S&P 500 NEOs saw a 0.8 percent decline while Russell 3000 NEOs saw a 0.1 percent increase. Only three business sectors (Communication Services, Consumer Discretionary, and Industrials) saw declines in median NEO base salary.
In both indices, fewer than half of CEOs received base salary increases (44.0 percent for the S&P 500 and 47.0 percent for the Russell 3000). By revenue size, the average increases were generally higher than the prior year except for companies with revenues below $1 billion and companies with revenues between $5 billion and $9.9 billion. Companies with revenues above $10 billion saw significantly higher average increases compared to the prior year. The average increase for companies with revenue between $10 and $24.9 billion was 61.2 percent (vs. 6.3 percent in the prior year), while the average increase for companies with revenues between $25 and $49.9 billion was 120.1 percent (vs. 6.0 percent in the prior year).
More than half of NEOs received base salary increases (58.3 percent in the S&P 500 and 55.6 percent in the Russell 3000), relatively consistent with the prior year. Average increases were in the high single-digits to low double-digits across business sectors and companies with different revenue sizes.


What’s ahead? With the elimination of the one-time pay cuts (typically in the form of base salary) instituted during the pandemic, 2021 pay levels are expected to increase year-over-year in both indices, and particularly in the Russell 3000, since base salary comprises 22.0 percent of overall pay (vs. 10.1 percent for S&P 500 CEOs). For companies that have provided forward-looking disclosure regarding their 2021 pay levels, the average increase in base salaries is 9.3 percent.
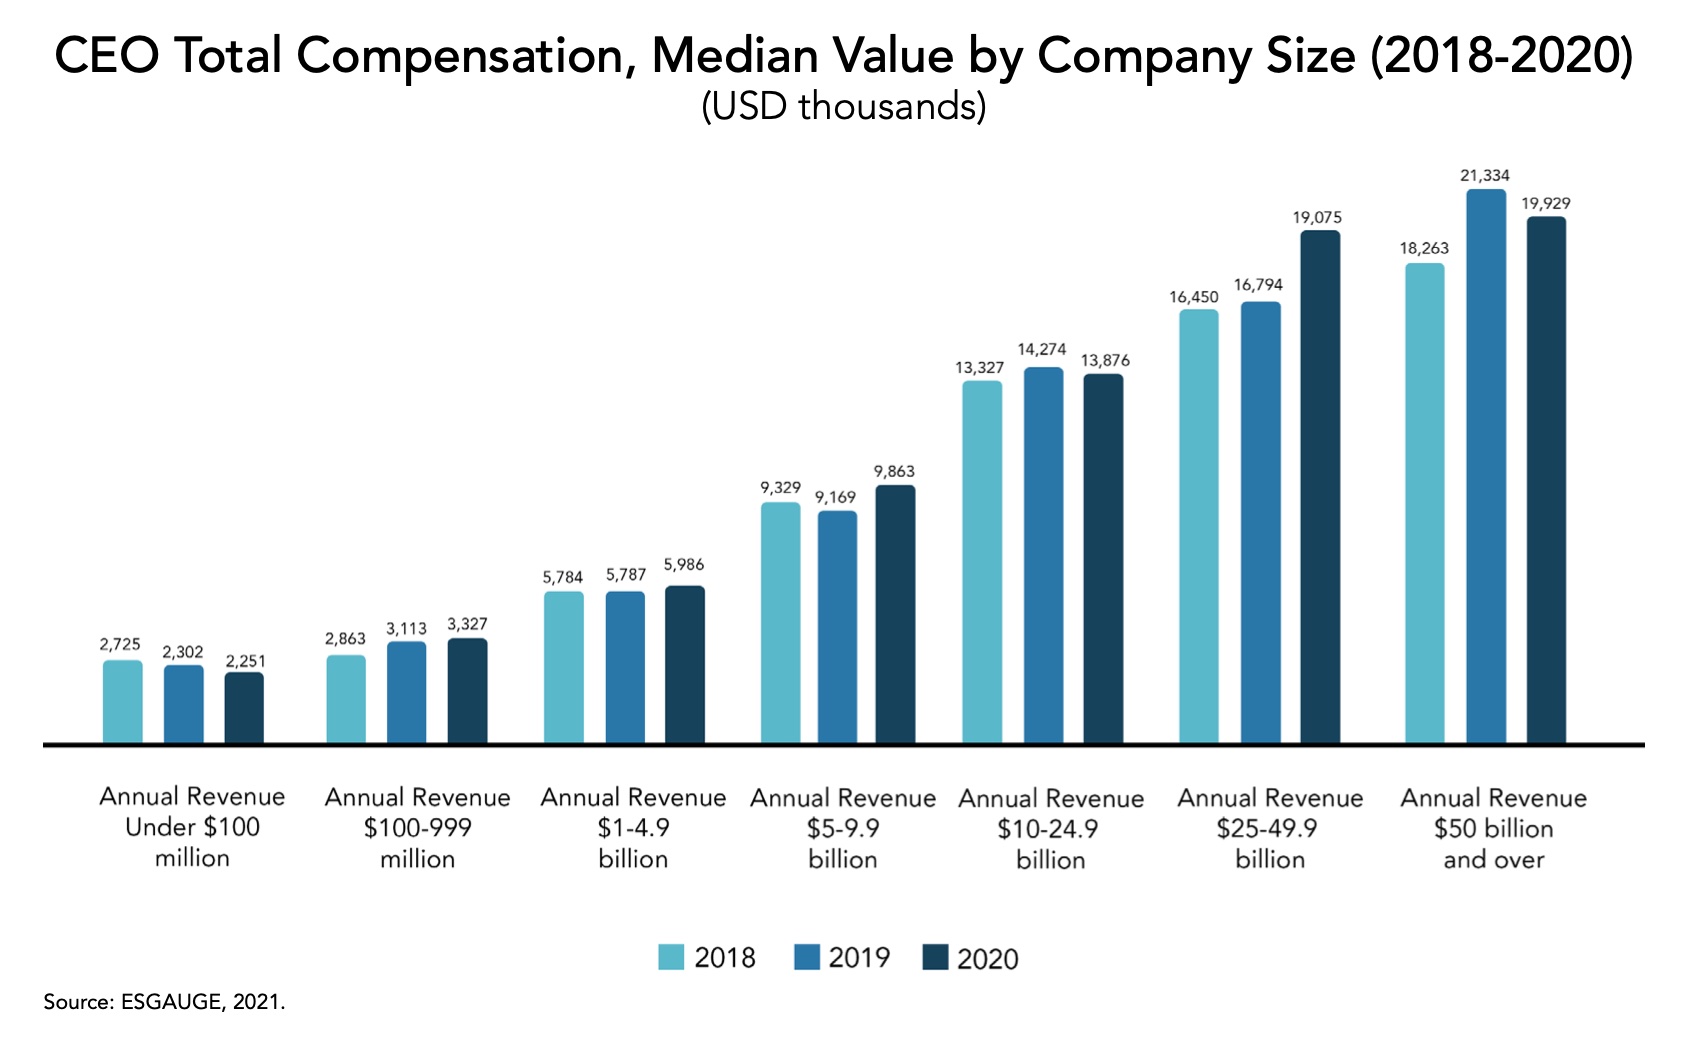
Median CEO total compensation continues to be positively correlated with company size, although the relationship weakens for companies with revenues above $50 billion.
As company size increases, median CEO total compensation tends to scale accordingly. For example, median CEO total compensation in 2020 was approximately $2.3 million for Russell 3000 companies with revenues under $100 million and approximately $3.3 million for companies with revenues between $100 million and $999 million. This relationship applies to the other size groups by revenue. However, the increase in median CEO total compensation is smaller proportionately for companies with revenues exceeding $50 billion (approximately $19.9 million) compared to median CEO total compensation for companies with revenues between $25 billion and $49.9 billion (approximately $19.0 million).
Median NEO total compensation is also generally positively correlated with company size. However, median pay is approximately flat for companies with revenues between $5 billion and $9.9 billion and for Russell 3000 companies with revenues between $10 billion and $24.9 billion (both size groups have median pay of approximately $4 million). NEO compensation varies more widely given differences in roles and responsibilities.
What’s ahead? The positive correlation between revenue size and executive pay reinforces the importance of selecting similarly sized companies when developing a peer group used for benchmarking pay levels. In cases where the peer group includes significantly larger companies, companies should be prepared to provide the rationale for the inclusion of larger peers. More conservative positioning against a larger peer group (e.g., below the 50th percentile) can also help to minimize external scrutiny from investors.
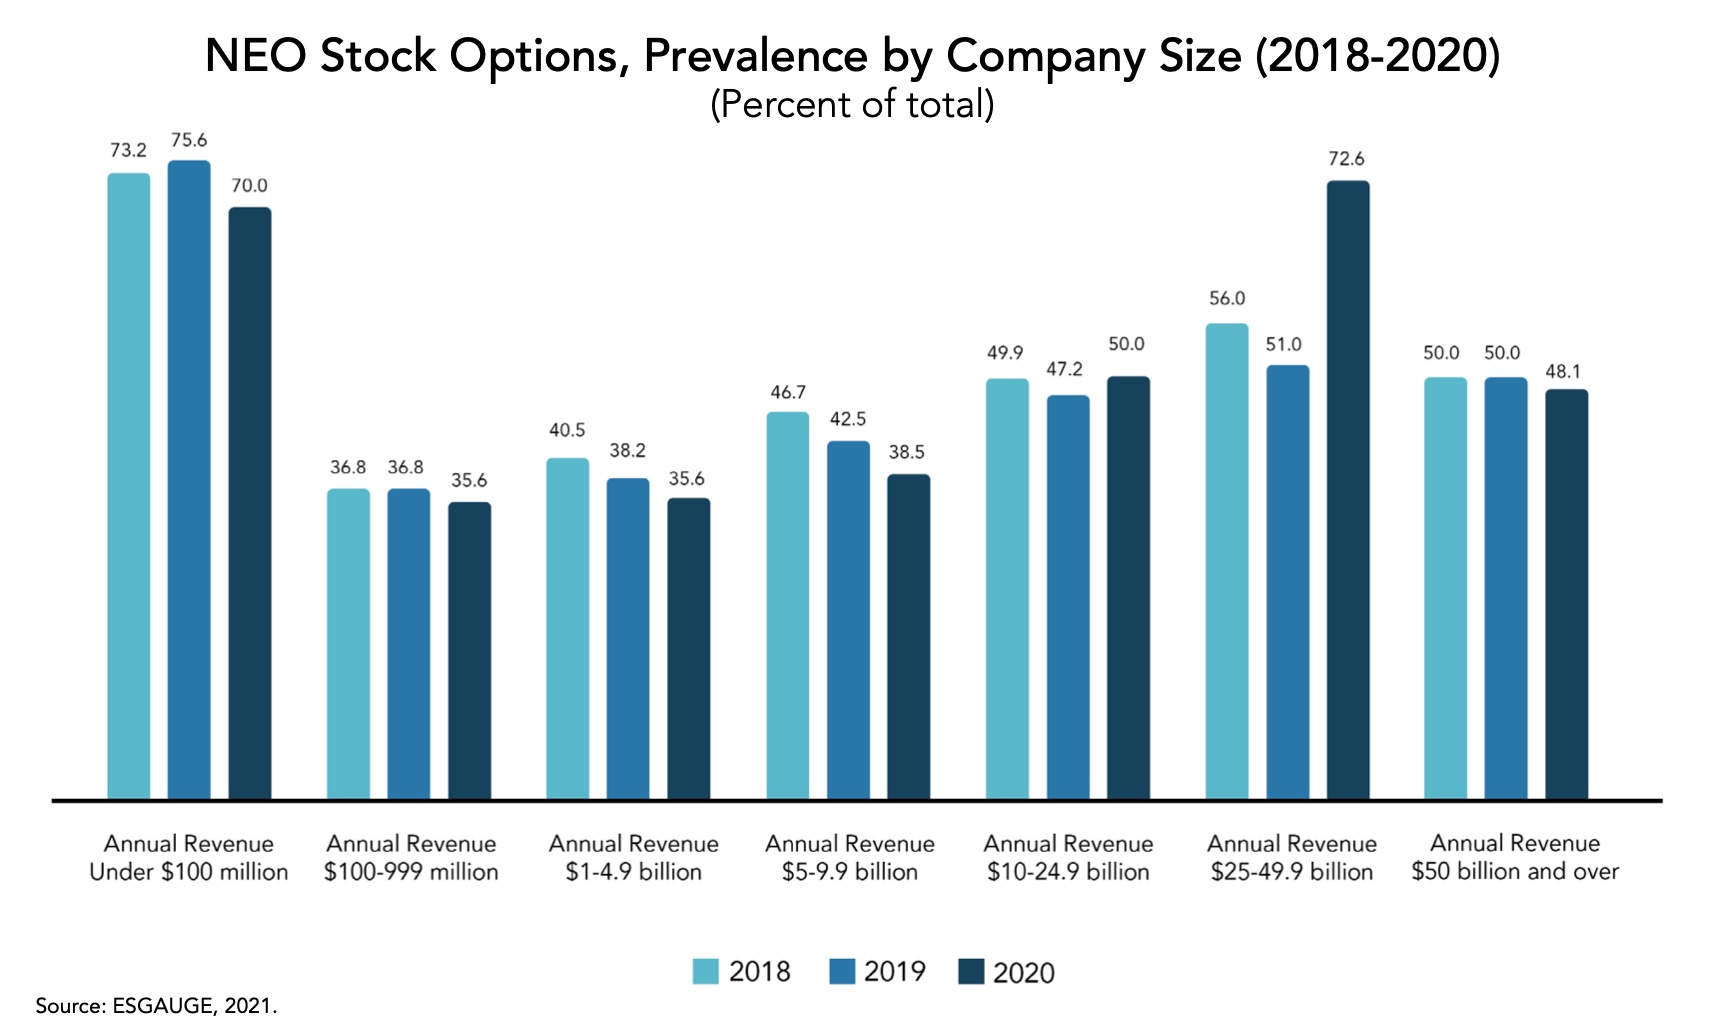
In 2020, the prevalence of stock options for CEOs and NEOs increased significantly for Russell 3000 companies with revenues between $25 billion and $49.9 billion from approximately 50 percent prevalence to more than two-thirds. Stock options as a percent of overall pay also increased from slightly over 10 percent to nearly 20 percent for CEOs and from about 10 percent to over 15 percent for NEOs. The increased weighting on stock options for CEOs and NEOs was partially offset by a decrease in the weighting of stock awards.
For CEOs at Russell 3000 companies with revenues between $25 billion and $49.9 billion, the prevalence of stock options increased from 53.2 percent to 67.7 percent. For NEOs, the prevalence of stock options increased from 51.0 percent in 2019 to 72.6 percent in 2020. Stock option usage at these larger companies was comparable to companies with revenues under $100 million (71.6 percent for CEOs and 70.0 percent for NEOs).
Companies with revenues between $10 billion and $24.9 billion also saw an increase in stock option prevalence, but at a lower rate (for CEOs, stock option prevalence increased from 48.9 percent in 2019 to 51.8 percent in 2020; for NEOs, prevalence increased from 47.2 percent to 50.0 percent). Stock options are not as widely used for all other revenue groups, although prevalence still ranges from approximately 35 percent to 40 percent.

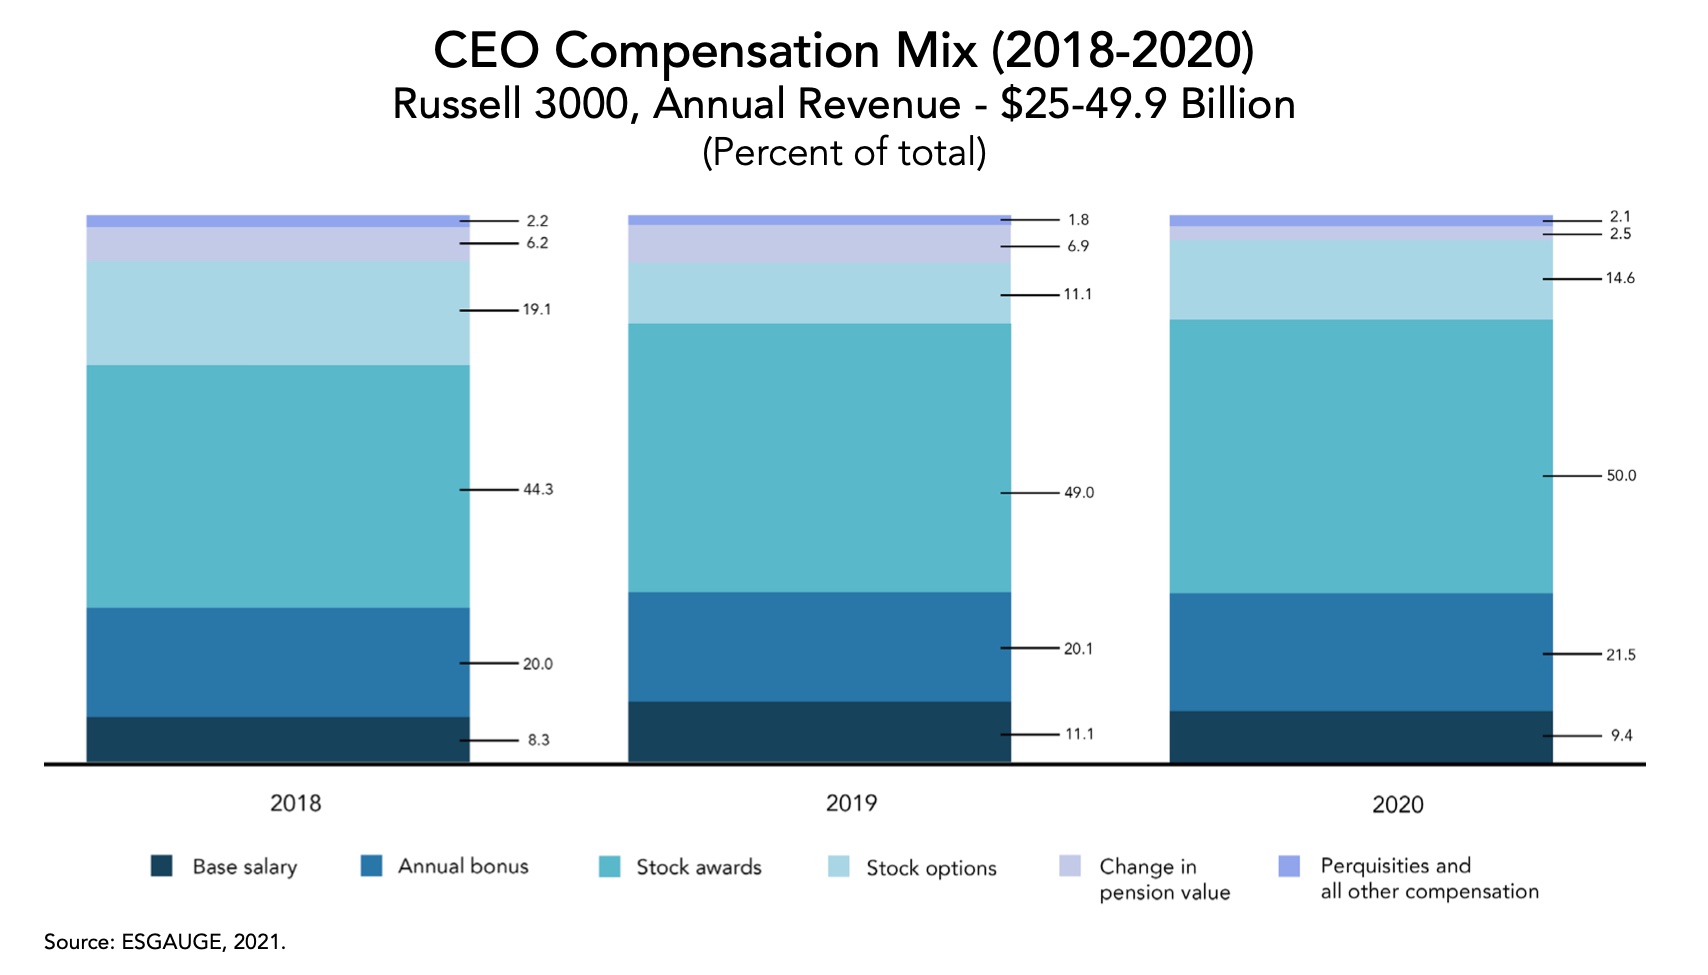
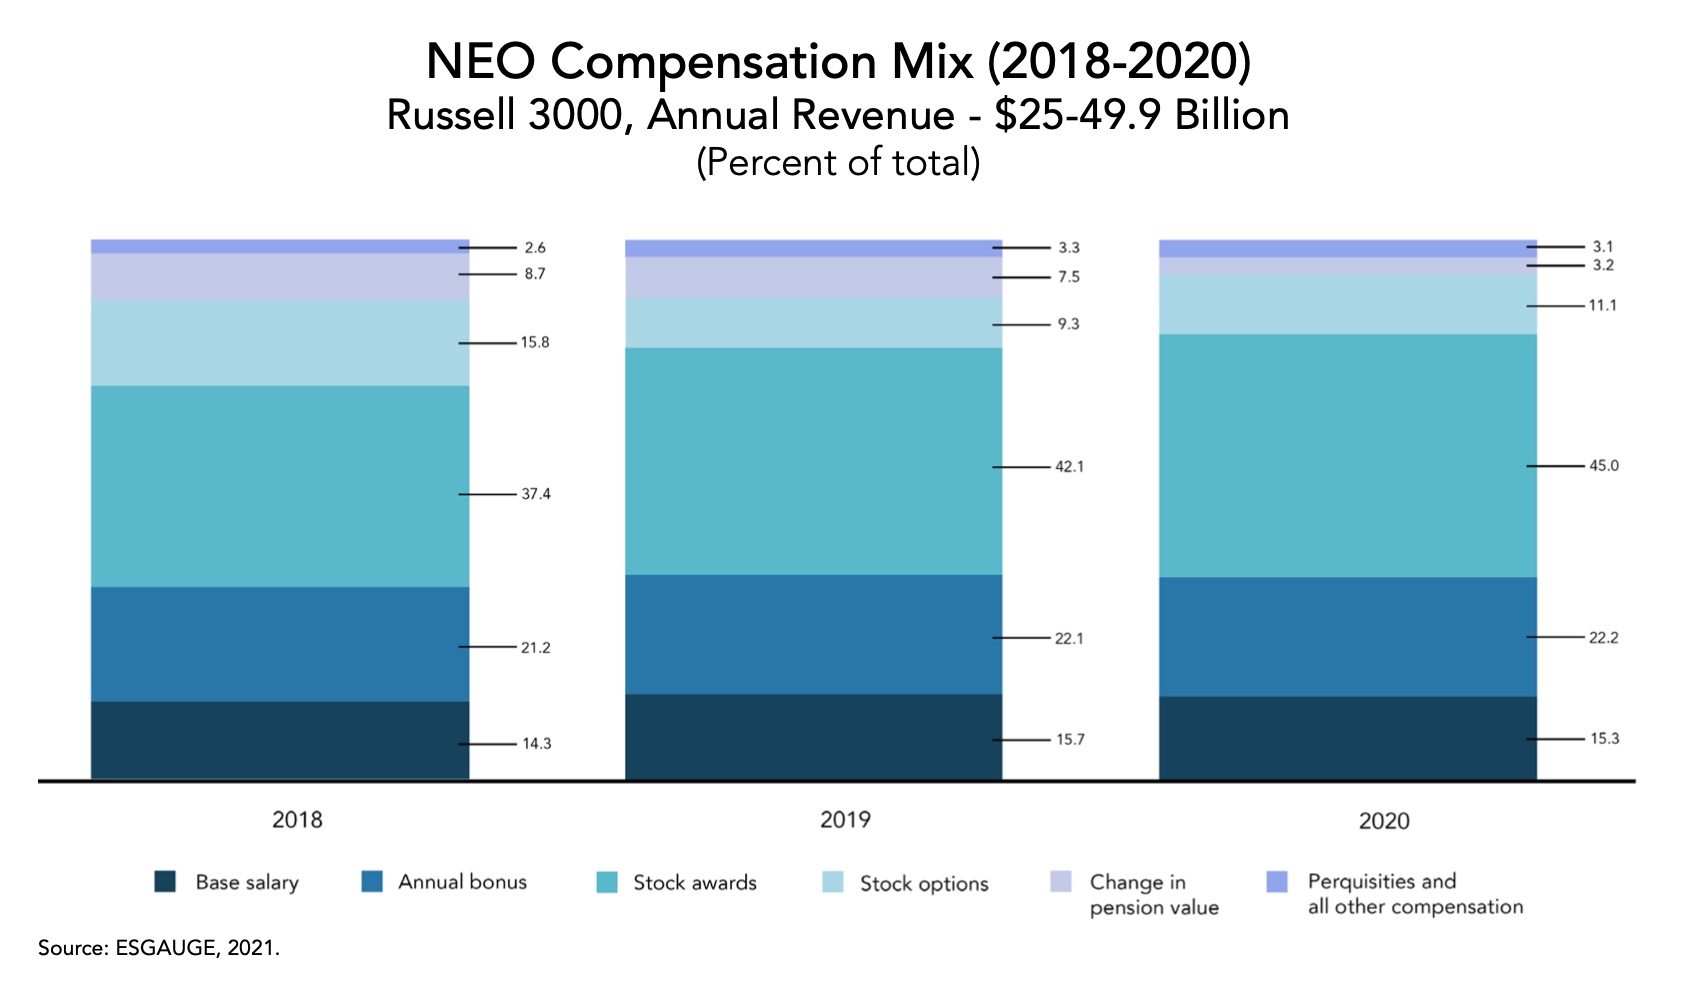
In addition to a rise in stock option prevalence, companies with revenues between $25 billion and $49.9 billion saw an increased weighting in stock options as a percentage of overall pay. In 2019, stock options comprised 11.1 percent of CEO pay, and in 2020, stock options were 19.1 percent of CEO pay. NEOs also saw a similar increase in the weighting of options—9.3 percent in 2019 vs. 15.8 percent in 2020. The rise in stock options was offset by reduced weightings of stock awards for both CEOs and NEOs. In 2020, stock awards comprised 44.3 percent of CEO pay, down from 49.0 percent in the prior year, and represented 37.4 percent of NEO pay, down from 42.1 percent in the prior year.
What’s ahead? Given the uncertainty last year from the COVID-19 pandemic, which impacted the ability of many companies to set long-term operating and financial targets, companies shifted away from performance-restricted stock to time-based vehicles, including stock options. While stock options will likely remain a majority practice for executives at companies with revenues above $10 billion, the weighting on stock options may fall back down to 2019 levels as companies reincorporate performance-restricted stock back into their incentive plans. Given that time-based stock options are not viewed as performance-based vehicles by proxy advisors and select investors, it is unlikely that options will become a primary long-term incentive vehicle for most companies.
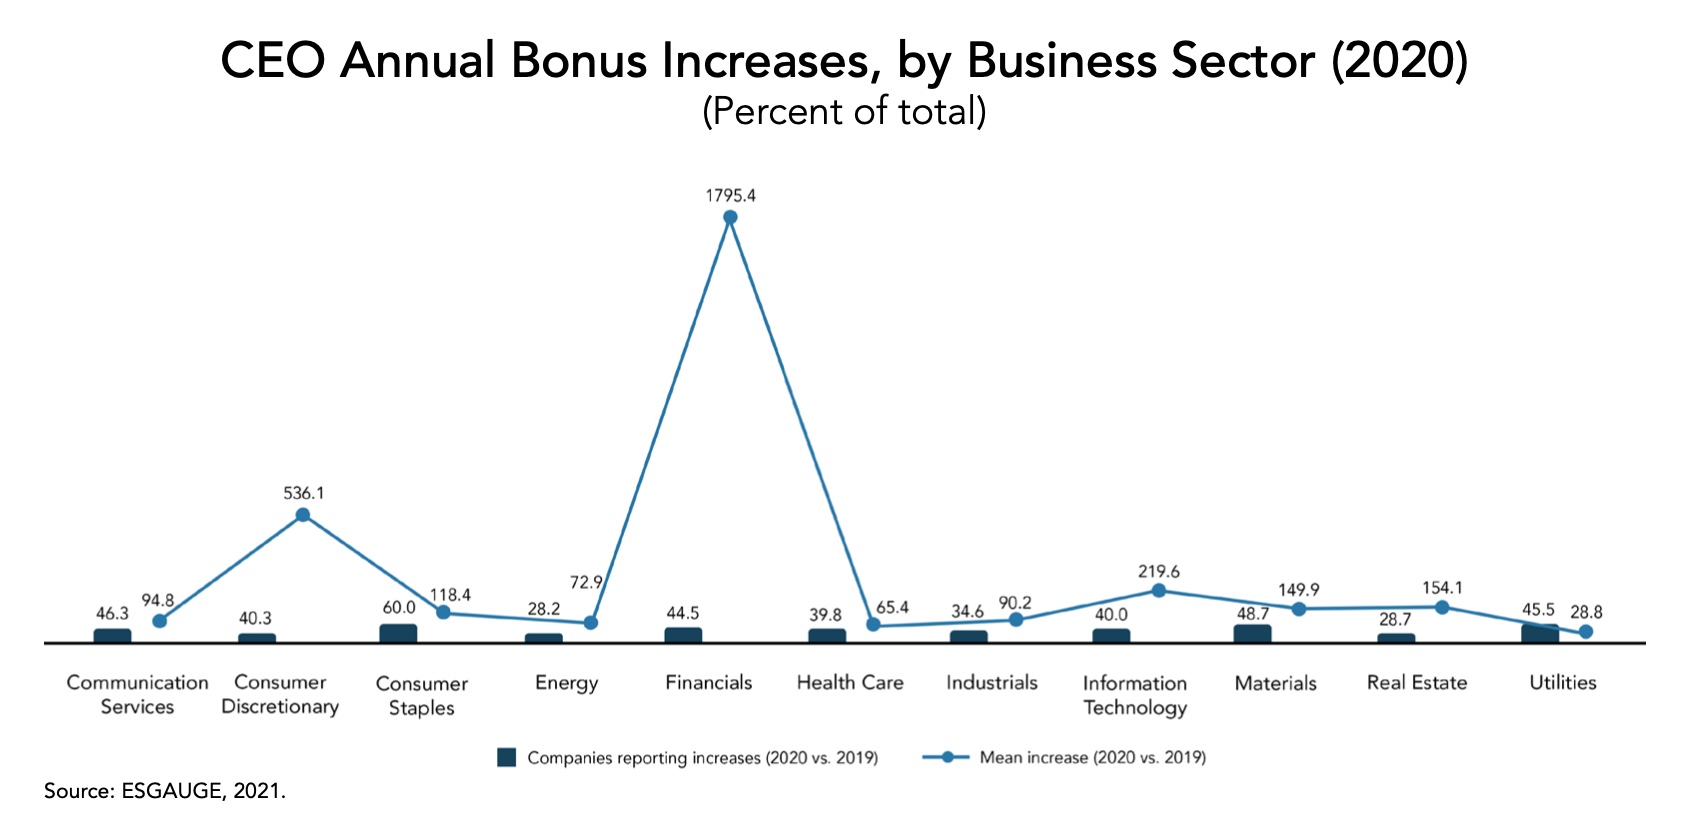
Median CEO annual bonuses generally saw double-digit increases in 2020. Only three business sectors (energy, financials, and real estate) saw a decline in median CEO bonuses and had fewer CEOs receiving a larger bonus than the prior year.
Despite a challenging year due to the COVID-19 pandemic, CEOs generally saw an uptick in their annual bonuses in 2020. Of the business sectors that saw an increase in median CEO bonuses, all but two (health care and information technology) saw more than 10 percent increases, far exceeding the low single-digit average increases in median CEO pay across business sectors in the last 10 years. CEOs at consumer staples companies saw the largest increase at 40.3 percent.
CEOs in the energy, financials, and real estate sectors saw their median annual bonuses fall by 12.5, 11.1, and 17.5 percent, respectively. Less than 30 percent of CEOs in the energy and real estate sectors received bonus increases year-over-year, below the 40 to 50 percent prevalence generally observed for the other sectors. While more CEOs in the financial sector received bonus increases (44.5 percent in 2020), it was still a slight decline from the prevalence in the prior year (45.7 percent in 2019). In contrast, more than half of CEOs in the consumer staples sector received larger bonuses in 2020, with a median increase of over 40 percent.
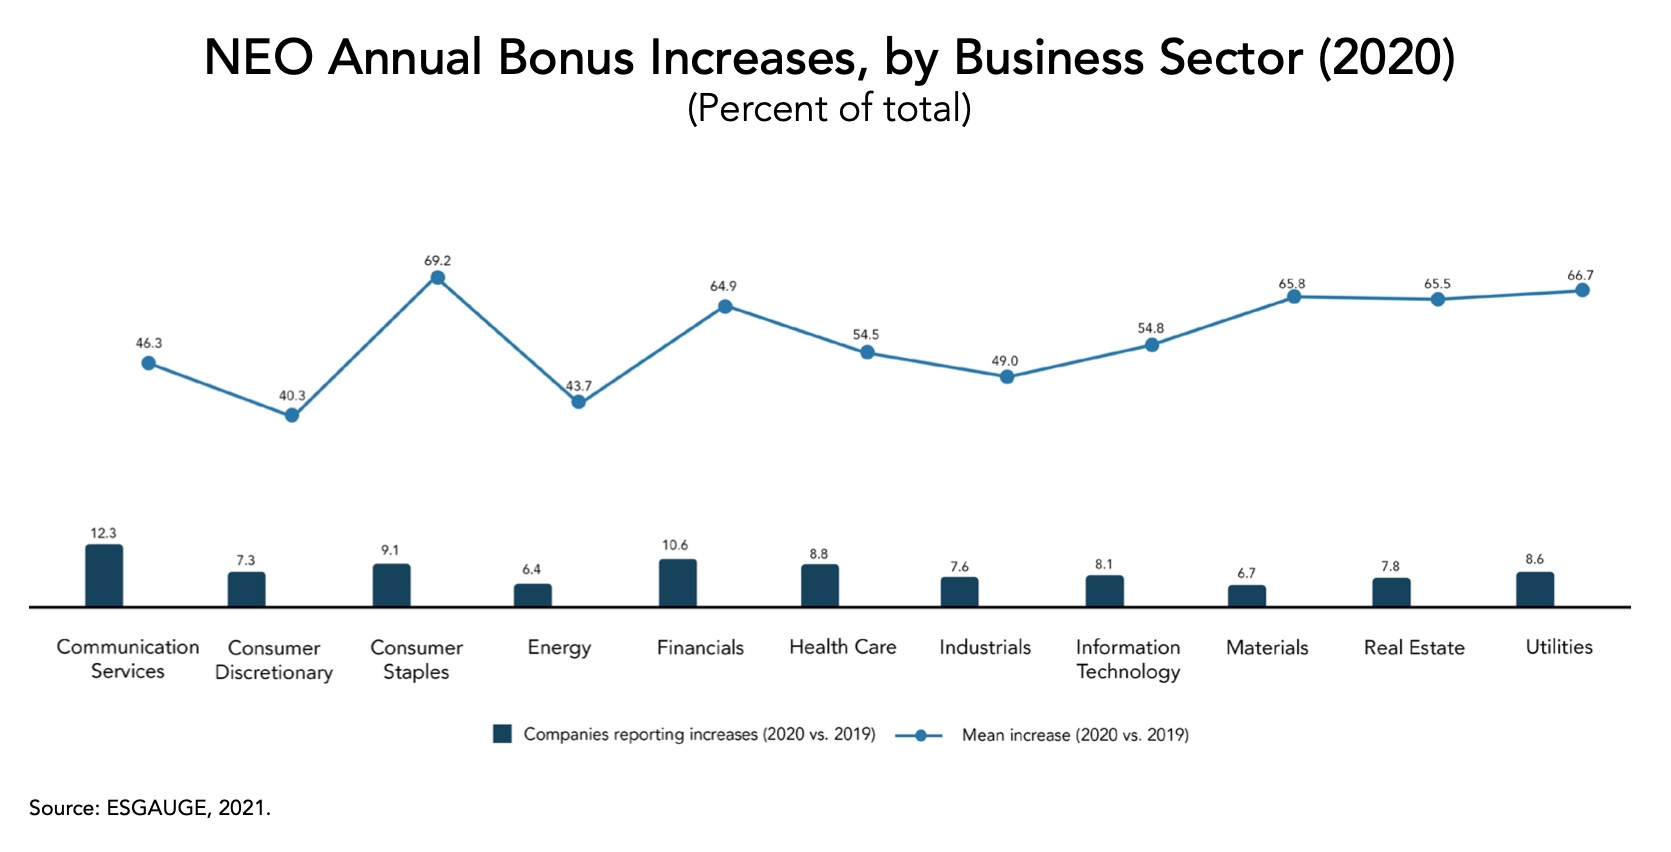
NEOs also experienced increases to median bonuses across nearly all business sectors—only four sectors (communication services, energy, financials, and real estate) decreased. Median increases were generally larger than those observed for CEOs. For example, NEOs at consumer staples companies saw a 48.0 percent increase in their median bonus (vs. 40.3 percent increase for CEOs), while NEOs at information technology companies saw a 12.4 percent increase (vs. 4.7 percent increase for CEOs).
What’s ahead? In response to economic uncertainty during the pandemic, several companies adjusted their annual incentive plans. Adjustments ranged from adding new metrics focused on liquidity or strategic measures that are more within executives’ control to modifying the performance period to measure partial-year performance. Some companies also reset goals partway through the performance period based on updated projections, while others allowed for Committee discretion to determine payouts based on a holistic performance review. These actions likely allowed companies to provide a partial or above-target payout in a year where no bonus may have been earned, resulting in higher bonus outcomes year-over-year.
Given the higher scrutiny from investors and proxy advisors on CEO pay, Compensation Committees likely exercised more caution in determining CEO bonus outcomes and had more degrees of freedom for NEO bonuses, which could explain the larger year-over-year increases in median NEO bonuses relative to median CEO bonuses.
As companies shift back toward more standard annual incentive designs in place before the pandemic, we expect that bonus outcomes will continue to vary by sector. Companies that performed unexpectedly well last year and saw large increases in executive bonuses may see more normalized results this year, particularly if goals for 2021 assume similarly strong performance levels and growth from 2020 results.
