 Print
PrintSubodh Mishra is Global Head of Communications at Institutional Shareholder Services, Inc. This post is based on a publication by Hernando Cortina, CFA, Head of Index Strategy, and Brian Kennedy, Index Strategy Associate, at ISS ESG.
Related research from the Program on Corporate Governance includes The Illusory Promise of Stakeholder Governance (discussed on the Forum here) and Will Corporations Deliver Value to All Stakeholders? (discuss on the Forum here) both by Lucian A. Bebchuk and Roberto Tallarita; Restoration: The Role Stakeholder Governance Must Play in Recreating a Fair and Sustainable American Economy – A Reply to Professor Rock (discussed on the Forum here) by Leo Strine; and Stakeholder Capitalism in the Time of COVID (discussed on the Forum here) by Lucian Bebchuk, Kobi Kastiel, and Roberto Tallarita.
For many, investing in the current market environment can be described as navigating uncharted waters. With US inflation running at a 40-year high and a rocky first half of the year for both equity and fixed income markets globally, uncertainty is high. One possible source of returns in this environment could be dividends, particularly from those companies able to grow their dividends despite the prevailing macroeconomic headwinds. Companies with dividend growth that keeps pace with inflation could potentially be favored by investors.
Despite market uncertainties, investor interest in Environmental, Social, and Governance (ESG) considerations remains high. Flows into ESG exchange-traded funds, while slowing down compared to 2021, have remained positive this year. Understanding the relationship between ESG scores and subsequent dividend growth therefore could be of significant value to investors.
This post presents a case study of US large and mid-cap equities and their subsequent three-year dividend growth, distinguishing among them based on their ESG ratings at the start of the study period, December 2018. The analysis is based on a starting equity universe drawn from the 2018 composition of the Solactive GBS United States Large and Mid Cap Index.
The two key metrics in the analysis are the ISS ESG Corporate Rating as of December 2018, as well as annual dividends paid in the calendar years 2018 and 2021, drawn from Bloomberg. The ISS ESG Corporate Rating is ISS ESG’s comprehensive ESG Score, incorporating Environmental, Social, and Governance pillars. The 2018 and 2021 dividends are used to calculate a three-year dividend growth rate.
The analysis’ equity universe contained 562 constituents at inception in 2018. To address the motivating question—“Are high ESG ratings associated with higher subsequent dividend growth?”—the case study uses overall ESG ratings in December 2018 and examines the three-year dividend growth rate. Constituents that did not pay any dividends at all during the three-year period were not included: the analysis focused on dividend payers.
With this filter applied, the final dataset contains 401 securities. Note that some companies were significantly affected by COVID-19 during this period and cut or eliminated dividends. Companies that paid dividends in 2018 but later eliminated dividends, resulting in -100% dividend growth, are included.
To illustrate the dataset, Figure 1 shows the distributions of the numeric ESG ratings (possible range 1-4) as well as the starting dividend yield of the universe. The data is grouped into the bottom, middle, and top third of ESG scores and is color coded and labeled “low,” “medium,” and “high” ESG.
Figure 1: Distributions of ESG Ratings and Dividend Yield
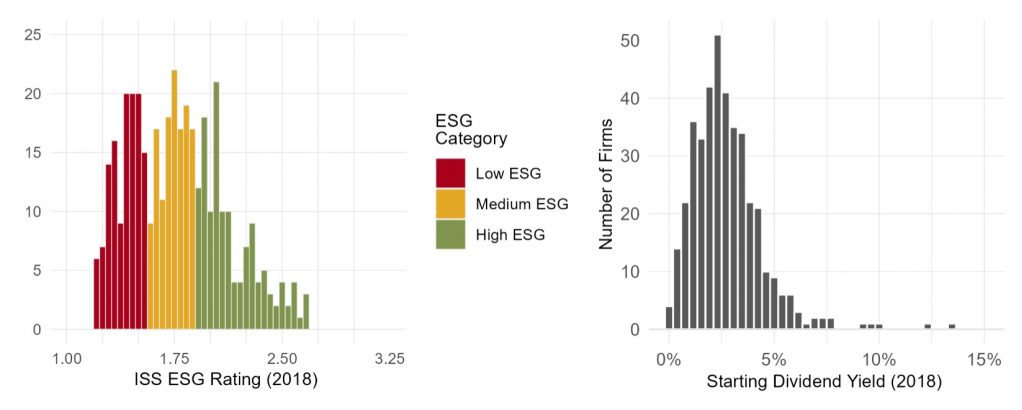
Source: ISS ESG
How do these variables interact? Figure 2 shows the scatter plot of dividend growth and ESG ratings. While a strong relationship between dividend growth and ESG ratings is not evident, a trend does seem to appear between the variance in dividend growth and ESG ratings.
Figure 2: ESG Ratings and Dividend Growth
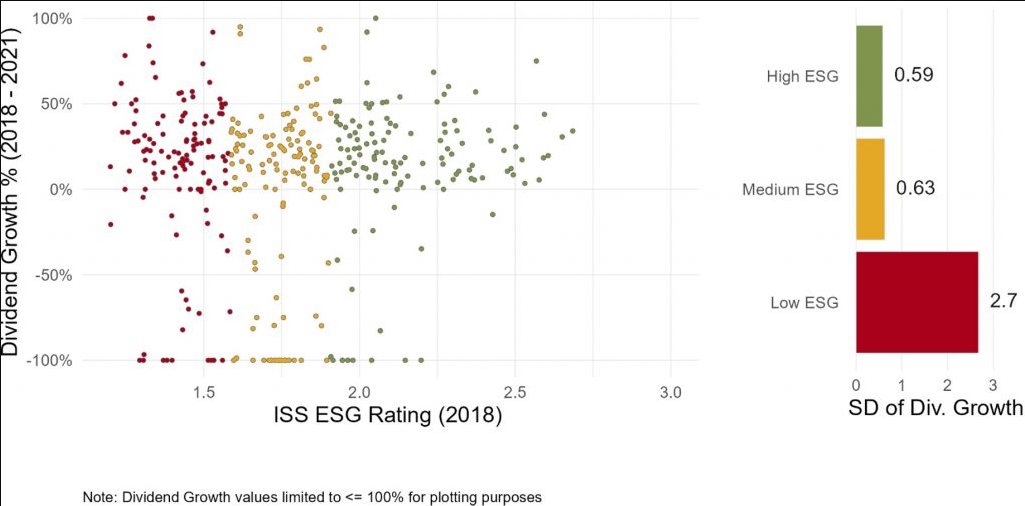
Source: ISS ESG
Higher ESG scores correspond to lower volatility in dividend growth. The dividend-stability relationship is more clearly illustrated in the bar chart on the right, which shows that the standard deviation of dividend growth among “high ESG” companies is approximately one-fifth of the standard deviation among “low ESG” companies.
Figure 3 underlines this point by showing that companies that reduce or eliminate their dividends are significantly more common within the overall universe than within the best-in-class ISS ESG Prime Rated Universe. The Prime Rated Universe is composed mainly of the ‘high ESG’ subset of the overall universe. For instance, while about 20% of the overall universe cut their dividends and about 9% eliminated them, within the Prime universe only 5% of companies reduced dividends and no companies eliminated them. Across the overall universe, “high ESG” companies were less prone to cut their dividends than ‘low/medium ESG’ companies.
Figure 3: Share of Companies Reducing or Eliminating Dividends, by ESG Group (2018-2021)
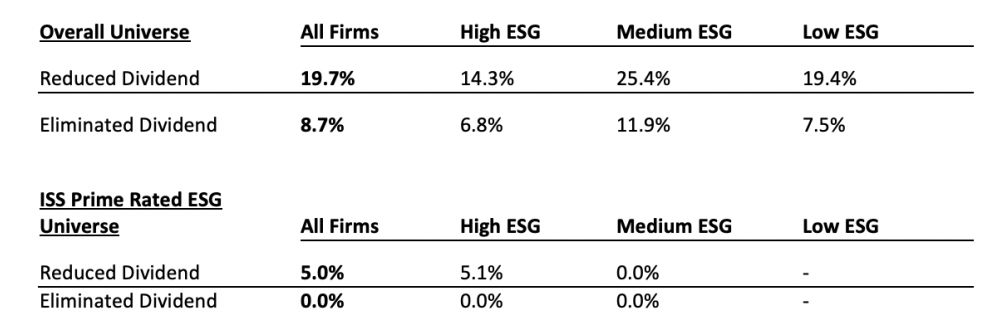
Source: ISS ESG
The potential for lower-rated companies to be more likely to reduce or eliminate their dividends suggests that a clustering approach might be suited to understanding this relationship. Clustering is a statistical technique used to group observations into “similar” sets of peers, based on the input variables.
Using the common ‘k-means’ approach to identify the main groupings by ESG rating and dividend growth in the analysis universe yielded three main clusters. Figure 4 plots the three clusters in the left panel and shows how the distribution of dividend growth and ESG rating vary by cluster in the right panel. The results are intriguing and present investors with actionable insight.
Figure 4: Cluster Analysis
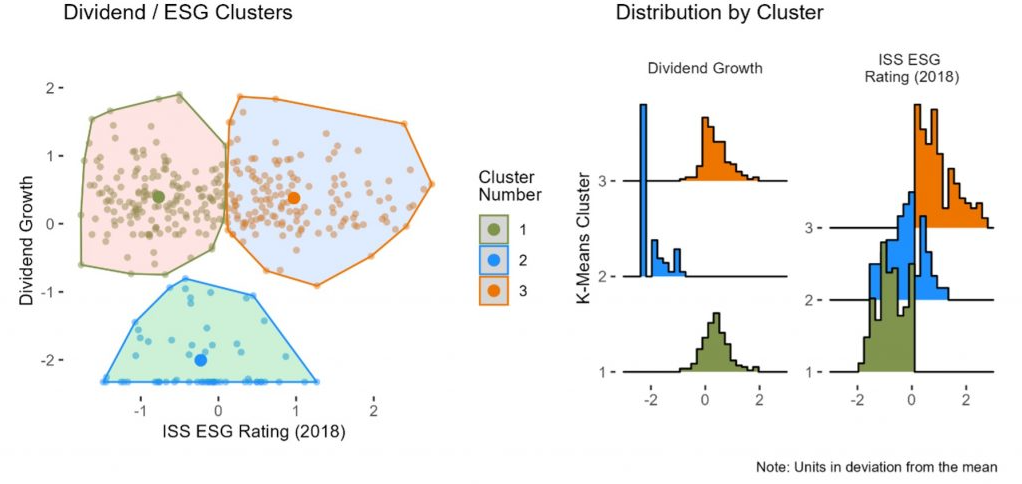
Source: ISS ESG
- Cluster 1 is a mixed bag of companies with below average ESG rating, but with dividend growth which can be either positive or negative. These companies are somewhat indeterminate for investors.
- Cluster 2 contains companies with generally below average ESG rating and low dividend growth. These companies are potentially less attractive for investors.
- Cluster 3 features companies with both high ESG ratings and generally high dividend growth. These companies are potentially highly attractive for investors.
The broad implication of this analysis is that while companies with lower ESG ratings may or may not achieve good dividend growth, companies with higher ESG ratings seem much more capable of doing so. Dividend-growth-focused investors may potentially achieve their goal by selecting companies with low ESG ratings, but may also further tilt the odds in their favor by focusing on companies with relatively higher ESG performance. Investors interested in integrating the ISS ESG rating into their portfolios may consider best-in-class ESG indices such as the Solactive ISS Prime-Rated ESG Series.
Conclusion
To summarize, the analysis found that companies with higher initial ESG ratings experience greater subsequent stability of dividends and a lower likelihood of cutting or eliminating their dividends. Low ESG ratings do not necessarily mean poor dividend growth, but companies with high ESG ratings appear to consistently deliver higher dividend growth. Finally, equity ESG indices integrating the ISS ESG Corporate Rating may potentially offer better dividend growth over time.