 Print
PrintAubrey Bout is a Managing Partner and Perla Cuevas and Brian Wilby are Consultants at Pay Governance LLC. This post is based on a Pay Governance memorandum by Ms. Bout, Ms. Cuevas, Mr. Wilby and Jose Lawani. Related research from the Program on Corporate Governance includes Paying for long-term performance (discussed on the Forum here) by Lucian Bebchuk and Jesse Fried; and The Growth of Executive Pay by Lucian Bebchuk and Yaniv Grinstein.
Executive Summary
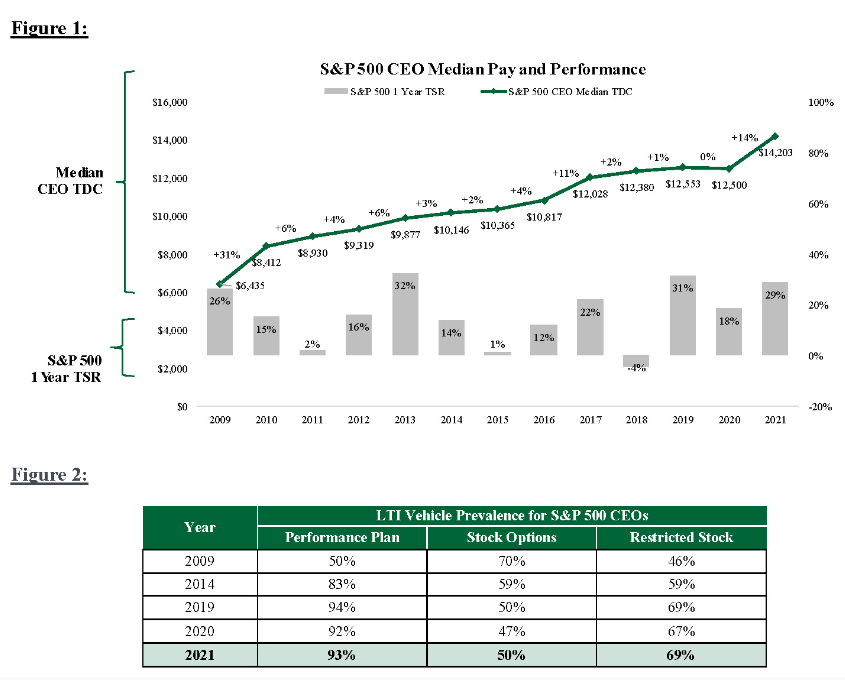
- In 2021, CEO median actual total direct compensation (TDC*) among S&P 500 companies increased +14% driven by higher actual bonuses. Similarly in 2021, the S&P 500 total shareholder return (TSR) increased +29%.
- Historical CEO pay increases have been supported by TSR; on average, annualized pay increases have been ≈12% lower than TSR performance on a percentage basis.
- In 2022, CEO actual TDC will potentially increase in the low- to mid-single digits due to strong 2022 S&P 500 revenue and operating income performance (+10% and +13% at the median, respectively), counterbalanced with poor TSR performance (-18%).
- In 2023, due to the current uncertain environment, potential recession, contractionary monetary policies, inflation and weak TSR performance in the 2022 calendar year (-18%), we expect CEO pay to increase in the low-single digits in aggregate (higher performing companies could provide larger increases).
- Performance share plans remain the most used long-term incentive (LTI) vehicle; however, we expect a potential increase in the use of time-based awards and stock options due to recent volatility and the difficulty of setting multi-year goals in an increasingly uncertain economic environment.
*TDC = sum of base salary, actual annual incentive/bonus paid and the grant date fair value of long-term incentive awards.
Introduction
CEO pay continues to be discussed extensively in the media, in the boardroom, and among investors and proxy advisors. CEO median actual TDC increased significantly in 2021, in line with a substantial increase in TSR. In our study, median actual TDC CEO pay in 2021 increased +14% driven by higher actual bonuses. TSR increased +29% over the 2021 calendar year, which followed an increase of +18% in 2020 and +31% in 2019. Historically, CEO pay increased at a modest rate: in the +2% to +6% range for 2011-2016. CEO pay accelerated with an +11% increase in 2017 — likely reflecting sustained robust financial and TSR performance — before returning to +3% in 2018 and +1% in 2019, more in line with historical rates. Despite strong TSR in 2020, CEO pay remained flat due to the negative impact of the COVID-19 pandemic, particularly resulting in lower bonuses. 2021 reached a record high in actual TDC and strong TSR performance.
Our CEO pay analysis is focused on historical, actual TDC, which reflects actual bonuses based on actual performance; this is different from target TDC or target pay opportunity, which reflects target bonus and is typically set at the beginning of the year.
2022 was an unprecedented time given the volatile environment (COVID, inflation, Ukraine war, and the “Great Resignation”). Inflation rates were up ≈9% in 2022. In addition, there have been many major layoffs and hiring freezes in certain industries (e.g., technology and healthcare industries). However, with market volatility and retention having presented major challenges for companies during the year, we expect 2022 CEO pay data to increase in the low- to mid-single digits due to larger LTI awards provided, in part for retention, early in 2022, partially offset by lower bonuses to paid in early 2023.
As the economic environment remains volatile amid heightened inflation, contractionary monetary policies, weak 2022 S&P 500 TSR performance of -18%, at the median and potential recession in 2023, we expect that 2023 pay will increase in the low-single digits. There is some likelihood that time-based awards and stock options will become more prevalent, as it is difficult to set multi-year goals and companies continue to address volatility concerns.
Historical Trends in CEO Pay and LTI Vehicles
CEO pay rebounded +31% in 2010 after -9% and -13% decreases during the financial crisis of 2008 and 2009, respectively. In 2021, we observed the largest CEO pay increase since 2010, which was supported by strong three-year TSR (+29% in 2021, +18% in 2020 and +31% in 2019). (Figure 1).
In 2021, performance shares continued to be the most prevalent LTI vehicle; however, there was a slight uptick in the prevalence of stock options and time-based awards (Figure 2). Increased use of time-based awards could be due to continued challenges in setting long-term performance stock unit (PSU) goals given the volatile and uncertain environment. In 2022 and 2023, we expect to see a similar trend of performance share dominance and a potential continued uptick in time-based and stock option awards as companies navigate the challenge of setting long-term goals in an uncertain environment. The rise in performance-based plans throughout the years can largely be attributed to the introduction of Say on Pay and the preferences of proxy advisors and some shareholders toward LTI systems that they consider to be “performance-based” (note: the proxy advisors generally do not consider stock options to be performance-based). The prevalence of performance-based awards declined slightly in 2020, likely from difficulty in setting multi-year goals during the pandemic.
Trends in CEO Pay versus S&P 500 Index Performance
In recent years, CEO pay increases have been supported by strong TSR. In fact, pay increases over the last 10 years have trailed TSR performance by ≈12% when examining the compound annual growth rates (CAGR) of compensation and shareholder return: the TSR CAGR was 17% while CEO pay grew at 5%. TSR performance is notable for 2019 through 2021 (+31%, +18%, and +29%, respectively) which supports the significant increase in CEO pay.
There is a positive correlation between share price performance and CEO pay. In a positive stock price environment, Compensation Committees are often more supportive of CEO pay increases, typically delivered via larger LTI grants, while CEO base salaries increase modestly or periodically (i.e., less frequently than on an annual basis) and comprise a small portion of the executive pay package. Annual actual bonuses, though not as significant as the LTI portion of total compensation, can have a meaningful impact on whether compensation grows year over year. When a company is having a good year and is exceeding budget goals as well as investor and analyst expectations, the CEO bonus often pays above target and increases year over year (often, the share price also increases as company performance is strong). That said, there will be some years where a CEO’s bonus pays above target when the company exceeded its budgeted goals while the share price declines due to stock market volatility or correction and sector rotation. The opposite can also happen: goals are not met, resulting in lower bonuses while the stock market goes up.
CEO Pay Projections
1) We expect 2022 overall CEO actual TDC to increase in the low- to mid-single digits as the economic environment remains volatile amid heightened inflation and contractionary economic policies.
a) The Aggregate S&P 500 Index year-over-year revenue and operating income for 2022 are currently forecasted to increase by ≈10% and ≈13%, respectively, largely driven by the energy sector (S&P Capital IQ); notable that 4th quarter 2022 year-over-year earnings are expected to be down.
2) As the economic environment remains volatile amid heightened inflation, contractionary monetary policies, weak 2022 TSR performance, and potential recession in 2023 (J.P. Morgan forecasts a 9% decline in 2023 S&P 500 earnings), we expect that 2023 pay will increase in the low-single digits in aggregate.
a) There is some likelihood that time-based awards and stock options may be used more as it is difficult to set multi-year goals and companies will continue to face volatility concerns (performance plans will continue to be the most prevalent).
Methodology
The CEO pay analysis consists of S&P 500 companies led by CEOs with a ≥3-year tenure. Pay data includes base salaries and bonuses paid for each year as well as the reported grant date fair value of LTI awards. Our analysis of consistent incumbent CEOs was designed to highlight true changes in CEO compensation (as opposed to changes driven by new hires or internal promotions, which typically involve ramped-up pay over a period of 1-3 years).
Note on Realizable Pay
Our methodology used year-over-year CEO actual pay and was based on the accounting value of LTI as reported in proxy summary compensation tables. These amounts are more akin to pay opportunity than realizable pay, which includes in-the-money value of stock options, ending period value of restricted stock, and estimated value of performance shares. Our past research has strongly correlated realizable pay and TSR performance. While we have shown there is a positive correlation between CEO annual pay increases and TSR performance, we are confident the correlation is not as significant as that between realizable pay and TSR increases.