 Print
PrintDavid Kostin is Chief US Equity Strategist and Jenny Ma is a US Equity Strategist at Goldman Sachs. This post is based on their Goldman Sachs memorandum. Related research from the Program on Corporate Governance includes The Long-Term Effects of Hedge Fund Activism (discussed on the Forum here) by Lucian Bebchuk, Alon Brav, and Wei Jiang; Dancing with Activists (discussed on the Forum here) by Lucian A. Bebchuk, Alon Brav, Wei Jiang, and Thomas Keusch; and Who Bleeds When the Wolves Bite? A Flesh-and-Blood Perspective on Hedge Fund Activism and Our Strange Corporate Governance System by Leo E. Strine Jr.
- Shareholder activism surged during 2022 but the pace moderated in 1Q 2023. Activists launched 148 campaigns against 120 distinct US corporations during 2022, a roughly 20% year/year jump, ranking among the top 5 most active years since 2006. During 1Q 2023, investors launched 27 campaigns against 26 companies, a 24% decline from 4Q 2022.
- A changing regulatory landscape and an uncertain macro environment should support shareholder activism in 2023. The Universal proxy took effect last fall and will embolden activists during the upcoming proxy season. The valuation decline and increased cost of capital means activist investors will focus on profitability and idiosyncratic opportunities of potential targets.
- Our analysis covers 2,142 shareholder activism campaigns launched since 2006 with a corporate valuation demand against Russell 3000 companies.
- For INVESTORS: The median stock targeted by activist investors outperformed its sector by 3pp in the week after the launch of a campaign. However, excess returns were short-lived and typically turned negative after six months. While 69% of targeted stocks outperformed during the first week, after one year only 42% of stocks outperformed their respective sectors and the median stock lagged by 5 pp. A wide performance distribution exists for both successful and unsuccessful activist campaigns and varies by type of activist demand. While the median activist target lagged its sector, the average activist target outperformed by 4 pp over 12months. The asymmetric nature of returns suggests that “piggyback” portfolio managers with a consistent approach to investing in activist targets can generate positive returns over time.
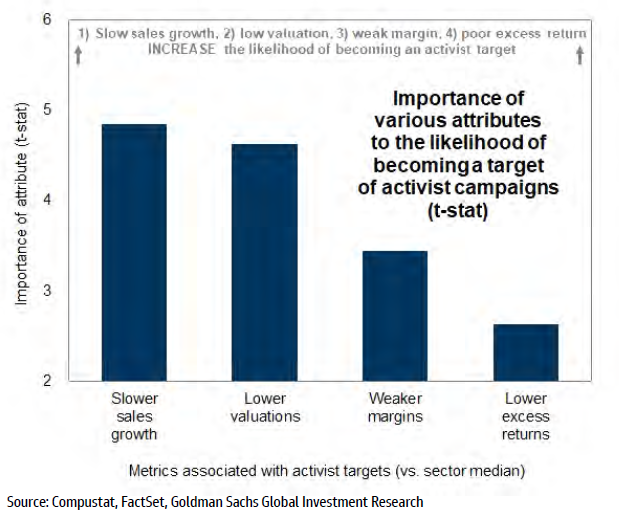
- For MANAGEMENTS: We identify four metrics relative to the sector median that are associated with an increased likelihood of becoming an activist target: (1) Slower trailing sales growth, (2)lower trailing EV/sales multiple, (3) weaker trailing net margin, and (4) trailing 2-yearunderperformance. Note that low realized sales growth relative to the sector median is the metric most associated with a target company’s share price outperformance following the launch of an activist campaign. Exhibit 19 lists 116 stocks that have experienced at least 10 pp slower realized sales growth relative to its sector median over the past 12 months and at least one source of vulnerability.
Portfolio manager summary in four pictures
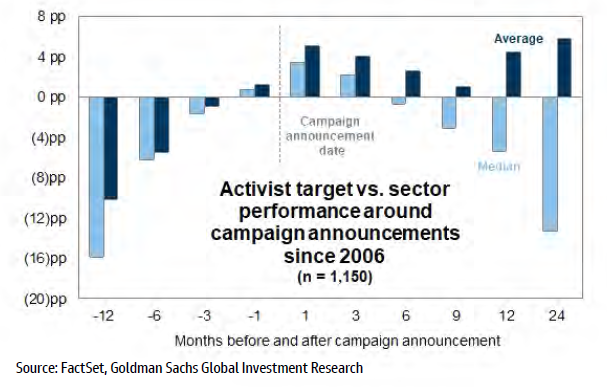
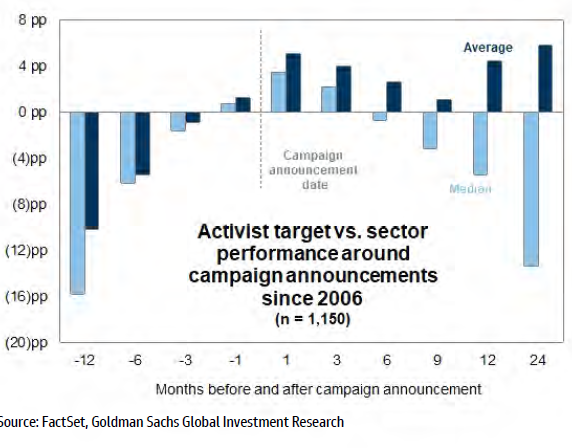
1.The median target outperformed its sector during the weeks following a campaign but under performed over 1- and 2-years. Average excess returns remain positive.
Exhibit 1: Performance of companies targeted by activist investors
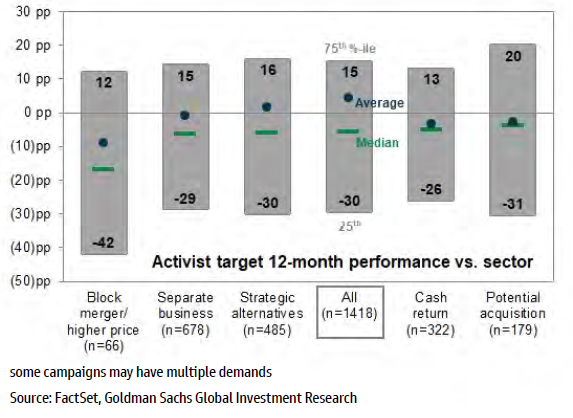
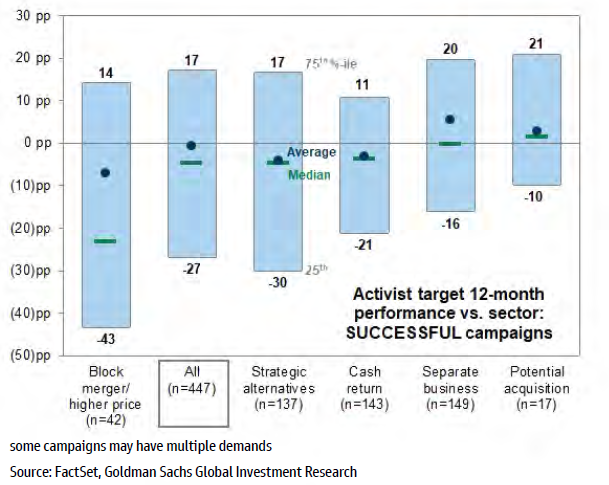
2.The distribution of outcomes is wide and varies by type of activist demand.
Exhibit 2: Distribution of 12-month excess returns vs. sector by activist investor demand
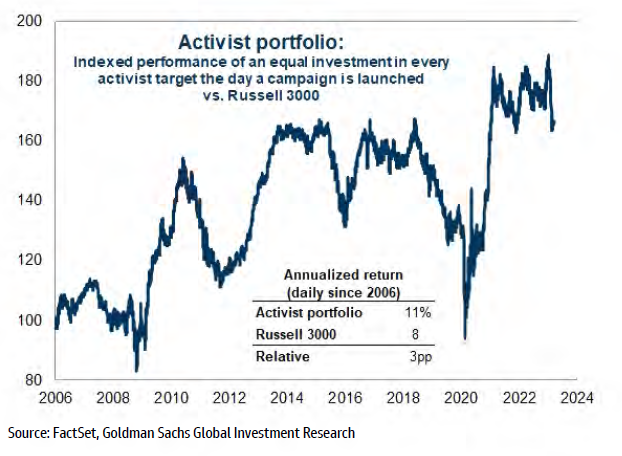
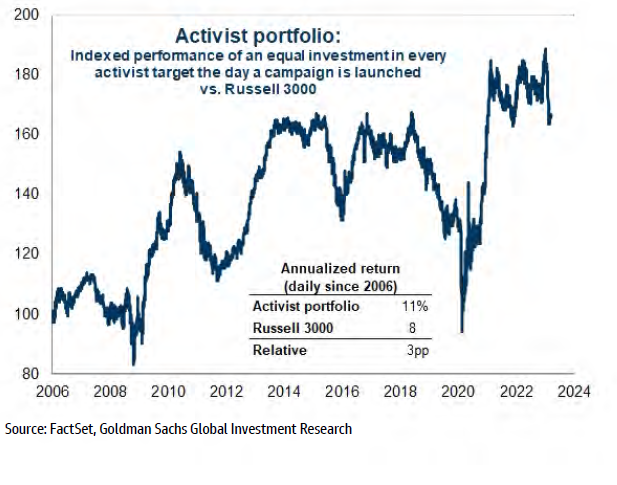
3.An equal-weighted portfolio of all activist targets since 2006 has generated a 3 pp average annual excess return relative to the Russell 3000.
Exhibit 3: An equal-weight portfolio of activist targets has outperformed the Russell 3000
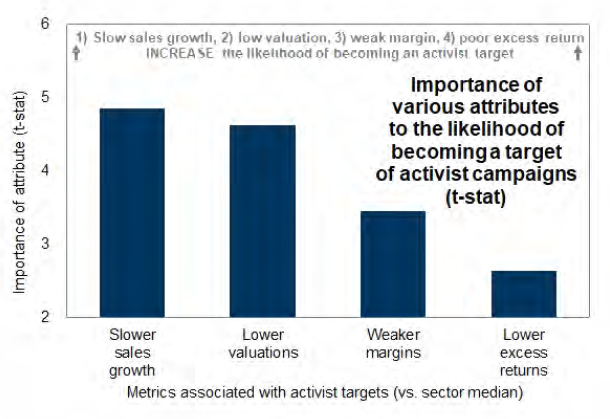
4. Financial variables relative to sector median associated with an increased likelihood of becoming a target of an activist campaign: (1) slower trailing sales growth, (2) lower trailing EV/sales multiple, (3) weaker trailing net margin, and (4) trailing 2-year underperformance.
Exhibit 4: Importance of characteristics associated with companies targeted by activist investors
see Appendix C for notes on methodology
Shareholder activism trends
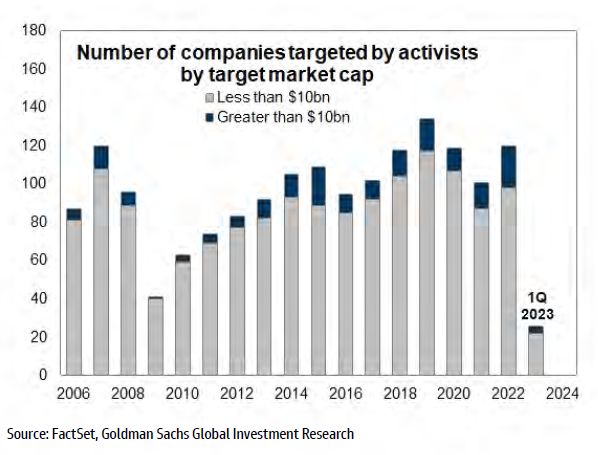
2022 ranked as one of the most active years for shareholder activism: Investors launched 148 campaigns against 120 distinct public US companies during 2022, a roughly 20% year/year increase. Activists in 2022 also increased their focus on large-cap fi rms. The number of targetswith a market cap greater than $10 billion jumped by 50% year/year to the highest on record(22). The largest targets in 2022 included GOOGL ($1.2 trillion equity cap targeted on Nov. 15 by TCI Fund Management (15th November 2022.pdf (tcifund.com)),6% return since announcement vs. 4% for Russell 3000), META ($346 billion, Oct. 24, Altimeter (Time to Get Fit — an Open Letter from Altimeter to Mark Zuckerberg (and the Meta Board of Directors) | by Brad Gerstner @altcap | Medium), 68% vs. 10%), and DIS ($222 billion, Aug.15, Third Point (third-point-letter-to-disney-august-15-2022-tpou.pdf (storyblok.com)), -19% vs. -3%). See Appendix A for a list of 179 activist campaigns launched since the start of 2022.
Our analysis of corporate activism activity against Russell 3000 stocks is based on FactSet Sharkwatch data and focused on 2,142 campaigns with a value creation demand launched between 2006 and 1Q 2023. Our objective was to better understand what changes activist investors seek in the stocks they target, the financial metrics that indicate a company is vulnerable, and the share price performance of stocks subject to an activist campaign. See Appendix C for notes on our methodology.
Exhibit 5: Number of companies targeted by activist investors by market cap
see Appendix C for notes on methodology
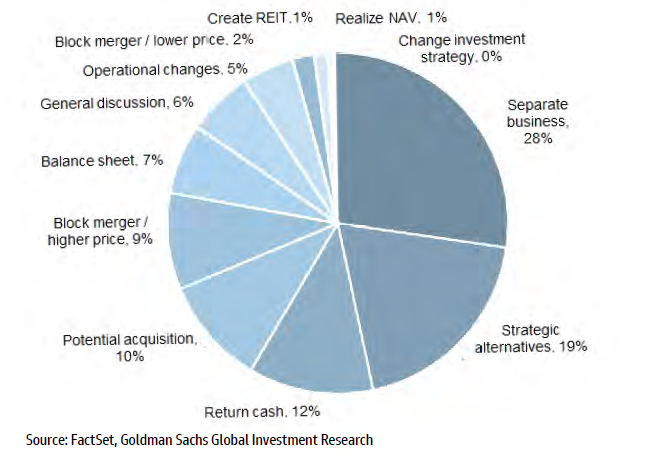
The most frequent activist investor demand involved in 28% of campaigns since 2006 has been for companies to separate its business. Other common demands include (1) review strategic alternatives (19%), (2) return cash to shareholders (12%), (3) block a proposed merger or acquisition (12%), (4) become a target of a potential acquisition (10%), and (5) increase or decrease leverage (7%). Specific demands such as realize NAV, create a REIT, or change investment strategy are less common, along with operational changes and a general discussion of strategy (Exhibit 6).
Exhibit 6: Value creation demands from activist investors
2,142 campaigns since 2006
The sector composition of activist campaigns differs from the sector composition of the S&P500 (Exhibit 7). Over the past five years, activists targeted Consumer Discretionary (19% of activist campaigns vs. 11% of the S&P 500 index weight), Energy (10% vs. 4%), and Real Estate(7% vs. 3%) more than their index weights. In contrast, Info Tech represented a smaller share of activist campaigns (15% vs. 26% index weight).
Activist investors during 2022 launched 30 campaigns (21% of total) against Consumer Discretionary firms and 28 campaigns (19%) against Info Tech firms. Hasbro ($13 billion equity cap) was the largest Consumer Discretionary company targeted in 2022. Alta Fox Capital Management launched a proxy fight (Alta Fox Capital (sec.gov)that urged management to enact operational changes such as establishing a disciplined capital allocation framework, and encouraged the company to divest its Wizards of the Coast division. Sales force ($147 billion) was the largest Info Tech company targeted last year. Starboard Value seeks (PowerPoint Presentation (starboardvalue.com)) operational changes to improve the company’s mix of revenue growth and profitability. Given the sharp share price declines since the S&P 500 peaked on January 3, 2022, firms in perceived growth sectors such as Communication Services (-28% return), Consumer Discretionary (-29%), and Info Tech (-14%) will likely face continued shareholder pressure, especially those with low profitability.
Exhibit 7: Sector composition of activist targets (share of campaigns)
campaigns since 2006

Shareholder activism in 2023
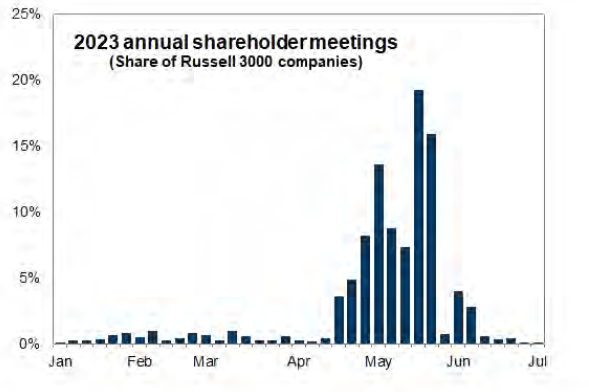
The bulk of 2023 proxy season is soon approaching. 8% of Russell 3000 companies will hold their annual shareholder meetings in the last week of April and 65% of Russell 3000 companies will hold their annual meetings during the month of May.
Exhibit 8: Annual shareholder meeting date among Russell 3000 companies
We expect shareholder activism to remain popular during 2023 as investors adapt to regulatory changes and managements navigate a macro backdrop characterized by heightened recession risk and flat equity market returns. Activists launched 27 campaigns against 26 companies during 1Q 2023. Notable targets this year include Disney (Trian Partners (https://www.sec.gov/Archives/edgar/data/1744489/000090266423000180/p23-
0048prec14a.htm)) and Salesforce, in which five separate activist investors have accumulated positions (Elliott Investment Management (Elliott Statement on Salesforce (prnewswire.com)), Inclusive Capital (Activist investor Inclusive Capital takes stake in Salesforce – CNBC | Reuters), Starboard Value (PowerPoint Presentation (starboardvalue.com)), Third Point (Third Point Has a Stake in Salesforce – WSJ), and ValueAct Capital Partners (Salesforce appoints new board directors amid activist investor pressure | Reuters)).
One interesting development in 2023 has been the speed of capitulation by management teams. In several high profile attacks, companies have announced their intention to implement several of the actions proposed or advocated by activists, thereby nullifying the need for those investors to continue to agitate for change. In the fi rst quarter, Trian Partners
withdrew (Trian-Applauds-Recent-Initiatives-Announced-by-Disney-as-a-Win-for-All-Shareholders-and-Concludes-Proxy-Campaign.pdf (trianpartners.com)) its Disney board nominations following the company’s announcement of new operating initiatives. Elliott Management also launched and ended (Salesforce – Salesforce and Elliott Issue Joint Statement) its campaign against Salesforce after the board elected a director from ValueAct.
Two new developments from the SEC – universal proxy (SEC.gov | Universal Proxy) and amendments to Rule 14a-8 (SEC.gov | SEC Proposes Amendments to Shareholder Proposal Rule) – should support shareholder activism this year by easing barriers for launching a campaign and marginally increasing activists’ willingness to threaten and pursue proxy contests to meet their demands. First, starting last fall shareholders voting by proxy have been allowed to choose among a combination of management and dissident director candidates with a universal proxy card. This change reduces the cost of launching a proxy campaign and increases the probability of at least one dissident nominee getting elected to the board of directors. Previously, shareholders voting by proxy could vote from either the company’s slate or the activist’s slate of nominees, but not a combination of the two. Second, the SEC is also expected later this year to finalize amendments to the shareholder proposal rule (Rule 14a-8) later this year, which would make it more difficult for companies to exclude shareholder proposals in proxy statements.
Our forecast for flat S&P 500 returns this year underscores the importance of alpha over beta and highlights the need for successful stock picking compared with last year when equity returns were more macro-driven than usual. The S&P 500 P/E multiple ranks at the 86 percentile vs. history (18x), the cost of capital has increased substantially, and economic growth has decelerated in 2023, so investors will focus on near-term corporate profitability. For example, activists might urge companies to consider spinoff s to improve margins and boost valuations
(see Revisiting our recommended playbook for investing in spinoffs
(https://publishing.gs.com/content/research/en/reports/2023/02/15/dc57d3a0-3e4d-4903-
a5ba-a4aa9a318d7f.html)).
Performance of stocks targeted by activist investors
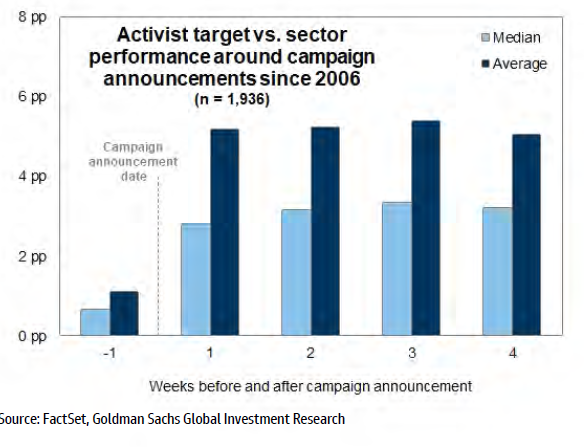
The typical company targeted by an activist investor has outperformed its sector during the weeks immediately following a campaign announcement (Exhibit 9). Since 2006, 69% of targeted stocks outperformed their sector during the first week after a campaign was launched. Targets outperformed their sector by a median of 3 pp and an average of 5 pp.
Positive excess returns can also be observed before a campaign is launched. Activist targets outpaced their sector by 1 pp with a 58% hit rate during the week before a campaign announcement. Gains during this period may reflect activists building their stakes and perhaps the market reacting to rumors. Investors are required to complete a Schedule 13D fi ling and disclose their positions within 10 days of accumulating more than 5% of a company’s voting class.
Exhibit 9: Short-term performance of companies targeted by activist investors
Despite the recent popularity of shareholder activism and the initial positive share price reaction to the news of a campaign, the median targeted company actually under perform edits sector over the longer term (Exhibit 10). Excess returns appear short-lived and typically turned negative after six months. After 1 year, only 42% of stocks had outperformed its sector and the median stock underperformed by 5 pp. At the 2-year mark, only 40% of targets outperformed and the typical stock lagged by 13 pp. The magnitude of returns were similar across successful and unsuccessful campaigns. However, although median excess returns are negative, average long-term excess returns are positive.
Exhibit 10: Performance of companies targeted by activist investors
There are several possible explanations for this divergence between short-term and long-term performance. Academic research reveals a lack of consensus on the long-term impact of shareholder activism. First, the holding period for activist investors varies and an investor can generate positive returns even though the median stock underperforms its sector. Second, the market might price an overly optimistic outlook at the time of announcement, which normalizes over time. A literature review by Rafaqat et al. (2022) (Shareholder Activism and Firm Performance: A Review | Journal of Economics and Behavioral Studies (amhinternational.com))
analyzed more than 100studies and concluded that shareholder activism may have a positive, negative, or insignificant effect on a targeted firm’s fundamental and price performance.
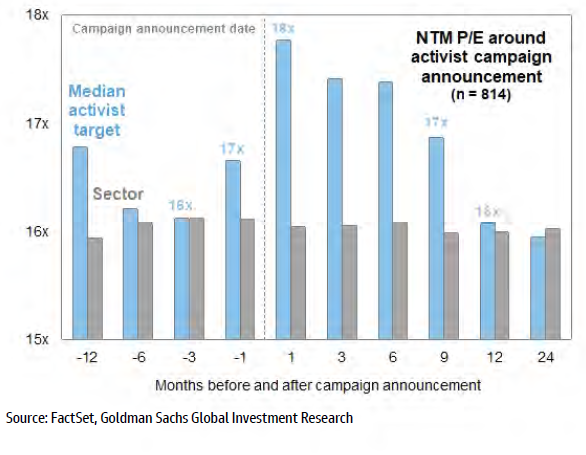
The initial boost to the median target’s forward P/E valuation after an activist launched a campaign tends to fade over time (Exhibit 11). The median company targeted by an activist investor traded at a 16x forward P/E three months before the announcement of an activist campaign and at an 18x forward P/E one month after a campaign was launched, reflecting a 10%multiple expansion. However, after one and two years, the P/E multiple of the median target actually reverted to 16x. In contrast, the median sector traded at a stable 16x P/E during this entire period.
Exhibit 11: Forward P/E: Median activist target vs. sector
campaigns since 2006
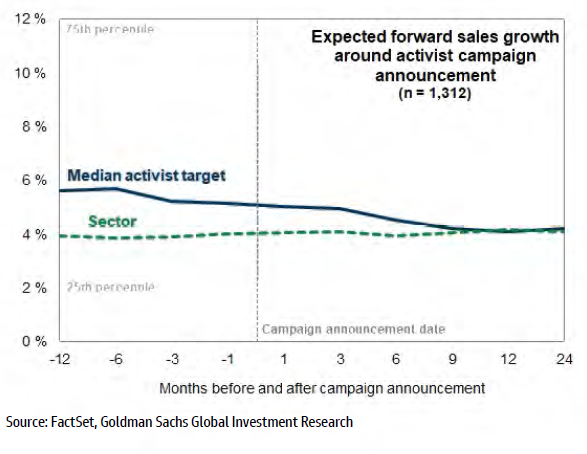
Fundamentally, there is no material improvement in expected forward sales growth after the involvement of an activist investor (Exhibit 12). One month before an activist campaign is launched, expected sales growth for the median company targeted by an activist investor equaled 5% (vs. 4% for the sector). One and two years after the announcement of an activist campaign, expected sales growth for the median target fell to 4%, matching the sector’s expected growth rate. The lack of sustained boosts to a company’s valuation or fundamentals helps explain the lack of long-term positive excess returns.
Exhibit 12: Expected forward sales growth: Median activist target vs. sector
campaigns since 2006
Opportunities for outperformance
(1)Activist Portfolio
Although the median activist target underperformed its sector after 12 months, the average activist target outperformed by 4 pp. This discrepancy between the average and median activist target can be explained by the asymmetric nature of returns, in which a few instances of extreme positive outperformance can off set the median target’s underperformance. Therefore, portfolio managers with a consistent approach to investing in activist targets can generate positive returns over time.
To illustrate this, an equal weight portfolio of companies targeted by activist investors has outpaced the Russell 3000 by an annual average of 3 pp since 2006. To create our activist portfolio, we tracked the daily performance of the average activist target in an equal-weight portfolio. The strategy involved investing in the target company the day a campaign is announced and holding the position for a maximum of 12 months.
Aggregate activist returns have closely tracked the performance of our Value factor. Intuitively, activist investing resembles value investing because activists often seek to influence or catalyze change to address sources of a company’s chronic underperformance and generate shareholder value.
Exhibit 13: An equal-weight portfolio of activist targets has outperformed the Russell 3000
(2) Wide distribution of outcomes
The distribution of target vs. sector 12-month returns is wide and varies by both the demand type and the outcome, offering stock-pickers a large opportunity set. The median target of a successful acquisition campaign, in which the target was acquired by the activist investor, tended to outperform the median targets of other campaigns since these companies often benefit from an offer price premium. Typical excess returns equaled 2 pp and returns at the 75ᵗʰ percentile equaled 21 pp, the greatest amount generated among the various demands (Exhibit 14). Returns at the 25ᵗʰ percentile equaled -10 pp. This was the only category of activist campaigns in which the median target outperformed in both the short- and long-term. For example, TIF received and accepted LVMH’s unsolicited, non-binding proposal (Press release – LVMH) to acquire the company. TIF outperformed its sector by 7 pp 12 months after the proposal announcement in October 2019.
Exhibit 14: Performance distribution of successful activist campaigns
campaigns since 2006
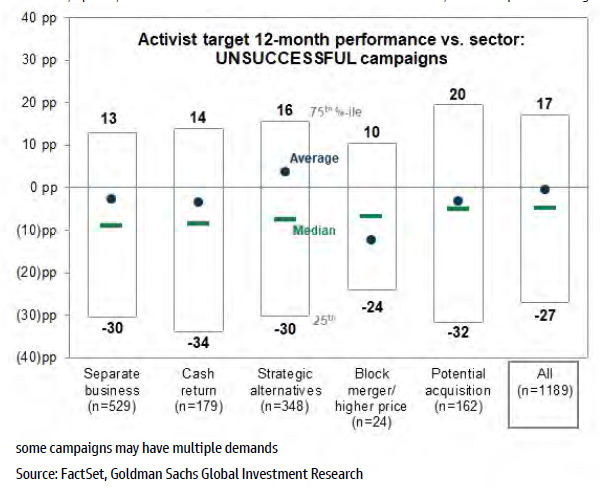
In contrast, the median target of an unsuccessful campaign to separate the business tended to suffer poor returns (Exhibit 15). These companies were likely targeted due to investor concerns about lagging share prices, high costs, and/or low margins. For example, Starboard Value called (ex1todfan14a06297246_010719.pdf (sec.gov)for Dollar Tree (DLTR) to sell its underperforming Family Dollar business in 2019 but eventually dropped its challenge. DLTR lagged the broader Consumer Discretionary sector by 27 pp 12months after the launch of the campaign.
Exhibit 15: Performance distribution of unsuccessful activist campaigns
campaigns since 2006
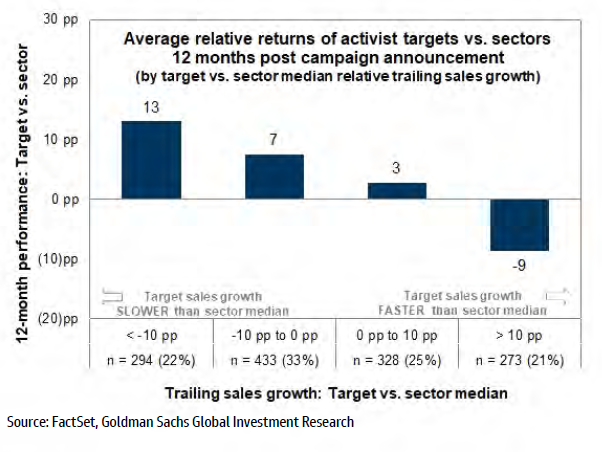
(3)Favorable target attribute
Slower realized sales growth relative to the sector median is associated with target companies outperforming at the 1-year mark The market consistently undervalues lower expectations, so laggards have a greater opportunity for outperformance. The 12-monthoutperformance hit rate for stocks with slower realized sales growth relative to the sector median equaled 45% while the hit rate for stocks with faster realized sales growth relative to the sector median equaled 39%. On average, stocks with realized sales growth at least 10 pp slower than the sector median outperformed their sectors by 13 pp. In contrast, stocks with realized sales growth more than 10 pp faster than the sector median underperformed by 9 pp. This relationship between slow sales growth and outperformance was even evident during the extended Growthstock rally from 2016 to 2020.
Exhibit 16: Targets with slower sales growth relative to sector median tend to outperform after 12 months
campaigns since 2006
A guide for managements: Identifying sources of vulnerability
We utilized a probit model to analyze the performance and fundamental characteristics most associated with companies targeted by activist investors. Our universe consisted of Russell3000 companies since 2006. See Appendix C for more details on our analysis.
We identified four financial variables relative to the sector median that are associated with an increased likelihood of becoming a target of an activist campaign: (1) slower trailing sales growth, (2) lower trailing EV/sales multiple, (3) weaker trailing net margin, and (4) trailing 2-year underperformance.
Exhibit 17: Sources of vulnerability for a potential target
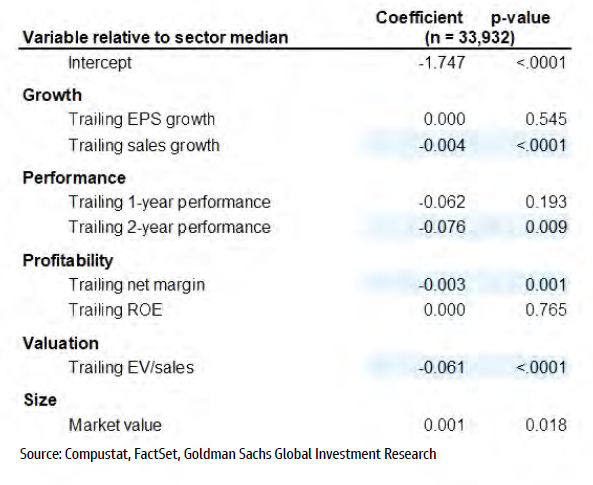
For company managements, these four attributes represent potential sources of vulnerability that might prompt an activist attack. According to our probit model, sales growth has been the most important variable in determining an activist target, followed by EV/sales valuation.
Exhibit 18: Importance of characteristics associated with activist targets
Of the 733 campaigns since 2006 with sufficient data for all four metrics, 89% had at least one identified source of vulnerability and 70% had at least two.
- 67% of targets underperformed their sectors during the 2 years prior to the campaign.
- 57% traded at an EV/sales discount.
- 55% had slower sales growth.
- 47% had weaker net margins.
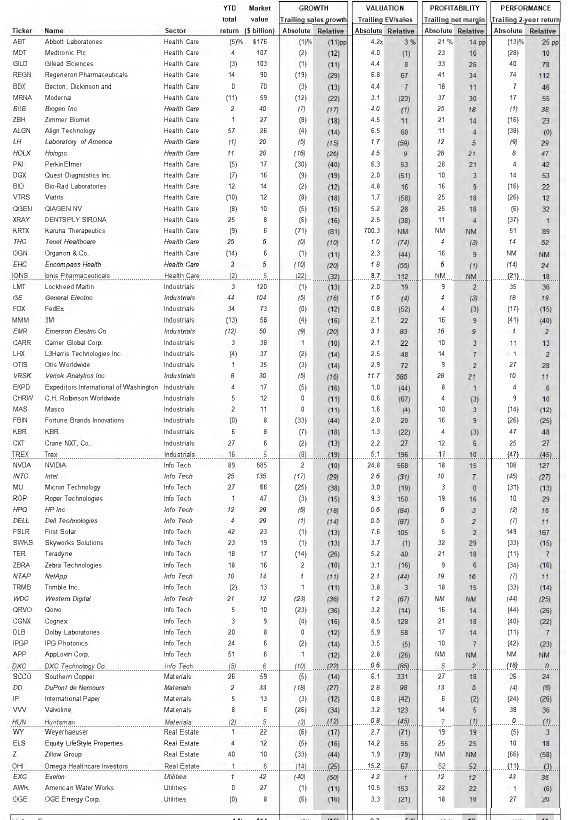
Exhibit 19 identifies 116 stocks in the Russell 3000 index that may be susceptible to a campaign by an activist investor. These firms have a market cap greater than $5 billion, at least one source of vulnerability based on our model, and experienced at least 10 pp lower realized sales growth relative to its sector median during the trailing 12 months. The median firm grew sales by -5% (vs. +10% for the Russell 3000 median), trades at 2.7x EV/sales (vs. 3.3x), has trailing net margins of 16% (vs. 14%), and has returned -1% during the last 2 years (vs. +7%). The31 firms in italics have previously been targeted by activist campaigns.
Exhibit 19: Russell 3000 stocks vulnerable to shareholder activism (ranked by market cap within sector) firms greater than $5 billion in market cap, at least one source of vulnerability, trailing sales growth at least 10 pps lower than sector median; previous activist targets in italics
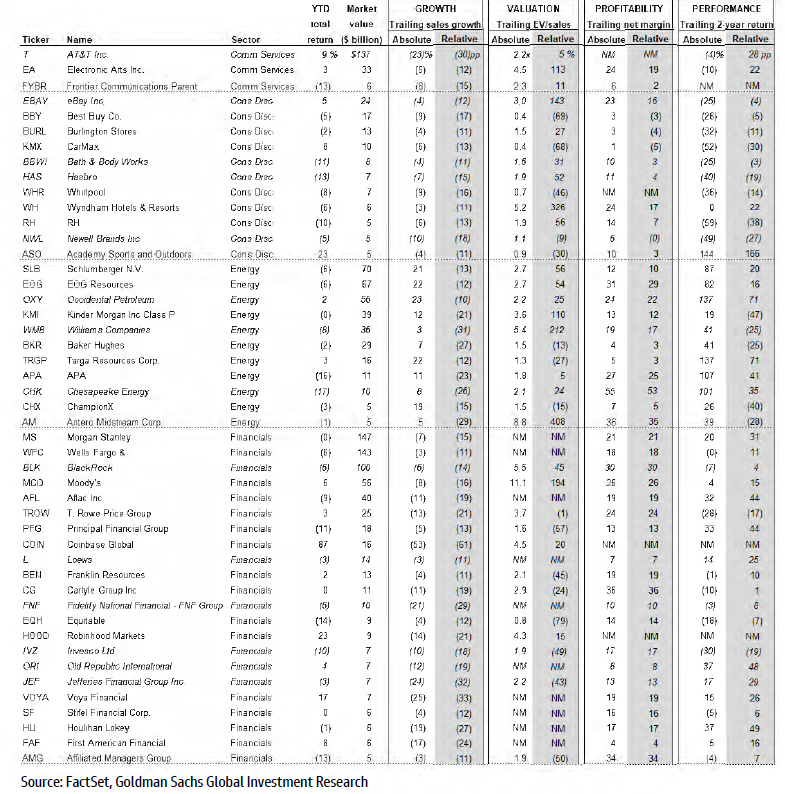
Exhibit 19 (continued): Russell 3000 stocks vulnerable to shareholder activism (ranked by market cap within sector) firms greater than $5 billion in market cap, at least one source of vulnerability, trailing sales growth at least 10 pps lower than sector median; previous activist targets in italics
Download the complete report here.