 Print
PrintMatthew Mazzoni is a Consultant and Jennifer Teefey is a Senior Associate Consultant at Semler Brossy LLC. This post is based on a report by Mr. Mazzoni, Ms. Teefey, Mira Yoo, Jay Veale, Cecilia Miao, and Anjani Trivedi, with data provided by ESGAUGE. Related research from the Program on Corporate Governance includes The Perils and Questionable Promise of ESG-Based Compensation (discussed on the Forum here) by Lucian A. Bebchuk and Roberto Tallarita.
INTRODUCTION
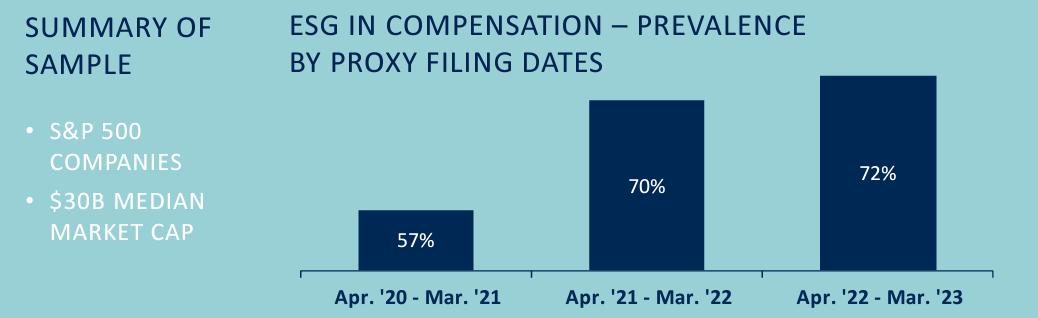
ESG metric prevalence in incentives continues to increase among S&P 500 companies but at a slower rate than prior years, as market focus shifts to refining existing ESG metric types and structures rather than increasing adoption.
While ESG has become highly politicized, the principles behind the movement (corporate responsibility, diversity, sustainability, etc.) remain critical to long-term company performance. We expect the dialogue within companies and among stakeholders regarding these metrics to shift toward how these measures are being used, including the following:
- Have we appropriately focused on the material and strategically important measures for our success?
- Are the measures appropriately weighted relative to other strategic priorities?
- Do employees and stakeholders understand the measure’s significance & how they fit in long-term strategy?
- Is there appropriate rigor in defining the goals and assessing results to ensure that we are making needed progress?
KEY TAKEAWAYS FROM 2023 DATA
72% of S&P 500 companies applied ESG in incentive plans this year, representing a net 2.8% year-to-year growth in companies using ESG metrics vs. 23% growth last year (note: net figure includes ~1.4% of companies that dropped ESG in incentives year-to-year to focus programs on financial metrics). There have been notable shifts this year in the metric types and structures used.
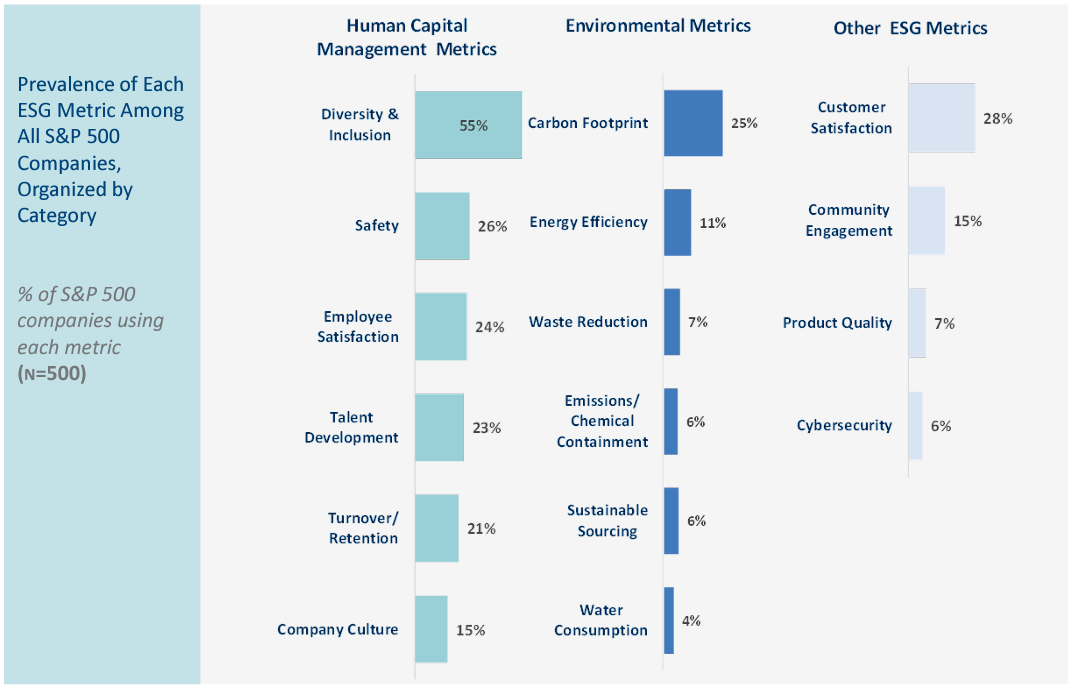
- Diversity & Inclusion (D&I) remains the most prevalent single metric, used by 55% of S&P 500 companies, while human capital management (HCM) remains the most prevalent metric category, used by 68% of S&P 500 companies
- D&I and Carbon Footprint continue to see the largest year-to-year increase among individual ESG metrics, while environmental metrics continue to increase in prevalence relative to HCM and other metrics
- Companies continue to shift towards formal, weighted structures for ESG inclusion in incentive plans vs. discretionary structures, while metrics are more often included in annual incentives (AIP) vs. long-term incentives (LTIP), consistent with prior years
These findings are consistent with our predicted outcomes from last year, and we predict these trends to persist moving forward.
METRIC PREVALENCE
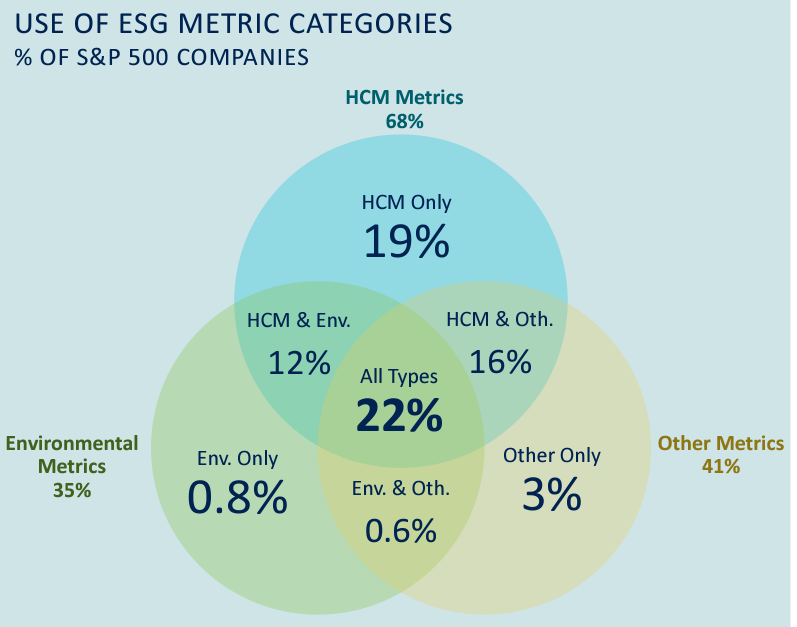
HCM 68%
Overall, HCM is the most prominent category of metrics, with 68% of the S&P 500 incorporating these metrics into incentive plans. D&I is the most prominent metric in this category and in the S&P 500.
Env. 35%
Consistent with prior years, environmental metrics are the least prevalent ESG category considered in 35% of S&P 500 compensation plans, but also the fastest growing in prevalence. Carbon Footprint and Energy Efficiency continue to emerge as the environmental metrics of choice.
Other 41%
Other ESG metrics consist of operational, consumer-focused, and broader social measures and represents the second most prominent category, with 41% of the S&P 500 implementing these measures, the same amount of companies as last year.
YEAR-OVER-YEAR TRENDS IN METRICS & METRIC CATEGORIES
As investors maintain their focus on social and environmental sustainability measures, companies are adding more environmental metrics to their incentive plans relative to HCM and other ESG metrics. Over the last two years, the proportion of companies with ESG in their incentive plans that use envir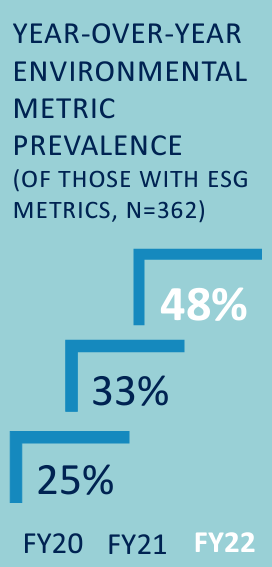 onmental metrics has increased from a quarter (25%) to nearly half of the sample (48%). Meanwhile, the use of the HCM and other ESG metric categories have remained relatively flat across the years.
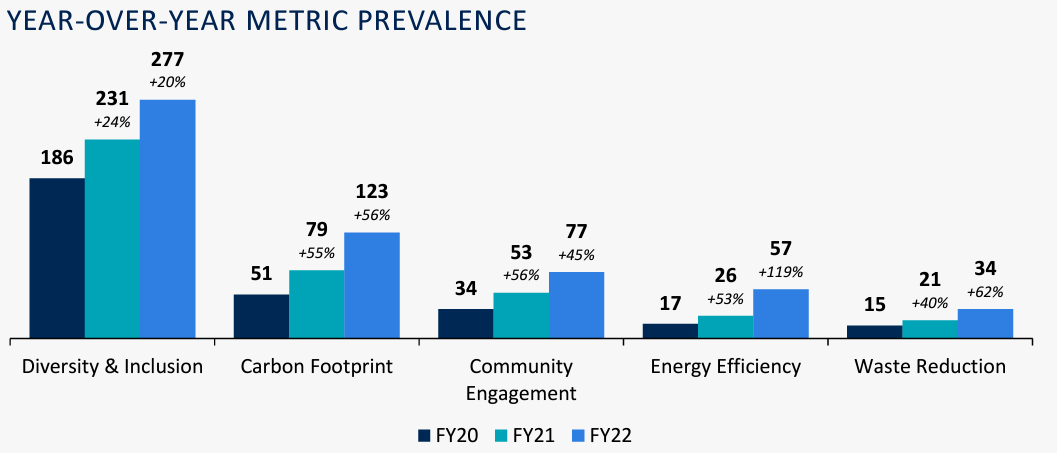
Carbon footprint and energy efficiency metrics continue to have the largest year-over year increases among environmental metrics as both have emerged as the environmental metrics of choice in the sample. Both metrics are top-of-mind to investors and often work in conjunction together to push companies towards the overall goal of operating with more sustainable energy usage.
Separately, D&I continues to be the most prevalent metric with more than half of the S&P 500 (55%) considering these metrics in executive incentive plans. D&I metrics have increased at a consistent rate from 2020 of near 20% – 25% each year. Similarly, the proportion of companies using community engagement metrics have increased significantly from 7% to 15% in total prevalence since 2020.
We expect these trends in adoption of environmental and social metrics to continue as stakeholder focus on environmental and social issues grows.
STRUCTURE OF ESG IN INCENTIVE PLANS
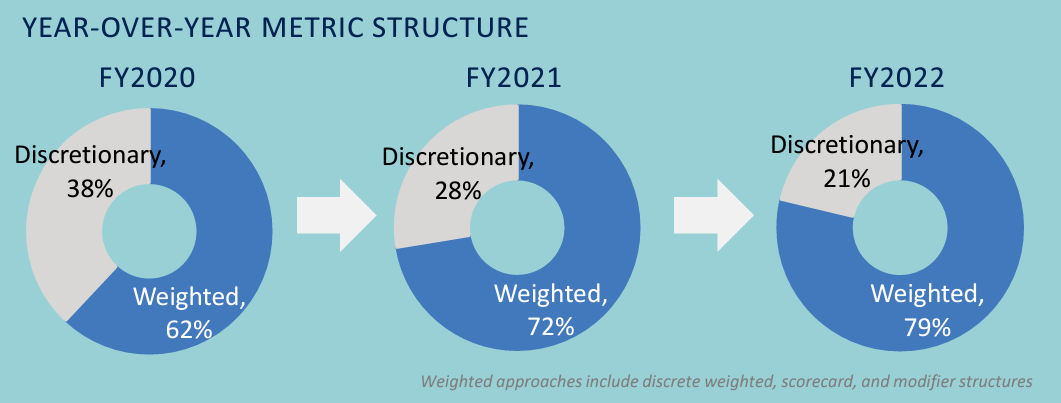
Companies continued the shift to use more formal, weighted structures for ESG metrics in incentives as 79% of companies now employ weighted structures vs. 72% last year and 62% in 2020. “Formal” metrics
do not necessarily mean that they are assessed using a formulaic approach. However, it does imply that discrete measures and objectives are being used to assess performance.
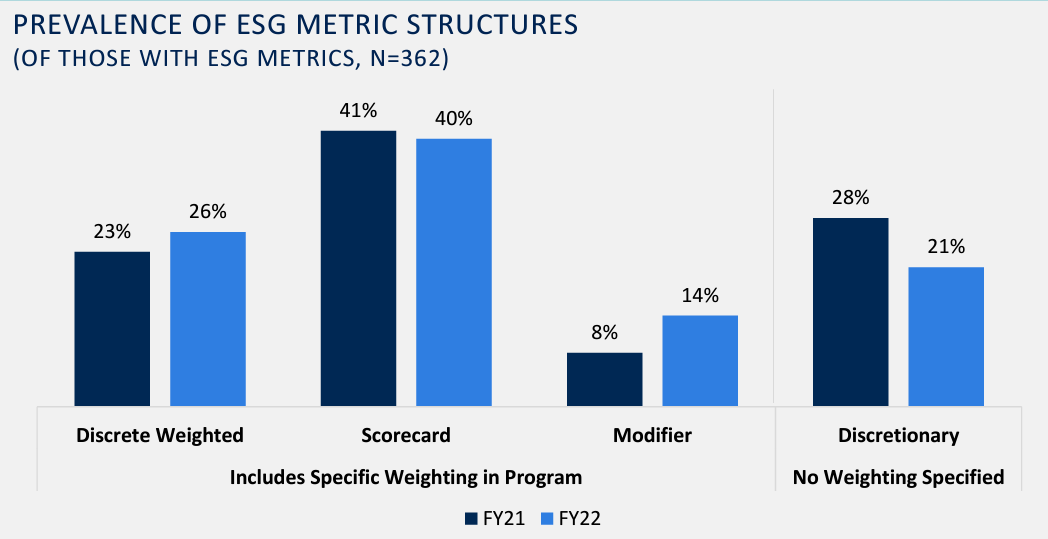
The “Scorecard” approach continues to be the most prevalent structure (40%) as it provides Committees with discretion to assess performance and to update metrics, goals, and priorities each year without adjusting the fundamental incentive plan design. We expect to see a continued shift towards formal, weighted structures in incentive plans as focus continues to shift towards incorporating ESG in incentives in a meaningful way that directly impacts executive pay.
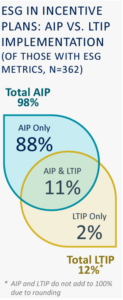
Nearly all companies with ESG metrics (98%) incorporate metrics into their AIP while inclusion in LTIPs are still relatively uncommon (12% of the same group). This trend has remained relatively consistent from last year, which may be driven by the fact that including ESG in AIPs gives companies more flexibility in goal setting year-to year based on key priorities. Equity incentives have greater goal setting and accounting challenges, as long-term goals are required to be set at the start of the performance period. This may also leave companies more vulnerable to external and legal scrutiny based on goal disclosure and/or failure to reach these goals.
APPENDIX – DEFINITIONS & ADDITION DATA
HCM METRICS
- Company Culture
- Diversity & Inclusion (D&I)
- Employee Satisfaction
- Talent Development
- Turnover/Retention
- Safety
ENVIRONMENTAL METRICS
- Carbon Footprint
- Emissions/Chemical Containment
- Energy Efficiency
- Sustainable Sourcing
- Waste Reduction
- Water Consumption
OTHER ESG METRICS
- Community Engagement
- Customer Satisfaction
- Cybersecurity
- Product Quality
METRIC CATEGORIES
Environmental metrics have experienced significant year-over-year growth while HCM metrics remain the most prominent, with other metrics decreasing in prevalence.
ESG STRUCTURE BREAKDOWN
Year-to-year changes in metric structure driven by i) a shift to add weighted components to pre-existing discretionary metrics, and ii) most companies who added metrics did so in a weighted structure.
Scorecard metrics remain the dominant ESG structure used by 40% of the sample. This structure allows companies flexibility to focus on a handful of ESG metrics that are important to business strategy while leaving more room for discretion in determining pay outcomes relative to performance against goals. These structures are often used for qualitative goals.
Discrete weighted metrics continue to increase in prevalence as companies look to implement ESG metrics in a meaningful way into the pay program. These metrics are used for companies that have specific ESG metrics that drive business outcomes. These structures are often used for metrics with quantitative goals.
Modifiers allow ESG metrics to affect pay outcomes without holding specific weight within the plan.
Discretionary metrics are still used at 21% of companies, but companies are continuing to move away from this structure as they look to implement metrics in a more meaningful fashion moving forward.
