Print
PrintJun Qian (QJ) is Professor of Finance and Executive Dean at the Fanhai International School of Finance (FISF), Fudan University. This post is based on a forthcoming article in the Journal of Finance by Franklin Allen, Professor Qian, Chenyu Shan, and Julie Lei Zhu.
The Chinese stock market started in 1990 with the establishment of two domestic stock exchanges (the “A share” market): the Shanghai Stock Exchange (SSE hereafter) and the Shenzhen Stock Exchange (SZSE). The number of listed firms has been growing since then, with more than 5,000 firms now listed in the two exchanges and the newly established Beijing Stock Exchange. The A share market is the second largest in the world in terms of total market capitalization, trailing only the US equity markets. Due to stringent listing requirements in the domestic market, among other reasons, a large number of Chinese firms are listed externally, mostly in the Hong Kong exchange (HKEX), which follows regulations similar to those in the US and is open to global investors. The second most popular external IPO destination for Chinese firms is the US.
During the period of 2000-2018, the Chinese economy grew by a factor of 4.8 in real terms, much faster than the rest of the large economies, including India, Brazil, Japan and the US. Firm-level, cross-country regressions indicate that A share firms underperform a large set of listed firms from both developed and developing countries by 15.0% per year, while externally listed Chinese firms’ performance is on par or better than the same set of listed firms from other countries. In terms of cumulative, ‘buy and hold’ returns, the performance of the A share market is the worst among the group of large countries (see Figure 1). The cumulative returns of the A share market are lower than those of five-year bank deposits or three- and five-year government bonds in China, and investors in the domestic stock market earned essentially zero net return in real terms.
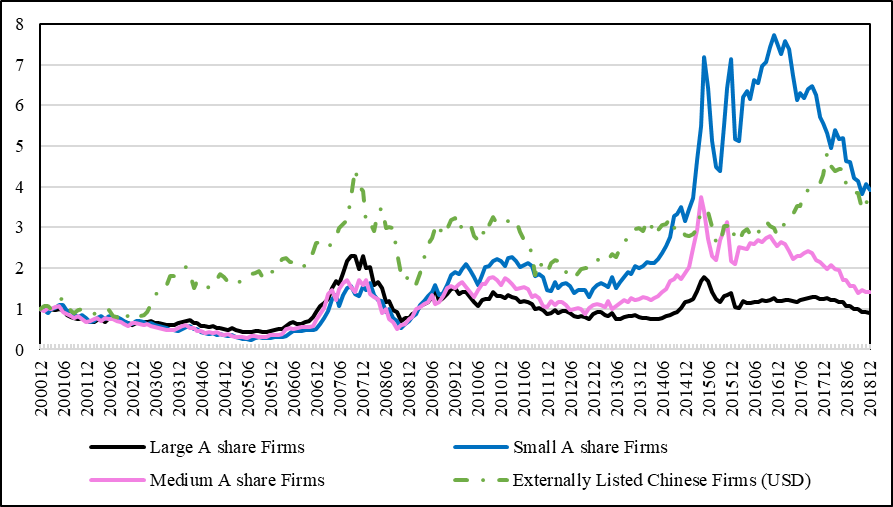
A share listed firms have much higher levels of investment (CAPEX scaled by assets) than that of matched (by industry and size) unlisted Chinese firms and listed firms from other developed and developing economies. However, their net cash flows (= EBITDA – Income Taxes – Changes in Working Capital – Capex, scaled by assets) are lower than that of the groups of Chinese and foreign firms. These results indicate investment inefficiencies of A share firms. Interestingly, the underperformance of A share firms in both stock and accounting returns is more pronounced for large cap (largest 30%) companies. Small cap (smallest 30%) firms, on the other hand, do not underperform in terms of stock returns or accounting measures as compared to the same groups of firms (Figure 2 plots the BHRs of small-, medium-, and large-cap firms over the sample period).
We develop a theoretical model to consider possible explanations for the low returns and cash flows for A share firms. There are two types of listed firms: the “A share firms” operate in an environment with poor institutions and are poorly governed, and have a low growth rate of cash flows, while externally listed firms operate in a good institutional environment, are well governed, and have a high growth rate of cash flows. Based on the model predictions, we then develop two empirical hypotheses. First, deficiencies in institutional features of the domestic market, including corporate governance, can explain poor performance as measured in both stock returns and accounting metrics. Second, domestic investors’ behavioral biases can explain low stock returns in the A share market.
Each listed firm must be approved by the China Securities Regulation Commission (CSRC, equivalent to the SEC in the US), and must show profits in two or three consecutive years leading up to the IPO application year to satisfy CSRC’s listing standards (which were revised beginning in 2019). Moreover, state-owned enterprises, firms from government-supported industries and those with connections to the regulators are more likely to be listed, whereas privately owned firms, especially those from new and growth industries without high, current profitability, face much higher hurdles.
For successfully listed firms, their performance falls sharply following the IPO. The average ROA (return on assets) dropped from 13% pre-IPO to just above 6% post-IPO, which is larger than the drop in ROA of listed firms from other markets. These results indicate that the best-performing firms within an industry are not always selected to enter the A share market; listed firms ‘prop up’ their performance to clear the IPO hurdle but such performance is not sustainable post IPO. Once listed, firms are rarely delisted from the exchanges in China and the ‘shell’ of a listed firm is valuable given the difficult listing process; poor-performing firms are not dropped from the market, which worsens the adverse selection of the listed firms in the A share market.
Our first hypothesis also indicates that poor corporate governance, in terms of motivating and monitoring firms’ management to create value for all the shareholders, especially minority shareholders, is consistent with the underperformance of the A share firms. In particular, lower net cash flows are associated with more related-party transactions (RPTs) for A share firms, a proxy commonly used in the literature for tunneling by the controlling shareholders. Following prior literature, we create a governance index that includes ownership concentration, insider ownership, and board structure (board size and CEO’s role) and find it to be correlated with (future) stock and accounting returns in the cross-country sample of listed firms. Within the sample of A share firms, we add two dimensions—state ownership and the extent of insider ‘tunneling,’ based on the RPT variable—to create the A share governance index. This governance index can explain variations in stock returns and accounting performance across A share firms.
Some of the above results are also consistent with our second hypothesis based on investor behavioral biases. If a significant fraction of the A share investors does not fully understand the institutional background of regulations and reforms, or the purpose and effects of insider activities of listed firms, but remain optimistic about the firms’ prospects, stock prices can be higher and returns lower than when everyone has rational expectations. We follow prior literature and construct investor ‘sentiment’ measures at the market- and firm-levels and find that higher sentiment levels are associated with lower subsequent stock returns in both the cross-country sample and the A share sample.
We then pool all the institutional factors, including deficiencies in the IPO process (proxied by the drop in ROA around IPO), the governance indexes (in both the cross-country sample and A share sample), and the behavioral factors into a unified framework to examine stock returns in both the cross-country and the A share samples. Investor sentiment (at the market level) is the most dominant factor in explaining the underperformance of A share stocks in the cross-country sample, while the cross-country governance index and the post-IPO performance drop are contributing factors. Within the A share sample, both the A share governance index and investor sentiment (based on turnover at the stock level) are important factors in explaining the variations of returns. The A share governance index can also explain differences between large and small firms in both stock and accounting returns.
The normative implication of our results is that the CSRC should reform the IPO procedure to move towards a market-oriented process and encourage the listing of privately-owned firms and those from growth industries. They should also strengthen the enforcement process of delisting poorly performing firms. In this regard, the CSRC initiated a pilot program using a ‘registration system’ similar to those used in Hong Kong and the US, to select and list firms from a set of technology industries in the SSE in 2019. The “Science and Technology Innovation Board (STAR)” also includes strict implementation of the delisting procedure of poor-performing firms and firms found to have committed accounting frauds. This system has been extended to the GEM board of the SZSE in 2020, the newly established Beijing Stock Exchange in 2021, and the rest of the boards, including the main boards of both SSE and SZSE, in February 2023. Most importantly, the regulators need continue to improve the structure of the investor base by encouraging more institutional investors in the market to eliminate investor biases and increase firms’ investment efficiency through strengthening corporate governance. Taken together, these measures can further improve the mixture of firms in the market as well as resource allocation and increase returns to all shareholders.
Figure 1. Buy-and-Hold Monthly Returns of Stocks Listed in Large Countries and Externally Listed Chinese Companies (2000-2018)
This figure plots the value-weighted, buy-and-hold returns (BHR) of the stocks listed in the markets of China (A share), the US, India, Brazil, Japan, externally listed Chinese firms, and the 30% smallest A share firms. The BHRs are calculated by accumulating value-weighted monthly returns of all the stocks listed in the country with the lagged-one-year market capitalization as the weight. For externally listed Chinese firms, the weight is the lagged-one-year market capitalization in US dollars. The returns are calculated at month-end, adjusted for stock splits and include cash dividends. Nominal returns are denominated in local currencies and adjusted for local inflation to convert to real returns. Inflation is measured by the month-average CPI rate of the listing country. The number of unique firms to make the plot for China, the US, India, Brazil, Japan, and Externally Listed Chinese Firms is 3695, 12200, 4819, 535, 4648, 1770, and 2178, respectively.
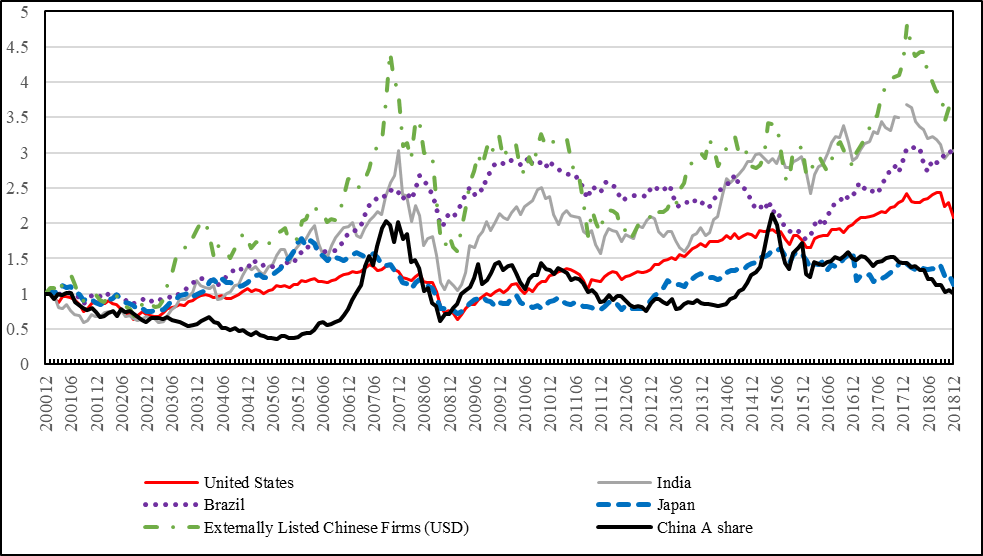
Figure 2. Buy-and-Hold Monthly Returns of Large, Medium, and Small Cap Stocks Listed in the A share Market
This figure plots the value-weighted average buy-and-hold returns of small, medium, and large A share firms and externally listed Chinese firms, with the lagged-one-year-market capitalization as the weight. Small and large firms are determined by the 30th and 70th percentile points in the lagged-one-year market capitalization by year.