 Print
PrintPaul Hodgson is a Senior Advisor at The Conference Board, Inc. This post is based on his Conference Board memorandum.
The CEO is consistently the highest-paid executive in the C-Suite, but how does CEO compensation compare to that of other executives? This report examines the ratio of CEO total compensation to that of chief financial officers (CFOs), chief legal officers (CLOs), chief operating officers (COOs), chief human resource officers (CHROs), chief marketing officers (CMOs), and named executive officers (NEOs) as a whole, across the S&P 500 and the Russell 3000.
Key Insights
- Between 2020 and 2024, the gap between total CEO compensation and non-CEO executives narrowed in the S&P but widened in the Russell 3000.
- There are substantial role variations by industry in the pay ratios of other executives to the CEO; for instance, for all NEOs in the Russell 3000, the differences are widest in materials, industrials, and utilities.
- In the Russell 3000, median total compensation for all NEOs does not exceed 50% of CEO median total compensation in any industry—although a small number of individual C-Suite positions in certain sectors do surpass this threshold.
- Gender pay gaps were smaller in the Russell 3000 but more pronounced in the S&P 500, with woman CMOs, in particular, earning significantly more than their men counterparts.
 Pay Gaps Between the CEO and Other C-Suite Executives Widen in the Russell 3000, but the Trend Is Mixed in the S&P 500
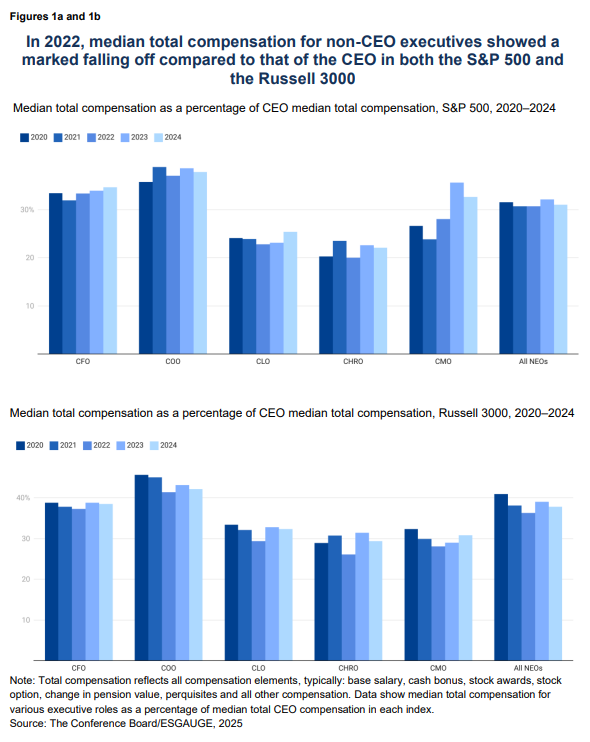
In the Russell 3000, the most consistent pay differential between a C-Suite executive and the CEO was for CFOs. CFOs earned between 37% and 39% of CEO pay between 2020 and 2024, showing only slight fluctuations. For the S&P 500, CFO compensation as a percentage of CEO pay increased slightly, from 33% in 2020 to 35% in 2024.
For other non-CEO roles in the Russell 3000, the median pay gap against CEOs showed mixed trends. COOs consistently earn around 42% of CEO compensation in 2024, although this represents a decrease from 46% in 2020. CLOs, CHROs, and CMOs earn about 30% of CEO pay, with fluctuations from year to year.
In the S&P 500, role-specific pay trends were more varied. CMOs saw the most notable increase in relative compensation, rising from 27% of CEO pay in 2020 to 33% in 2024, a gain of six percentage points. CHRO and COO compensation saw slight declines, with COOs earning 38% and CHROs 22% of CEO pay in 2024, compared to 39% and 23% in 2023. CLO compensation, meanwhile, rose slightly, from 23% in 2023 to 25% in 2024.
The gap between CEO compensation and that of other C-Suite executives is notably wider in the S&P 500 than in the Russell 3000, likely due to the “ratchet” effect. Larger firms benchmark CEO pay against peers, driving continual increases as companies compete for top talent. This effect is more pronounced in the S&P 500, where firms are larger, more visible, and under greater pressure to attract high-profile leaders. Median compensation for non-CEO executives in the S&P 500 therefore hovers closer to 30% of CEO pay, compared to 40% in the Russell 3000.
In 2024, total compensation for all NEOs is 38% of CEO pay in the Russell 3000 and 31% in the S&P 500. Notably, COOs in both indexes earn relatively higher shares of CEO pay—42% in the Russell 3000 and 38% in the S&P 500—while roles such as CLO, CHRO, and CMO trail between 22% to 33% of CEO pay, depending on the role and index.
There Are Wide Industry Differences Between What Some Positions Are Paid Compared to the CEO

Across the Russell 3000, median total compensation for NEOs shows significant variations by industry and role, with notable differences when compared to CEO compensation. Such differences are the widest in materials, industrials, and utilities. Conversely, the gap is narrowest in financials, health care, and communications services.
The relationship varies by industry:
- CFOs: CFOs in communication services earn 50% of the CEO’s total compensation, the only instance where a C-Suite role reaches the 50% threshold. By contrast, CFOs in financials earn 41% of CEO pay.
- COOs: COOs are relatively consistent in their alignment with CEO compensation, earning 46% in financials, 47% in information technology, and 48% in health care. In materials, however, COOs earn 43% of CEO pay, significantly higher than other roles in that industry but notably lower than COOs in other industries.
- CHROs: CHROs see their highest relative compensation in health care (37%) and financials (49%), reflecting the perceived strategic importance of their role in these industries.
- CLOs: CLOs receive the highest median compensation relative to CEOs in communication services and financials.
In the Russell 3000, median total compensation for all NEOs does not exceed 50% of CEO median total compensation in any industry. However, three specific roles in certain industries do meet or surpass this threshold: CFOs and CMOs in communication services (50% and 72%, respectively) and CMOs in real estate (53%). However, as the sample size for CMOs in communication services is small, the finding should be treated with caution and may not be indicative of a broader market trend. Other roles approach but do not exceed this benchmark, including COOs in health care (48%) and information technology (46%).
C-Suite Pay Is Relatively Equitable for Men and Women in Both the Russell 3000 and the S&P 500
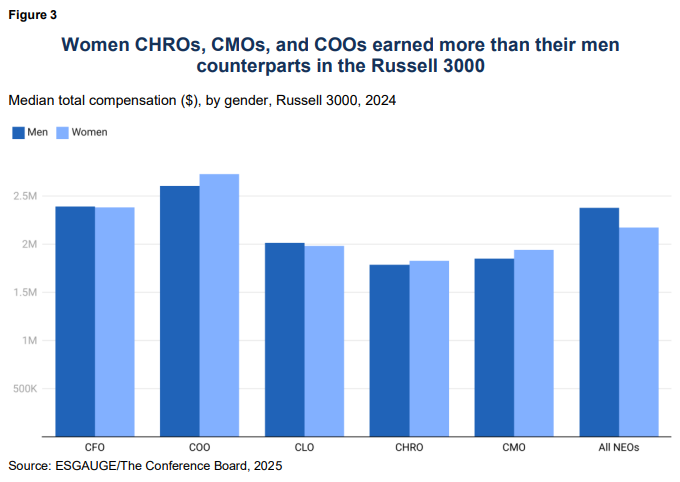
In the Russell 3000, differentials between men and women non-CEO total compensation are generally less than $100,000, indicating a relatively equitable pay-setting process. Women CHROs, CMOs, and COOs out-earn their men counterparts, though by small amounts. In contrast, men CFOs and CLOs out-earn women in those positions.
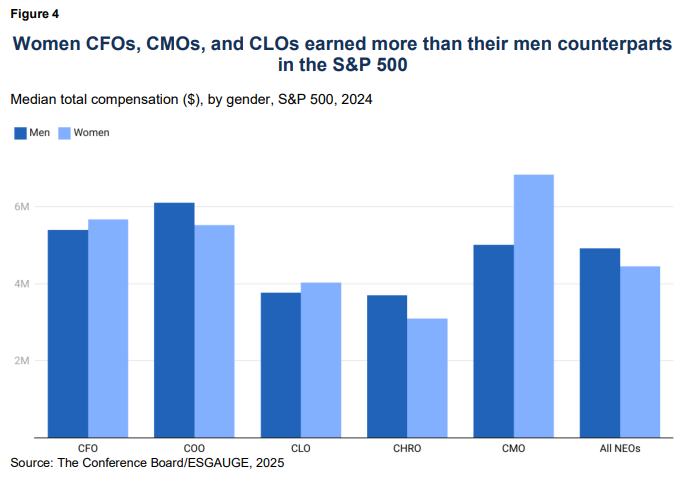
In the S&P 500, differentials between men’s and women’s median total compensation are wider in absolute terms, although this is, in part, a function of the higher pay levels in the index. This is in contrast to the Russell 3000, where men CHROs and COOs earn more than their women counterparts. However, women CLOs and CFOs earn higher median total compensation than men in those positions.
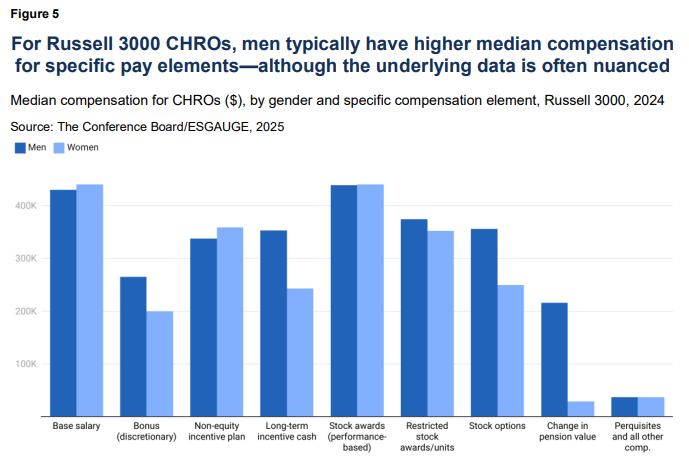
A more detailed analysis of specific functions and pay elements can further illuminate men’s and women’s pay differentials. Using CHROs in the Russell 3000 as an example, men in this role typically earn higher median amounts across most individual compensation elements. However, for companies that disclose total CHRO compensation, the median value for women is higher, at $1,888,000 compared to $1,714,000 for men. On the other hand, average total compensation favors men, who earn $2,590,000 compared to $2,422,000 for women. This discrepancy likely reflects differences in sample sizes and reporting practices, as not all companies disclose the same compensation elements or calculate total compensation in a consistent manner. These variations emphasize the need to interpret medians and averages within the context of disclosure limitations rather than viewing them as definitive representations of industry-wide compensation patterns.
This article is based on corporate disclosure data from The Conference Board Benchmarking platform, powered by ESGAUGE