 Print
PrintRyan Colucci is a Principal at Compensation Advisory Partners. This post is based on his CAP memorandum.
Relative Total Shareholder Return (rTSR) continues to dominate the long-term incentive landscape for S&P 500 CEOs, appearing in 58% of performance share unit (PSU) awards. Its appeal lies in its perceived objectivity since it does not rely on financial targets established internally, its ability to create a clear link between shareholder experience and executive payouts, and the ease of communication to investors and proxy advisory firms.
Yet rTSR’s simplicity can be deceptive. While it measures stock price appreciation plus dividends relative to a benchmark, results can be heavily influenced by broader market forces, interest rate shifts, or sector cycles. As a result, companies face two fundamental questions when choosing to implement rTSR into their long-term incentive plans: (1) What design choices will best reflect the company’s performance philosophy? And (2) How much weight should rTSR carry in the plan?
Implementation: Weighted Metric vs. Modifier
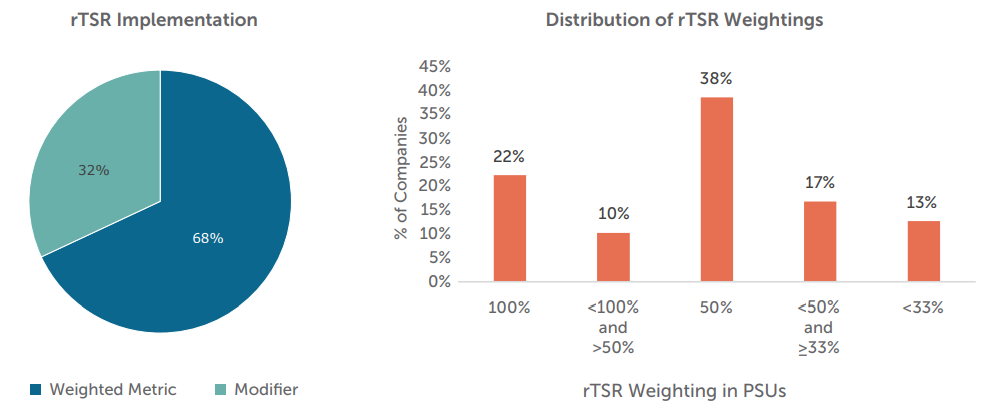
The first decision is whether to use rTSR as a primary weighted metric or as a modifier to other financial results.
Most companies give rTSR a prominent role, with 68% using it as a weighted metric, meaning it directly determines a portion of the PSU payout. While 50% is the most common weighting (38% of companies), practices diverge sharply on either side. About one-third lean heavily on rTSR, with 22% weighting it at the full 100%. At the other end, 29% set it below 50% — and only a small minority, 13%, drop below 33%, most often at 25%.
When rTSR is a weighted metric, nearly nine in ten companies measure performance as a percentile rank within their comparator group. The median payout scale begins at the 25th percentile for threshold, reaches the 50th percentile for target, and tops out at the 80th percentile for maximum payout. While the traditional 25th / 50th / 75th percentile performance goal scale remains the single most common approach (31%), it is no longer majority practice, as more rigorous maximum goals have become increasingly common.

For a smaller percentage of companies (7%), rTSR goals are expressed as the percentage difference from an index’s performance rather than as a percentile rank. This approach is straightforward to track and avoids certain complexities (such as adjusting for M&A), but it can lead to irregular outcomes. In index-heavy benchmarks, large constituents can have an outsized influence, for example, the “Magnificent Seven” stocks (Apple, Microsoft, NVIDIA, Alphabet, Amazon, Meta, and Tesla) currently make up over one-third of the S&P 500’s market capitalization.
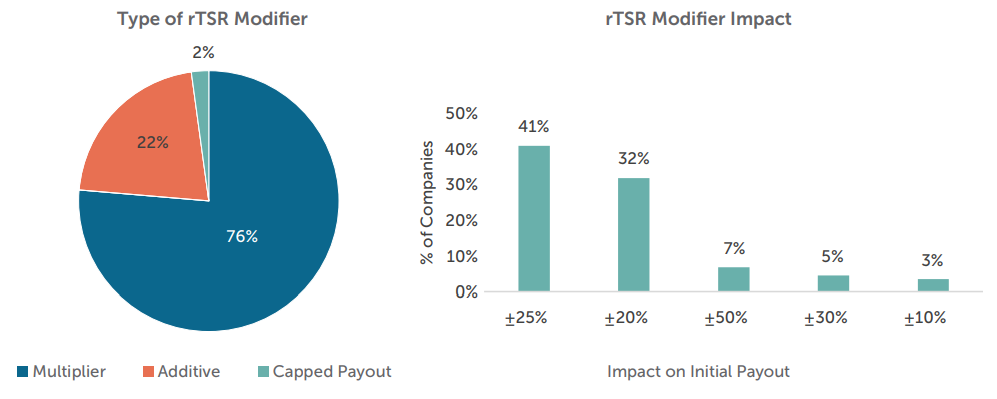
The modifier approach plays a different role, with 32% of companies applying rTSR as a modifier to results from other metrics. Multiplicative adjustments are the norm (76%), with most designs using symmetric ranges such as ±20% or ±25%, often corresponding with top- or bottom-quartile performance. A smaller group opt for additive adjustments (22%), and a few employ asymmetric ranges that penalize underperformance more than they reward outperformance. Two companies, Chipotle and American Express, apply their rTSR modifiers purely as caps. For Chipotle, the award payout is capped at target if rTSR performance is in the bottom quartile compared to other S&P 500 constituents. American Express has a similar payout cap at 100% of target; however, this applies in all instances where rTSR performance falls below the 67th percentile of a custom peer group, which creates a much higher penalty.
The choice between a weighted metric and a modifier reflects a company’s philosophy on pay-performance alignment. Weighted metrics make rTSR a central driver of payouts, appealing to investors who value direct market alignment. Modifiers keep rTSR in a secondary role, reinforcing other financial or strategic goals without overshadowing them. However, the downside to using rTSR as a modifier is that if results fall short due to the inability to plan with precision, there may well be no payout to modify. Companies choosing to have rTSR as the sole performance measure (22%) may have difficulty setting multi-year goals for financial metrics, and the use of rTSR alleviates this concern by serving as an objective assessment of long-term results.
Comparator Groups
Once rTSR’s role is set, the next question is: Who should we measure against?
Most companies compare their rTSR to the performance of the constituent companies in an index. In the sample reviewed, 61% compare performance against a single index, 37% against a custom peer group, and 2% against both. Among those comparing against an index, approximately half (51%) choose a general industry index like the S&P 500 or Nasdaq 100, while 48% select an industry-specific benchmark. Unsurprisingly, the S&P 500 itself is the single most common comparator index, used by 44% of all companies.

Nearly all companies (96%) measure against just one comparator set. Only a handful compare against multiple groups of companies, 4% use two indices, and only one compares against three. When companies do choose to compare against multiple indices, it is common to use both a general industry group and an industry-specific group, which may lead to different outcomes based on macroeconomic conditions.
The trade-off is clear: indices are transparent and objective but may be less relevant for companies in niche sectors, while custom peer groups can provide a sharper performance comparison and the ability to control the sample size but require more judgment and justification in their selection.
CAP cautions companies using sector indexes to carefully consider the constituents included, as they may be reclassified over time. For example, due to changes in GICS codes during 2023, “Data Processing & Outsourced Services” (e.g., Broadridge Financial) and “Human Resources and Employment Services” (e.g., Paycom Software) are now grouped in the S&P 500 Industrials sub-industry index alongside traditional industrial companies such as Boeing and Deere. This blending of fundamentally different business models can distort performance comparisons within the index, meaning rTSR results may reflect shifts in sector makeup rather than true differences in company performance.
Absolute TSR Caps
One-third of companies build in a safeguard for down markets: an absolute TSR cap that limits payouts when shareholder returns are negative, no matter how strong relative performance is.
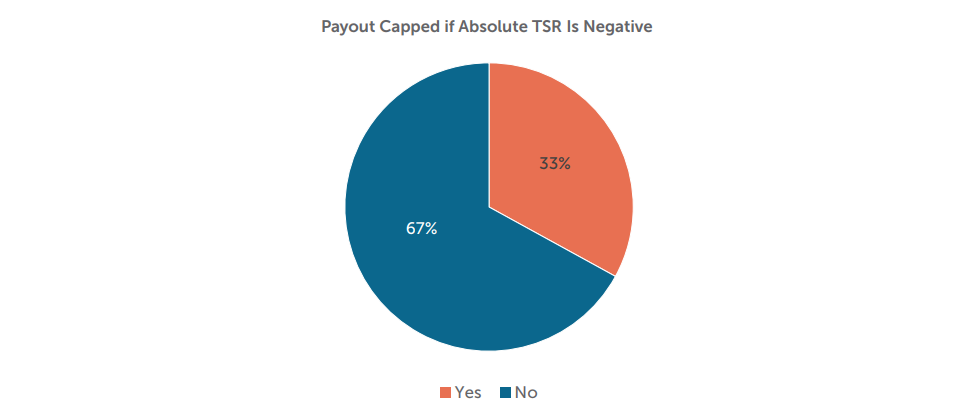
The prevailing approach, used by 95% of companies with a cap, is to limit payouts to 100% of target. Outliers to this practice include capping at 125% or 150%, zeroing out payouts entirely, or reducing them by a fixed percentage (e.g., -20%). It is important to note that these caps most often apply only to the rTSR portion of awards, rather than the entire award, although some companies do apply the cap to the full payout.
These provisions resonate with investors because they prevent windfall payouts in down markets and help manage share usage when stock prices are depressed.
Performance Periods
Three-year performance periods are nearly universal in rTSR plans (99.3% of companies). Just one company each uses a two-year or a four-year performance period.
While most measure rTSR cumulatively over the full period, a small subset (3%) calculates rTSR for each interim period and then average the results, a design most often seen when rTSR is the only metric used for PSU payouts. This approach smooths the impact of performance spikes or dips in any single year and reduces reliance on a single measurement window.
Stock Price Measurement Methodology
While rTSR is ultimately a measure of return, how companies measure the starting and ending stock prices varies.
Averaging is by far the dominant approach. 90% of companies smooth volatility by averaging stock prices at the beginning and end of the period, compared to just 10% that use a simple point-to-point calculation.

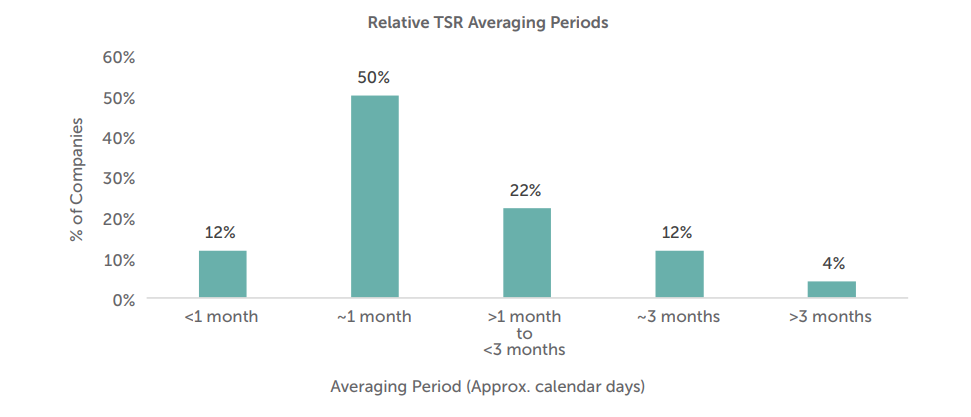
Companies describe these averaging windows in either trading days or calendar days, with disclosures split roughly evenly (53% vs. 47%). Standardizing them so that 30 calendar days is roughly equivalent to 20 trading days reveals a strong clustering around one month: half of companies use a one-month average. Another 22% use periods between one and three months, most often 45 days (~30 trading days) or 60 days (~40 trading days). About 12% use a three-month period (90 days), while 12% use less than one month, most commonly 20 days (~9% of all companies). Longer averaging windows are rare, with only 4% exceeding three months, including one notable outlier, Ball Corporation, which averages a full year at both the front and back ends of the performance period.
These kinds of design decisions, whether on averaging periods, comparator groups, or rTSR’s role in the PSU design, highlight that even within a framework of well-established norms, companies regularly make adjustments to fit their own circumstances.
Conclusion and Takeaways
Relative TSR design follows well-established patterns, but most programs include elements of customization that stray from the norms. In CAP’s view, the two most critical levers are:
1. Implementation method: weighted metric or modifier, and magnitude
2. Comparator group selection: relevant, competitive, and statistically sound
Understanding prevailing market norms is essential for benchmarking and credibility, but awareness of less common, more unique designs is equally valuable. These “fringe” approaches can be just as effective, and sometimes better, in aligning pay with performance when they are thoughtfully matched to a company’s specific goals and circumstances.