 Print
PrintGeorge Anderson, Rebecca Thornton, and Julie Daum are Consultants at Spencer Stuart. This post is based on their 2025 U.S. Spencer Stuart Board Index.
In a complex business environment, board composition continues to evolve, with boards now showing a greater preference for directors who have seasoned experience. For the past 40 years, our firm has studied the composition, governance practices and refreshment trends of boards across the S&P 500. The long-running nature of our research gives us a unique perspective on how boards have evolved from compliance-focused bodies to strategically engaged stewards guiding long-term value.
Yet amid rising complexity and uncertainty, boards are racing to keep pace. Another 2025 Spencer Stuart study found that only 22% of CEOs report receiving effective board support to navigate today’s challenges. Similarly, only 43% of CEOs said that their board directors have specific subject-matter expertise aligned with the company’s most pressing issues, compared with 63% of directors.
In this environment, boards are recalibrating their composition, prioritizing directors with experience — seasoned leaders able to serve as strategic partners to management. And this year’s incoming class reflects this shift; as a whole, they are older, most likely to be retired and to have served on a public board previously, and more likely to have a background as a CEO or financial executive.
Here are the highlights from our annual analysis of the latest S&P 500 proxy statements, examining board composition, governance practices and director compensation trends.
Board refreshment is down compared with previous years
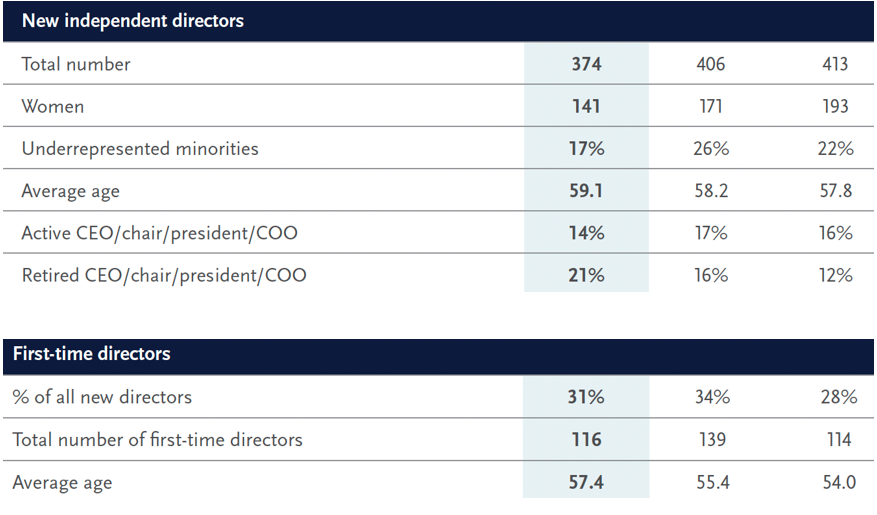
- S&P 500 boards appointed 374 new independent directors in 2025, an 8% decrease from last year and the lowest number since 2016. Average annual turnover is now 0.8 new directors per board. However, the year-over-year decline reflects a longstanding pattern, with new director appointments approximating the prior year’s number of director departures (374 last year).
- Only 50% of S&P 500 boards appointed a new independent director this year (down from 58% in 2024).
- Two-thirds of boards have mandatory retirement policies, a decline from 2015, when 73% had such policies in place. Of those with mandatory retirement policies in place, 64% set the age at 75 or older, and that share has nearly doubled since 2015 (34%).
Proven executive experience is in demand
- Among incoming directors joining boards in 2025, 30% are active or retired CEOs, and 29% have financial experience, both in line with 2024.
- New appointees this year skew older, with an average age of 59.1, compared with 58.2 in 2024. First-time directors skew younger, but the average age of first-time directors in the class of 2025 has also increased, from 55.4 years to 57.4 years.
- New appointees are more likely to be retired (59%), an increase of 11 percentage points compared with 2024.
- The number of first-time directors declined to 31% of all incoming appointments, from 34% in 2024.
- The share of next-gen director appointments (people aged 50 or younger) declined to 11%, from 14% in 2024.
Financial and P&L leadership backgrounds are more common
- 29% of incoming directors have financial backgrounds, and 25% have functional or profit-and-loss leadership roles. Although those numbers have been relatively flat in recent years, they have increased from 21% and 18% 15 years ago, respectively.
- Among industry backgrounds, technology/telecommunications continues to be the most common, constituting 16% of new appointments in 2025, followed by industrials/manufacturing (14%), consumer goods and services (14%) and financial services (12%). All are unchanged this year.
Gender and racial/ethnic representation has plateaued after steady increases
- The share of new director appointments filled by executives self-identifying as female, Black or African American, Hispanic or Latinx, Asian, Native American or Alaska Native, Native Hawaiian or Pacific Islander, or two or more races or ethnicities, and/or LGBTQ+ declined in 2025 to 46% from 59% in 2024 and 68% in 2023. Despite the dip, representation remains higher than a decade ago: 42% in 2015.
- Women represent 38% of new directors in 2025, down from 42% in 2024 and continuing a decline from a peak in 2020.
- People from an underrepresented racial or ethnic group represent 17% of new directors, in line with the level of a decade ago (18%).
- Overall, 50% of all S&P 500 directors identify as women and/or from an underrepresented racial or ethnic group; that number is unchanged from 2024.
- One quarter (25%) of S&P 500 directors are from an underrepresented racial or ethnic group, 35% of all directors are women.
- More than half of all boards (58%) use Rooney Rule-type policies that require the consideration of candidates from a diversity of backgrounds when filling open director positions.
Independent board leadership is growing
- 61% of boards now separate the chair and CEO roles, up from 48% in 2015 and 27% in 2004.
- Independent chairs are more common as well, rising to 42% of boards today, up from just 9% of companies in 2004.
- With an increase in independent chairs, the use of lead or presiding directors has declined: At its peak in 2006, 96% of boards had a lead or presiding director; today, that has decreased to 61%.
Boards are more systematic about assessing and disclosing their performance
- Virtually all boards (99%) report conducting some type of annual performance evaluation. Roughly one-fourth (27%) disclose working with an independent third party to facilitate the evaluation process.
- Eighty percent now disclose a director skills matrix — more than double the share in 2020 (38%).
Director compensation is rising
- Average pay increased 3% to $336,352, keeping pace with inflation. Compensation mix: 59% stock awards, 36% cash. Independent chair premiums average $172,867, with lead/presiding directors at $51,011.
More boards are limiting additional director activity
- Most S&P 500 boards (86%) report a limit on directors accepting other public company directorships — up from 84% last year and 77% a decade ago.
- Just over eight in 10 boards (81%) report having a numerical limit for public corporate directorships applicable to all directors, up from 77% in 2024.
- Like last year, most of these policies limit directors to three or four additional public directorships.