 Print
PrintMatteo Tonello is the Head of Benchmarking and Analytics at The Conference Board, Inc. This post is based on a Conference Board report by Paul Hodgson, Senior Advisor, ESGAUGE, Ariane Marchis-Mouren, Senior Researcher, Corporate Governance at The Conference Board, and Andrew Jones, Principal Researcher, Governance & Sustainability Center at The Conference Board.
This report examines how board director compensation practices across US public companies have evolved in 2025, drawing on comprehensive longitudinal data to assess levels, structures, mix, and emerging trends across the Russell 3000 and S&P 500.
Trusted Insights for What’s Ahead
- Director pay has largely leveled off, rising just 2% in the Russell 3000 and remaining flat in the S&P 500, reflecting a mature and disciplined compensation model with medians clustered near $250,000.
- Shareholder-approved limits have become a core governance safeguard, now adopted by roughly three-quarters of companies in both indexes, with a typical $750,000 cap that signals tighter oversight and growing investor scrutiny.
- Director core pay elements have largely settled into a stable pattern, with cash retainers flat at $75,000 (Russell 3000) and $105,000 (S&P 500), stock awards holding at $150,000 and $190,000, and only minor variation in option values.
- Companies have converged on a streamlined retainer-only structure, used by about 90% of firms as meeting fees continue to decline in prevalence and value, reinforcing a shift toward simpler and more predictable pay designs even as director responsibilities expand.
- Director perquisites remain modest and highly concentrated, with travel reimbursement still the only widespread benefit (above 50% in both indexes) and most other perks—such as education support or charitable-match programs—concentrated among larger S&P 500 companies.
Board director compensation—the structure and mix of how US public companies pay independent directors for their time, expertise, and oversight—is disclosed each year in proxy statements, typically within or adjacent to the “Director Compensation” section of the Compensation Discussion & Analysis (CD&A). US Securities and Exchange Commission rules require companies to present a clear table of all pay elements—cash retainers, committee chair fees, equity awards with grant-date values, and any perquisites—along with footnotes explaining valuation assumptions and nonstandard arrangements.
Introduction: Boards and Director Compensation in 2025
Director pay disclosed in 2025 proxy filings reflects compensation earned for fiscal year 2024— a year of heightened regulatory pressure, sharper investor scrutiny, and expanding board accountability across areas such as AI, climate, human capital, and geopolitical risk. In this context, director compensation remained stable, while the governance parameters surrounding it tightened. More companies adopted shareholder-approved limits on director compensation, moved toward straightforward retainer-plus-equity structures, and aligned with proxy advisor guidance that discourages performance-based awards and highlights outlier pay levels. Overall, expectations are evolving toward greater transparency and investor alignment amid expanding oversight demands.
Director Total Compensation Trends
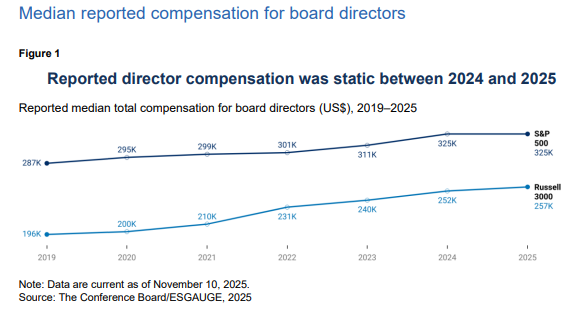
Although director time commitment and board oversight responsibilities have expanded, reported director pay remained essentially unchanged between 2024 and 2025, continuing a multiyear pattern of incremental movement rather than substantive adjustment. In 2025, median reported total compensation in the Russell 3000 rose slightly from $252,000 to $257,000 (up 2%), while the S&P 500 held steady at roughly $325,000. Over the longer term, both indexes show moderate growth—11% in the Russell 3000 and 8% in the S&P 500 over the past three years, and 31% and 13%, respectively, since 2019.
This stability reflects the maturity of current director pay structures. Most companies anchor director compensation on a fixed annual cash retainer paired with a fixed-value equity award, producing limited year-to-year volatility. Equity grant-date valuations in 2025 were broadly similar to those in 2024, and boards generally maintained cost discipline despite rising time commitments and oversight demands.
Differences between the two major indexes remain modest—a multiple of only 1.3. By contrast, the differential for CEO compensation is nearly double that, at 2.5 times ($16.5 million in the S&P 500 versus $6.7 million in the Russell 3000). The relatively narrow gap for director pay is shaped by governance considerations, investor expectations, and increasingly common shareholder-approved limits on annual director compensation.
Sector-specific trends in director total compensation
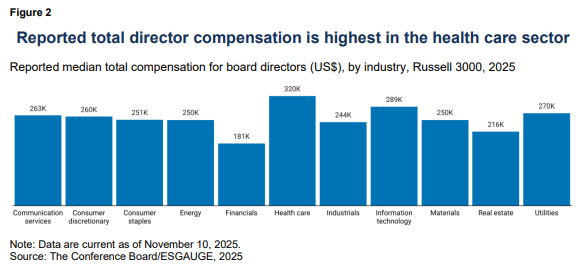
Across most industries, median director total compensation clusters around $250,000, but two sectors notably diverge. Health care boards pay a median above $320,000, while financial firms pay just over $180,000, despite similarly large sample sizes of more than 450 companies each. The lower figure in financials likely reflects the prevalence of smaller regional banks, insurers, and specialty finance firms that maintain more conservative compensation structures.
By contrast, elevated pay in health care may suggest intense competition for directors with specialized scientific, regulatory, and clinical-development expertise. Boards in pharmaceuticals, biotechnology, and medical technology face complex oversight demands and a relatively narrow talent pool, driving higher compensation.
Shareholder-approved limits on annual director compensation
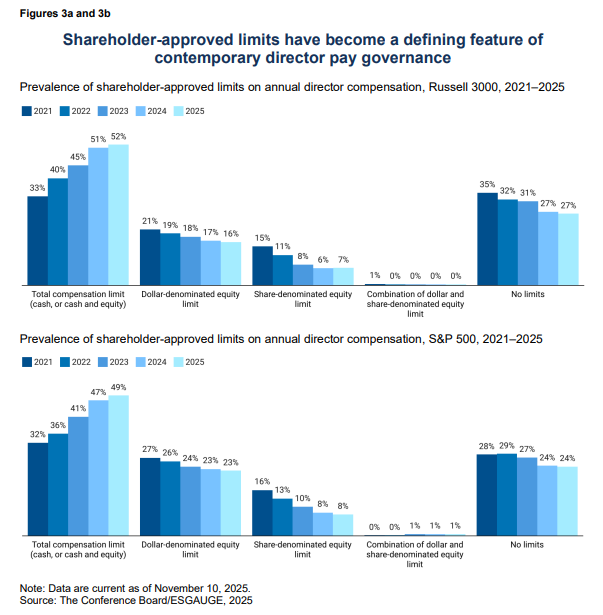
In 2025, the median limit across both the Russell 3000 and S&P 500 stood at $750,000, with about three-quarters of companies in both indexes adopting some form of limit. Just over half of Russell 3000 companies (52%) now impose an overall limit—up from only 33% in 2021—while reliance on more technical cap structures has declined. Dollar-denominated equity caps fell to 16% of companies and share-based limits to 7% in 2025. Meanwhile, the share of firms disclosing no limits has dropped from nearly 35% in 2021 to 27%. This shift reflects heightened investor scrutiny and a desire to mitigate litigation risks related to perceived “excessive” director pay.
Investors increasingly view shareholder-approved caps as a standard governance safeguard that helps boards demonstrate restraint and reduces their exposure to derivative suits alleging conflicts of interest when directors approve their own compensation. The normalization of these caps reflects a governance system that increasingly constrains rather than expands discretion. These limits are also part of a longer arc of governance evolution, in which boards use formal mechanisms to limit their own discretion and reinforce accountability.
Proxy Advisor Expectations on Director Pay
In 2025, both major proxy advisors reinforced expectations that director pay remain restrained, transparent, and justified. Their frameworks continue to shape market norms and illustrate why director compensation has stabilized even as responsibilities expand.
Glass Lewis expects nonemployee director pay to be clearly linked to time commitment and oversight responsibilities. Their policy discourages performance-based equity, arguing it risks compromising independence; favors simple fixed-value equity and cash retainers; and expects that any atypical adjustments or one-off awards be fully disclosed and explained.
ISS benchmarks pay against industry peers and expects explicit justification when levels exceed norms or rely on complex equity designs. It continues to flag excessive nonemployee director pay and may recommend voting against compensation committee members where outlier pay persists without clear rationale. Its 2025 guidance signals faster triggers, moving from multiyear to single-year assessments in egregious situations.
Major institutional investors echo these governance expectations. BlackRock’s 2025 Voting Guidelines emphasize that director compensation should attract and retain directors while aligning their interests with shareholders’, with a preference for long-term equity components. Vanguard’s 2025 Proxy Voting Policy evaluates nonemployee director equity compensation plans on a case-by-case basis, considering potential dilution, plan size relative to employee programs, and overall pay versus market levels. They will generally vote against plans that allow repricing, contain evergreen features, or include pensions.
Director Compensation Element Trends
Compensation elements and mix
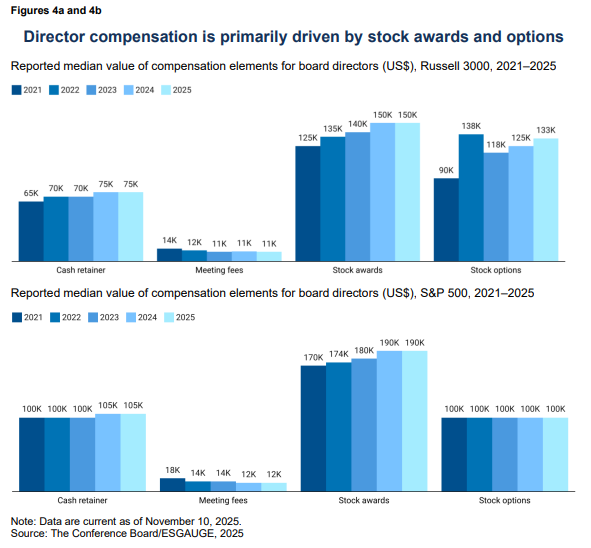
The flat year-over-year trend in total director compensation is mirrored by limited movement in underlying pay elements. Median cash retainers have been stable for several years and are unchanged from 2024 at $75,000 in the Russell 3000 and $105,000 in the S&P 500. Meeting fee medians are similarly flat year-over-year at $11,000 and $12,000, respectively. Stock awards, the dominant component of director pay, have also plateaued at $150,000 in the Russell 3000 and $190,000 in the S&P 500. Stock option values exhibit modest year-to-year variation but remain stable at the median. Overall, companies are adjusting individual elements selectively rather than undertaking broader pay recalibrations, resulting in a mature, largely uniform compensation structure despite rising board workloads.
Board chair premiums also edged down slightly in 2025—from $61,125 to $61,000 in the Russell 3000 and from $120,000 to $116,250 in the S&P 500—likely reflecting changes in the number of firms reporting chair-specific fees rather than meaningful shifts in market practice.
Trends in stock options
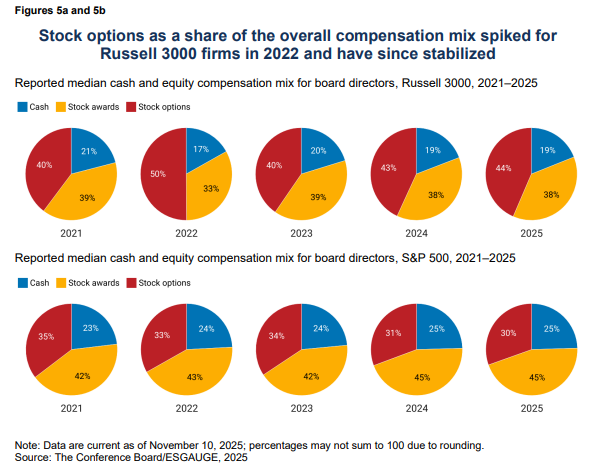
Stock option use for US public company directors has not followed the same downward trajectory seen in executive pay. Instead, it is highly sensitive to company size, governance norms, and market conditions. In the Russell 3000, options represented 39.7% of the compensation mix in 2021, spiked sharply to 50.1% in 2022, and then normalized to 40.4% in 2023 and 43.5% in 2025.
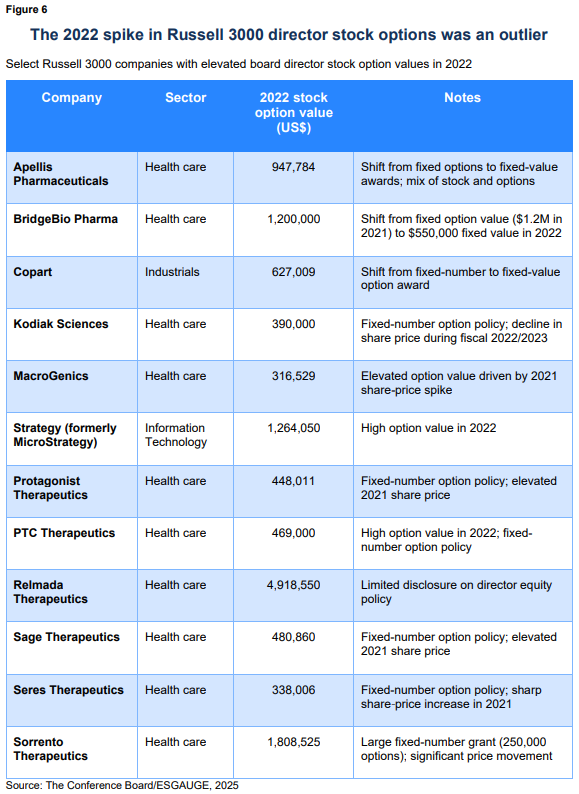
The 2022 surge for the Russell 3000 reflected a mix of factors: smaller and mid-cap companies’ greater reliance on low-cash-cost equity, depressed share prices in 2020–2021 that made option awards more attractive, and index-composition effects as option-heavy firms entered the universe. The median value of stock options in the Russell 3000 also increased during this period, from $90,000 to almost $137,000, before falling back down to $116,500. The table below highlights a set of firms that reported exceptionally high stock option values in 2022.
Since the 2022 spike, companies have moderated their use of stock options and continued expanding the use of fixed-value equity structures, aligning with investor preferences for predictability and transparency.
Trends in cash compensation and meeting fees
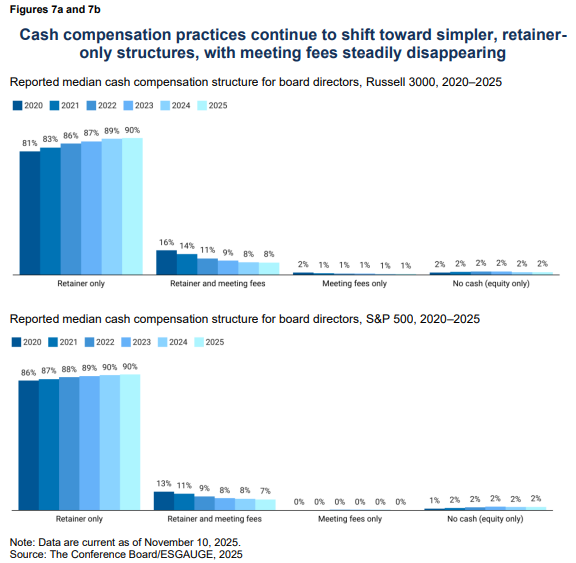
Nine in 10 Russell 3000 companies now rely solely on a cash retainer—up from 81% in 2020— and the S&P 500 shows a similar rise, from 86% to 90%. The traditional combination of retainer plus meeting fees has declined in parallel: from 16% to 8% in the Russell 3000 and from 13% to 7% in the S&P 500. Fewer than 1% of companies in either index relied exclusively on meeting fees in 2025.
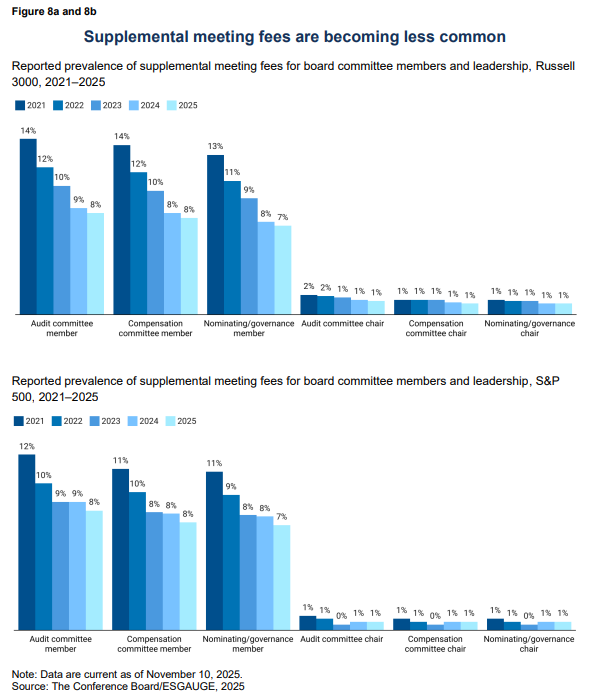
Meeting fees are also declining for committee service, committee leadership, and board leadership positions. In the Russell 3000, supplemental meeting fees for audit and compensation committee service fell from around 14% in 2021 to about 8% in 2025; for nominating/governance committees, the decline was from 13% to 7%. In the S&P 500, usage has also fallen: audit membership fees dropped from 12% to 8% and nominating/governance fees from 11% to 7%.
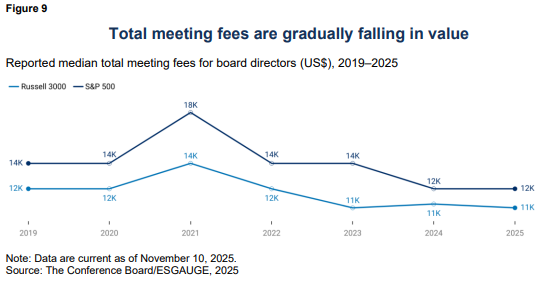
Total meeting fees are falling in value as their use declines. In the Russell 3000, median total meeting fees fell from $12,000 in 2019 to $10,500 in 2025; in the S&P 500, from $14,000 to $12,000. Both indexes show a temporary spike in 2021, when pandemic-related workloads pushed fees to $14,000 in the Russell 3000 and $18,000 in the S&P 500.
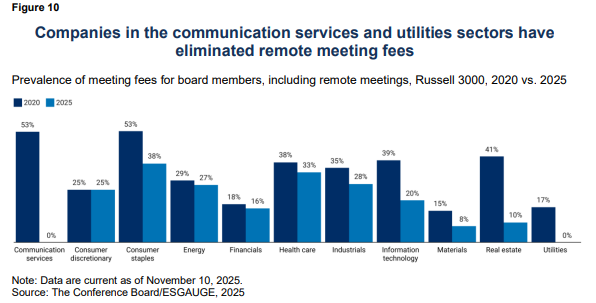
Most companies now pay meeting fees only for in-person meetings, and remote meeting fees continue to decline. In 2020, nearly one-third of companies paid for remote attendance; today, just over one-fifth of Russell 3000 companies and fewer than one-fifth of S&P 500 companies do so. Sector differences are meaningful, with communication services and utilities eliminating remote meeting fees entirely.
The continued decline in meeting fees reflects a structural shift toward fixed retainers that decouple compensation from meeting frequency. Fixed retainers, now the predominant model, help prevent unintended pay escalation as meeting frequency increases and reinforce the principle that directors are compensated for overall service rather than attendance. They also avoid perceptions that directors might be financially incentivized to schedule additional meetings. This model simplifies pay administration and aligns with investor and proxy advisor expectations for transparent, workload-neutral pay designs.
Director Perquisite Trends
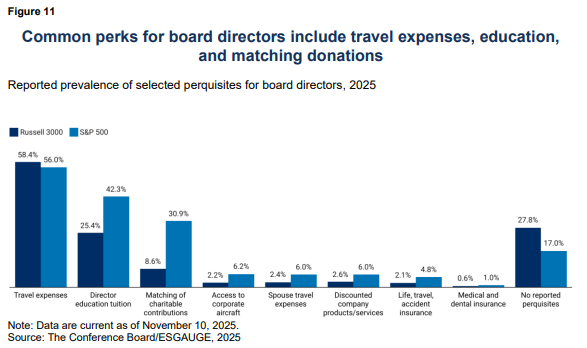
The provision of perquisites (“perks”) to board directors—supplemental, noncash benefits provided in addition to standard retainers and equity awards—continues to be modest and shows little movement year-to-year. Across both the Russell 3000 and the S&P 500, travel expense reimbursement is by far the most common benefit, with prevalence consistently above 55% in both indexes and largely stable over time. Companies typically reimburse travel for attending board and committee meetings, but few disclose the actual reimbursement amount.
Larger companies continue to offer a broader suite of benefits, likely reflecting both greater resources and stronger expectations around director development and governance infrastructure. Director education tuition is reimbursed by only about one-quarter of Russell 3000 companies in 2025 (25.4%), compared to more than two-fifths of S&P 500 companies (42.3%). Matching charitable contributions remains uncommon in the Russell 3000 (8.5% in 2025) but has become more prevalent in the S&P 500, where over 30% of companies offer this benefit. Despite the difference in prevalence, the median matching amount is the same in both indexes—$10,000—and has held steady since 2019.
Other perks—such as spouse travel reimbursement, access to corporate aircraft, medical and dental insurance, or discounts on company products—remain minimal in both groups and show no meaningful upward trend. Notably, no US public companies disclose offering personal or home security benefits to board directors, despite a recent increase in these provisions for CEOs. The compensation landscape has moved decisively toward simplicity (cash retainer plus equity), and the role of supplemental benefits continues to be modest.
Conclusion
Director compensation disclosed in 2025 reflects a mature and stable system. Pay levels continue to rise gradually, but structural change is limited as companies converge on simpler, more uniform models shaped by investor and proxy advisor expectations. The more meaningful evolution lies in the surrounding governance architecture: clearer shareholder-approved limits, fewer supplemental fees and perks, and steadier equity structures that emphasize predictability and alignment. These guardrails also show how boards are increasingly governing their own authority—mitigating litigation risk, signaling restraint, and preserving trust in an area where directors approve their own pay.
Looking ahead, companies should periodically reassess director pay through the lens of expanding governance demands. As responsibilities grow—especially around technology and risk—committees may need to adjust workloads or update retainers and equity values. Any changes should be incremental, well-explained, and aligned with shareholder-approved limits and proxy advisor expectations. Clear disclosure and disciplined decision-making will help boards maintain investor confidence while adapting to the next phase of governance evolution.