 Print
PrintMatteo Tonello is managing director of corporate leadership at the Conference Board. This post is based on an issue of the Conference Board’s Director Notes series by James D.C. Barrall, Alice M. Chung and Julie D. Crisp, attorneys at Latham & Watkins LLP; the full issue, including footnotes, is available for download here.
Why 2012 Was the Year of Pay for Performance
Whether the pay of a company’s CEO and other executive officers is aligned with the company’s performance has been the single most important and controversial executive pay issue for U.S. public companies since the advent of mandatory say-on-pay votes under the Dodd-Frank Act, which applied to most U.S. public companies in 2011; smaller reporting companies will face these votes and issues in 2013. As we wrote in our Director Notes “Proxy Season 2012: The Year of Pay for Performance,” 2012 was indeed the year of “pay for performance.” This has been proven by the over 2,000 say-on-pay vote results reported through September 5, 2012.
The stage for the 2012 pay-for-performance debate was set in 2011, when Institutional Shareholder Services Proxy Advisory Services (ISS), which is widely regarded as the most influential U.S. proxy adviser, applied a crude two-step test to assess pay for performance in making its say-on-pay voting recommendations.
Generally, under its 2011 test, ISS concluded that a pay-for-performance “disconnect” existed if:
- a company’s total shareholder returns (TSR) (stock price appreciation plus deemed reinvestment of any dividends) was below median of the company’s four-digit Global Industry Classification Standard (GICS) industry group in the prior one and three-year periods and
- the CEO’s pay had increased, had stayed the same, or had not been significantly reduced from the previous year.
ISS’s 2011 pay-for-performance voting policy generated substantial blowback from companies and concerns about its efficacy from investors. In response, ISS substantially rewrote its pay-for-performance voting policy and analytics in November 2011 for application in the 2012 proxy season.
Under the 2012 voting policy, ISS analyzed pay-for-performance alignment under three quantitative tests, variously applied to the prior one-, three-, and five-year periods:
1. the relative degree of alignment between a company’s CEO “pay” and its TSR, and those of the company’s “peer group”;
2. the CEO’s “pay” as a multiple of the median “peer group” CEO “pay”; and
3. the absolute alignment of the company’s CEO “pay” and the company’s TSR.
If these three quantitative tests indicated an unsatisfactory pay-for-performance alignment, ISS then applied a qualitative review of factors related to the design of the company’s pay plans to see if its concern was alleviated. During the 2012 proxy season, it is estimated that ISS delivered approximately 82 percent of its negative say-on-pay vote recommendations due to a perceived lack of alignment between a company’s CEO pay and its TSR performance. It appears that, in most cases in which the quantitative tests resulted in a high degree of concern to ISS, the application of its qualitative analysis was not sufficient to overcome ISS’s concerns and ISS recommended against the company’s say-on-pay vote on pay-for-performance grounds.
Although a substantial improvement over the 2011 ISS pay-for-performance voting policy, the 2012 policy was also criticized by companies and their advisers on a number of grounds. First, while ISS revised its peer group analytics, the 2012 policy continued to use GICS categories, which contain broad ranges of companies that often have little in common. ISS’s peer group determinations for benchmarking both the company’s TSR performance and CEO pay resulted in anomalies that were the subject of many company supplemental proxy filings. Second, the 2012 policy continued to use TSR as the sole measure of company “performance,” without regard to many other financial performance metrics that are intended to be driven by pay plans and are important to investors. Third, ISS continued to use proxy statement summary compensation table (SCT) numbers for determining the value of the CEO’s pay during the prior one-, three-, and five-year periods in its three quantitative tests. Fourth, companies also criticized the new policy and its application for being in some cases based on factual errors and timing disconnects, especially for early filers, whose 2011 and prior year compensation and TSR numbers were compared with the 2010 and prior year numbers for peer group members that had not yet filed their 2012 proxy statements.
In an important development in the pay-for-performance debate, Glass Lewis & Co., LLC (Glass Lewis), which is widely regarded as the second most influential U.S. proxy adviser, and Equilar, which provides executive compensation data and analytical services to companies, investors, and compensation consultants, announced in February 2012 that they had formed a new partnership to better compete for proxy advisory business with ISS, largely on pay-for-performance matters.
Under this venture, Glass Lewis began to make pay-for-performance proxy voting recommendations for shareholder meetings held after June 30, 2012, using “market-based” peer groups developed by Equilar. Equilar uses algorithms, not GICS categories, to create peer groups based on publicly disclosed relationships among companies, along with Equilar “realizable pay” data focused on earned and able-to-be realized pay, rather than pay opportunity, as discussed in detail below.
Specifically, Equilar defines “realizable pay” as the sum of an executive’s:
- actual salary;
- discretionary bonus and incentive payouts;
- all other compensation; and
- the intrinsic value of all equity grants made during the prior three-year period, measured at the end of the most recently completed fiscal year.
As described in more detail below, the Equilar analysis focuses on actual payouts of incentive awards (rather than targets or pay opportunity). Notably, realizable pay assumes that executives will cash out the equity awards they hold at the end of the relevant fiscal year and does not take into account actual stock option or stock appreciation rights exercises.
2013: The Prospects for a Sharpened Pay-for-Performance Debate
Given the 2011 and 2012 proxy season buildup, companies, investors, proxy advisers, and compensation consultants will continue to analyze and debate pay-for-performance voting policies and to propound alternatives, and pay for performance will likely again be the most important say-on-pay issue in 2013. The specter of the inevitable adoption of “pay-versus-performance” Securities and Exchange Commission rules and stock exchange listing standards, as required by Section 953(a) of the Dodd-Frank Act, provides additional impetus for companies to focus on pay-for-performance matters. To prepare for the 2013 proxy season, companies should address the two most important pay-for-performance issues: peer group selection and the definition of “pay” used in their pay-for-performance analytics and disclosure.
First, companies should review the peer groups they use to design pay plans and to measure pay alignment with company performance, review the GICS “peer group” that ISS used in its 2012 proxy report, monitor ISS policy updates for 2013 for changes to its peer group definition, and determine which peer group Glass Lewis is likely to use in 2013. Companies should also provide a clear statement in their 2013 proxies about how and why they selected the members of their peer groups, and they should consider including this statement in the executive summary of the compensation discussion and analysis (CD&A) section of the proxy. Providing detailed analysis and disclosure about their peer groups and rationales will make it easier for companies to engage with investors on this issue next proxy season and could obviate the need to file supplemental proxy solicitation materials.
Second, and most importantly, companies must determine how to define and disclose “pay” for pay-for-performance purposes.
The Various Ways to Spell “Pay” in “Pay for Performance”
The greatest concern of many companies and their advisers on the pay-for-performance front has been the way ISS has quantified CEO pay based on “pay opportunity,” as reflected in the SCT, rather than on more appropriate measures for testing alignment to company TSR and other financial performance metrics. The use of SCT pay by ISS in evaluating pay for performance is understandable given the ready availability of those numbers in company proxies. However, using SCT numbers, which reflect the value of equity awards on a grant-date basis based on Black-Scholes equity valuation methods, results in the ultimate pay-for-performance disconnect by comparing values realized by shareholders (which reflect increases or decreases in stock price) but not taking increases or decreases in stock price into account in determining CEO “pay.” The 2012 proxy season revealed the defects of the SCT “pay” definition in determining pay-for-performance alignment, as well as a clear movement toward the use of “realized” or “realizable” pay.
As of September 5, 2012, 110 Russell 3000 companies had filed supplemental proxy statement materials, 103 of which (over 93 percent) disputed proxy adviser negative say-on-pay vote recommendations based on alleged pay-for-performance disconnects. We examined the public proxy disclosures of these 110 Russell 3000 companies and found that 67 companies (approximately 61 percent) objected to the use of the SCT pay definition. Instead, or in addition, these companies used some variation of three alternative pay definitions in their proxy statements or supplemental proxy filings to support their contentions of pay-for-performance alignment. The three alternative compensation definitions generally used are “target pay,” “realized pay,” and “realizable pay.”
We contend that “realizable pay,” which uses a company’s current stock prices and actual or estimated payouts from nonequity long-term incentives to define the actual compensation that executives could have realized— rather than relying on grant-date values that over- or underestimate the value of awards or compensation that will actually be delivered—is likely to prove to be the most accurate and ultimately most popular measure for most companies.
The differences between SCT pay, target pay, realized pay, and realizable pay are explained below, along with examples of how companies employed these various definitions in analyzing and disclosing “pay” in their 2012 proxy statements and supplemental proxy filings.
“Summary Compensation Table” Pay
SCT pay is total compensation as derived from a company’s proxy statement SCT. As required under SEC rules, the SCT shows the compensation of the company’s named executive officers for each of the prior three years and includes each executive’s:
- actual base salary;
- actual short-term and long-term cash incentive plan payments or accruals;
- change in actuarial present value of accumulated benefit or pension plans; and
- grant date values of equity awards and long-term cash incentive plan awards determined on the basis of accounting principles.
Although many companies have used this rudimentary definition of total compensation to compare executive pay with company performance in their proxies, SCT pay contains a mix of realized pay and pay opportunities that make it a poor tool for evaluating whether a company’s executive pay has been aligned with performance over a period of prior years.
First, the use of SCT pay for testing pay for performance has been criticized for its reliance on grant-date accounting values (specifically, grant-date Black-Scholes values) for equity-based compensation. Stock option and stock appreciation right (SAR) exercises and the vesting of stock (or failure of stock to vest) are altogether ignored in the SCT compensation assessment. The SCT includes as pay compensation opportunities that will be realized only if stock appreciates in value (with respect to stock options) or specified performance goals are achieved (with respect to performance awards), which may not happen in the real world, and in some cases may understate the value of executive compensation.
In addition, Black-Scholes valuations of stock options and SARs are based on assumptions regarding stock price volatility, the expected term of the award, and the exercise price of the option or SAR. This approach fails to take into account the effect of stock price movements on the value of the option or SAR and an individual’s pay after the date the option was granted.
The Black-Scholes valuation method is based on retrospective stock price performance: The estimated future value of a stock option or SAR is estimated based solely on historical stock price information, while future stock prices may not be consistent with past performance. Accordingly, there are often significant differences between the estimated grant-date value of the equity awards and the amount the executive actually realizes.
This reliance on Black-Scholes values for equity awards can be misleading. Because ISS has relied exclusively on SCT pay to date when making its “say-on-pay” recommendations, investors are often presented with a distorted view of what a CEO and other executives actually earn. For example, a CEO with a pay opportunity (as disclosed in the SCT) of $25 million in equity awards may realize much lower pay (e.g., $4 million) if the company’s stock value plunges or significantly higher pay if the company’s stock price increases substantially or if the executive exercises or vests in multiple equity awards.
Boards of directors and compensation consultants have widely criticized SCT compensation as providing an inaccurate picture of the compensation taken home by CEOs during the year. The failure of SCT compensation to measure actual payments made to executives and incentive awards granted under annual and long-term incentive plans does not accurately reflect, and its reliance on Black-Scholes values of equity awards often results in an overstatement or underestimation of the value of, executives’ actual or reasonably expected compensation. For all of these reasons, a number of companies have moved away from using SCT pay.
“Target” Pay
“Target pay” has historically been used by compensation consultants and compensation committees in designing total compensation and incentive pay opportunities in an attempt to pay targeted pay for target levels of desired or expected performance. Before the advent of pay-for-performance proxy disclosure requirements, most executive compensation surveys focused on target pay, which was generally viewed as the standard for setting pay opportunities and tying them to future performance. Companies often designed pay plans around “minimum” and “maximum” pay opportunities (as well as target opportunities) based upon the possible attainment of minimum or maximum performance targets, respectively.
While TSR is sometimes used as a performance metric in designing target pay, it is generally not the sole performance metric, and it is often used in combination with other financial metrics, such as growth in revenue, earnings, income, EBITDA, return on capital or return on equity, and, in some cases, nonfinancial performance metrics or judgments. But the critical fact to note is that target pay generally has been used on a prospective basis and not as a “rearview-mirror” device to analyze whether in fact the executive pay was aligned with company performance in prior periods, as is required by pay-for-performance judgments.
Nonetheless, some companies have used target pay in analyzing and disclosing pay-for-performance alignment. It is generally defined to include the amount of an executive’s base salary during the year immediately preceding the date of the proxy filing, the target value of annual cash bonuses and nonequity incentives for that year, the target value of any performance-based cash awards, and the grant-date fair value of long-term equity awards.
Similar to SCT pay, target pay measures pay opportunities with respect to equity awards (e.g., the grant-date value of stock options and other stock-based awards) and disregards actual payments and awards. In proxy statements, companies that disclose target pay, which indicates what the company planned to pay at targeted levels of performance, generally do so in order to compare it with other types of pay measures and demonstrate pay-for-performance alignment.
The main feature that distinguishes target pay from SCT pay is its reliance on target values to assess annual bonuses and nonequity incentives (including performance cash awards), rather than the actual values of such bonuses and incentives (which are used in the SCT pay analysis). For example, Radian Group, Inc. used the “total target compensation” label and defined such compensation as including salary and performance-based incentive target values.
Below are two good examples of 2012 supplemental proxy statements that used target pay to challenge proxy adviser use of SCT pay in their pay-for-performance judgments.
Overseas Shipholding Group, Inc. In its 2012 supplemental proxy statement, Overseas Shipholding Group, Inc. (OSG) illustrated its 2012 performance unit grant design, using a table to illustrate the impact of different stock prices on the actual value to be received compared to the target value of such performance units (Table 1). According to OSG, the table demonstrates “the considerable decrease in the executive’s ‘value received’ should OSG’s stock price decline from the original grant price of $10.09.”
OSG stated that, “the design of this award is both performance- based and provides a retention aspect. Although payment may be earned if stock price declines, those values will be at substantial reductions to the original target value as shown above.” The example in Table 1 is persuasive in demonstrating the performance unit grants’ pay-for-performance relationship, showing that slight decreases in stockholder values lead to more considerable decreases to the performance unit grant value.

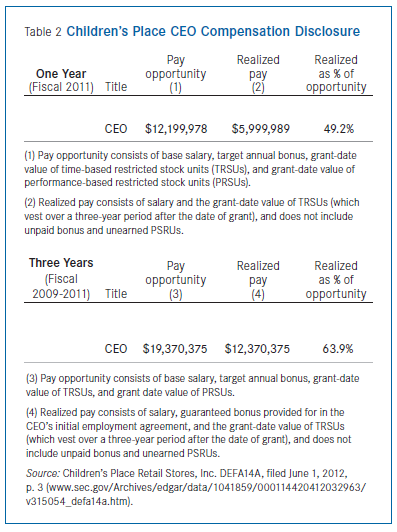
Children’s Place Retail Stores, Inc. In another example of target pay disclosure, Children’s Place Retail Stores, Inc. (Children’s Place) provided a comparison between its CEO “pay opportunity” (i.e., target pay) and “realized pay” for both the one-year and three-year fiscal periods in a 2012 supplemental proxy statement (Table 2).
Limitations of “Target” Pay
As shown by the examples in Tables 1 and 2, because target pay does not take into account the actual realized or realizable pay that an executive receives, it generally serves as a comparison tool; for example, to show the difference between pay opportunity from the view of the compensation committee while setting compensation and the realized pay the executive actually received at the end of the performance period. Target pay is useful to show how a company attempted to incentivize executives by basing future compensation on future performance, allowing executives to realize value when stock price appreciates and other performance targets are achieved; however, target pay generally has the same disadvantages and weaknesses as SCT pay when used retrospectively to analyze pay-for-performance alignment.
For example, relying on Black-Scholes valuations of equity awards links stock price to past performance and does not take into account variations, whether positive or negative, in future stock price. Further, target pay disregards actual payments made under annual and long-term incentive plans. As a result, many consulting firms contend that target pay alone should not be used to measure pay for performance.
“Realized” Pay
Companies have increasingly used “realized pay” (also sometimes called “actual pay,” “earned pay,” or “value received”) in proxy statements and supplemental proxies to analyze their pay-for-performance relationship. In our examination of the disclosure by the 110 Russell 3000 companies that filed supplemental 2012 proxy statements as of September 5, 2012, 46 (or approximately 42 percent) referred to realized pay in some respect.
Realized pay provides a more accurate measure of the value that an executive actually receives or earns than SCT pay or target pay does, since it provides for concurrent comparisons of pay and performance over an extended time. Proponents of realized pay argue that because it represents the amounts an executive actually receives (as opposed to the amounts an executive could or may receive), comparing realized pay values to company financial performance can be used to assess pay and performance more effectively than SCT pay or target pay. Further, the total realized pay disclosed demonstrates when there is a pay and performance “disconnect” and when pay and performance are aligned. For instance, total compensation during periods of strong performance should reveal high cash and equity payouts, while a period of weak performance should show correspondingly weak cash and equity incentive payouts. If pay and performance are not aligned, realized pay may include strong incentive payouts that are not tied to company performance and may not reflect a company’s weak financial performance.
Generally, realized pay includes an executive’s:
- actual, earned cash compensation (actual base salary and actual cash bonuses);
- actual payouts under performance share or performance cash awards; and
- most importantly in comparison with both SCT pay and realizable pay, the value of exercised or taxable equity incentives.
With respect to equity awards, realized pay generally includes the amount of value received by the executive during the relevant period. The realized pay analysis includes equity awards granted prior to the measurement period, provided that they vest or are exercised or earned during the measurement period, while excluding “in progress” (e.g., not yet vested) equity incentive awards. For example, the value of exercised stock options (specifically, the gain recognized above the options’ exercise price) and of shares underlying restricted stock and restricted stock unit awards that vest during the applicable measurement period are taken into account, along with actual payouts of performance share and performance cash awards.
If an executive cashes out his equity awards on the date the awards vest, the cash amount will equal the realized amount; if such awards are held past their vesting dates, the realized amount will be higher or lower depending on whether the applicable stock price increases or decreases following vesting. Because this method of valuing equity awards more closely aligns with actual amounts received by or paid to executives (as opposed to target pay or SCT pay), a number of companies included realized pay analyses in their 2012 proxy filings.
Following are four good examples of 2012 supplemental proxy statements that used realized pay to challenge proxy adviser use of SCT pay in their pay-for-performance judgments.
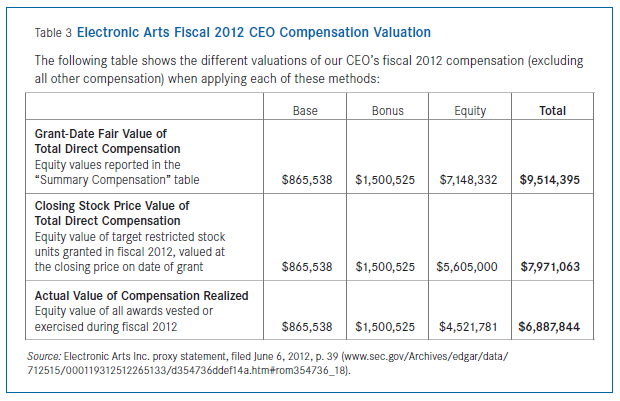
Electronic Arts, Inc. Electronic Arts, Inc. (EA) stated in its 2012 proxy statement that, although it was required to disclose the equity grant-date values in its SCT, it did not believe that such values provided a complete basis for making compensation determinations because such “metrics do not reflect the compensation that was actually received” by each of the named executive officers (NEOs) during fiscal 2012, which “is attributed to base salary paid, bonus awarded, and equity awards that vested or were exercised in fiscal 2012.” EA stated that its committee “also takes into account the actual value received by each NEO from prior awards when determining new awards” because “over longer periods of time, when [EA’s] stock price performance is either above or below expectations, [the] NEOs will realize value from the vesting of equity awards that is above or below [its] targeted levels.” The company illustrated the difference between its CEO’s SCT pay compared to actual value of compensation realized in Table 3.
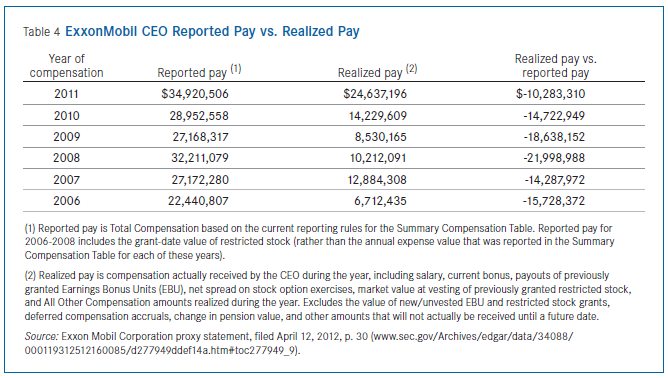
Exxon Mobil Corp. Exxon Mobil Corp. (ExxonMobil) also contended in its 2012 proxy statement that realized pay should be considered in the pay-for-performance analysis because “a substantial portion of the compensation granted by the compensation committee to the CEO and reported in the SCT represents an incentive for future performance, not current cash compensation.” Further, long-term incentive pay “will not actually be received by the CEO for many years in the future, and the value of this pay when realized may differ significantly from the amounts shown in the SCT, depending on how ExxonMobil actually performs.”
ExxonMobil illustrated the foregoing arguments with a table comparing the differences between the SCT pay and realized pay (Table 4).
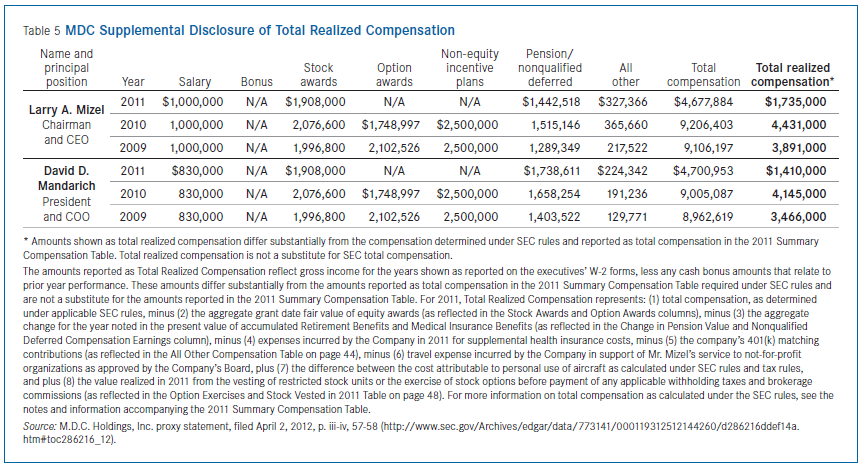
M.D.C. Holdings, Inc. In its 2012 proxy statement, M.D.C. Holdings, Inc. (MDC) noted that the SEC calculation of “total compensation, as shown in the 2011 SCT, included several items that were driven by accounting and actuarial assumptions, which were not necessarily reflective of compensation actually realized by the named executive officers for a particular fiscal year,” and supplied a supplemental table to show the compensation realized by its NEOs (Table 5).
Orion Marine Group, Inc. In another good example, Orion Marine Group, Inc. (Orion) provided both a table and a bar chart in contrasting SCT pay and realized pay (Table 6 and Chart 1).
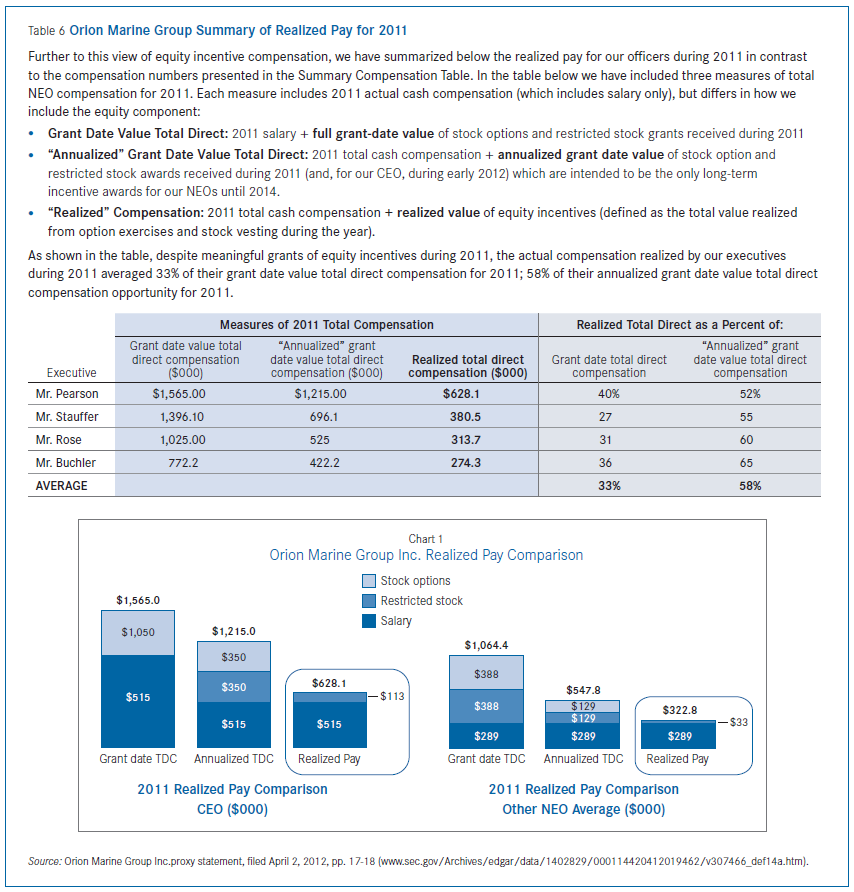 Click to enlarge image
Limitations of “Realized” Pay
Measuring pay on a realized pay basis for the purpose of analyzing pay-for-performance alignment also has its limitations. First, there may be difficulties in comparing companies based on the different ways that companies define and calculate realized pay and the lack of a single, accepted approach to defining realized pay. Second, realized pay may be misleading because it may include the results of volatile fluctuations in compensation based solely on when an executive chooses to exercise his or her vested stock options—which may say more about the executive’s investment decisions with respect to the stock underlying such options than to the alignment of pay with company performance. Further, some companies include all stock options exercised and equity awards vested in their realized pay calculations, leading to inclusion of compensation for equity awards granted prior to the period under consideration. In contrast, because these companies may not include the value of stock options not exercised during the period in question, the realized pay approach may not take into account in-progress incentive awards.
Consider a recent 2012 supplemental proxy statement filed by Yum! Brands, Inc., which argued that its 2011 CEO’s realized compensation from stock options or stock appreciation rights of almost $38 million should not be taken into account in analyzing its pay-for-performance alignment. The inference from including this value could be that “Mr. Novak’s 2011 award may be too high because of what he realized from these option gains.” However, Yum Brands explained persuasively that “these options were granted almost nine years earlier and … in that time the stock price had increased approximately 375 percent and the company’s market capitalization increased by approximately $20 billion. To mix that reference in the discussion of 2011 compensation … is at least confusing and more significantly prejudicial to truly understanding the pay for performance arrangements at Yum.”
“Realizable” Pay
“Realizable pay,” a favorite pay definition among compensation consultants, is at the heart of the Glass Lewis-Equilar pay-for-performance model and has increasingly been used by companies in proxy statements and supplemental proxy filings to analyze pay-for-performance alignment. In 2011, companies such as Target Corp., Microsoft Corp., Nordstrom Inc., Eli Lilly and Co., and Air Products and Chemicals, Inc. filed proxy disclosures that contain pay information based on realizable pay. Many more companies did so in 2012.
Among the 110 Russell 3000 companies that had filed supplemental proxy statements as of September 5, 2012, 26 (or approximately 24 percent) referenced realizable pay in some respect in their proxy statements or supplemental proxy filings.
Companies’ use of realizable pay in their pay-for-performance analytics and proxy disclosure addresses the problems with SCT pay and target pay and takes into account post-grant changes in stock price. Although companies have different ways of calculating realizable pay, it generally reflects actual compensation earned during the applicable measurement period based on the amounts that an executive can realize—that is, compensation is counted at the time it is paid, vests, or is realized. As with SCT pay and realized pay, realizable pay includes an executive’s actual base salary and actual annual bonus (i.e., the values disclosed in the base salary, bonus, and nonequity incentive columns in the SCT). However, realizable pay replaces the grant-date value of equity used in SCT pay with the value of equity that executives may recognize based on actual stock performance as of a specified date.
The key difference between realizable pay and SCT pay is that realizable pay measures the “intrinsic value” of equity awards granted over a multiyear period rather than the accounting or financial statement value (that is, the actual value of stock for stock awards like restricted stock and restricted stock units, and the difference between actual stock prices and exercise prices for stock options and SARs, calculated as of the end of the most recently completed fiscal year), and for nonequity incentive awards, uses actual payouts of awards rather than target payouts. By analyzing equity over multiple years, this approach permits stock performance over time to be reflected in valuing outstanding incentive awards. Equity awards granted during the applicable period are valued at the end of the applicable award period based on the then-current stock price (regardless of when or whether the awards vest).
Proponents of realizable pay assert that it reflects the “real value” of equity awards granted because it measures the value earned during a specified period based on a combination of recently granted equity awards and actual performance results (including actual stock price and company financial performance). The equity component of realizable pay aligns compensation with the company’s stock performance over a span of several years and, as a result, is more responsive to increases and decreases in stock price than SCT pay, which relies solely on past stock performance to determine possible future performance and values.
Further, realizable pay focuses on current stock price rather than grant-date fair values determined at the time equity awards are granted to an executive, which frequently over or underestimate the value of awards granted.
An important difference between realizable pay and realized pay is that the former includes the intrinsic values of equity awards outstanding as of the end of the relevant period, whether or not they are exercised (in the case of options or SARs) or paid or vested (in the case of restricted stock and other full-value equity awards). For example, the value of unexercised stock options and SARs (as measured at the end of the relevant period) whether or not vested generally are included in the definition of realizable pay. This inclusion eliminates the volatile impact on pay of the timing of stock option and SAR exercises and the payment of other equity awards, which may be deferred at the election of the executive. Further, the “realizable pay” analysis looks at the value of such awards based on company performance over an extended time period.
In an Equilar study that compared realizable and target pay of S&P 1500 companies over a three-year period, realizable pay demonstrated greater differences among CEO pay than target pay, making it easier to compare CEO pay across companies. Additionally, most CEOs received less value from performance-based equity awards than the disclosed target amounts, generally due to decreased company performance prior to the executives’ exercise of such awards. However, in some cases, CEOs also earned more than their overall target pay amounts due to an increase in stock price following the grant date and performance above target levels by the company. When performance is less strong than estimated, realizable pay numbers generally will be below target numbers. Thus, realizable pay provides an accurate assessment of executives’ total “take home” pay (taking into account actual values of equity awards and increases or decreases in share price) and enables companies to assess whether compensation is effectively reduced when performance does not meet or exceed expectations.
Below are three good examples of 2012 supplemental proxy statements that used realizable pay to challenge proxy adviser use of SCT pay in their pay-for-performance judgments.
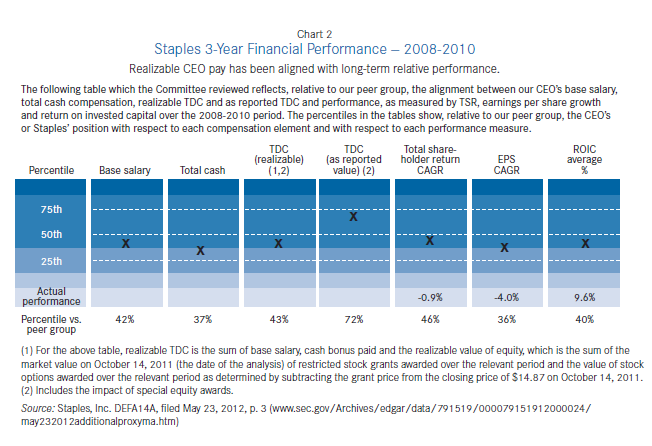
Staples, Inc. In a supplemental proxy statement filed in 2012, Staples, Inc. (Staples) stated that its compensation committee “placed the greatest emphasis on realizable total direct compensation (TDC), as opposed to TDC as reported in our summary compensation table, since realizable TDC reflects the real value of equity awards and increases and decreases as the share price changes.” Staples argued that the greater the percentage of the CEO’s compensation “at risk,” the more important it is for the compensation committee to “concentrate on realizable pay when evaluating pay for performance.” Staples illustrated realizable CEO pay with long-term relative performance with a chart and explanation (Chart 2).
Autodesk, Inc. Autodesk, Inc. (Autodesk) also argued in a 2012 supplemental proxy statement that realizable pay was a better metric to measure executive compensation because such pay increases and decreases as the company’s stock price rises and falls. Autodesk illustrated this principle by charting relative performance compared to the company-selected peer group with realizable pay of its CEO (Chart 3).
Safeway, Inc. Another advocate of realizable pay was Safeway, Inc. (Safeway). In a 2012 supplemental proxy filing, Safeway argued that “when the compensation of our CEO … is examined on a realizable basis, it is not only considerably lower than his reported compensation, but also appropriately linked to company performance.” In its 2012 proxy filings, Safeway defined realizable pay as the sum of the following numbers: “salary, annual bonus, pension change, other compensation, gains realized on restricted stock or options granted in that year, value of remaining restricted stock and in-the-money options granted in that year, both vested and unvested.” Safeway illustrated its CEO’s realizable pay with a bar graph (Chart 4).
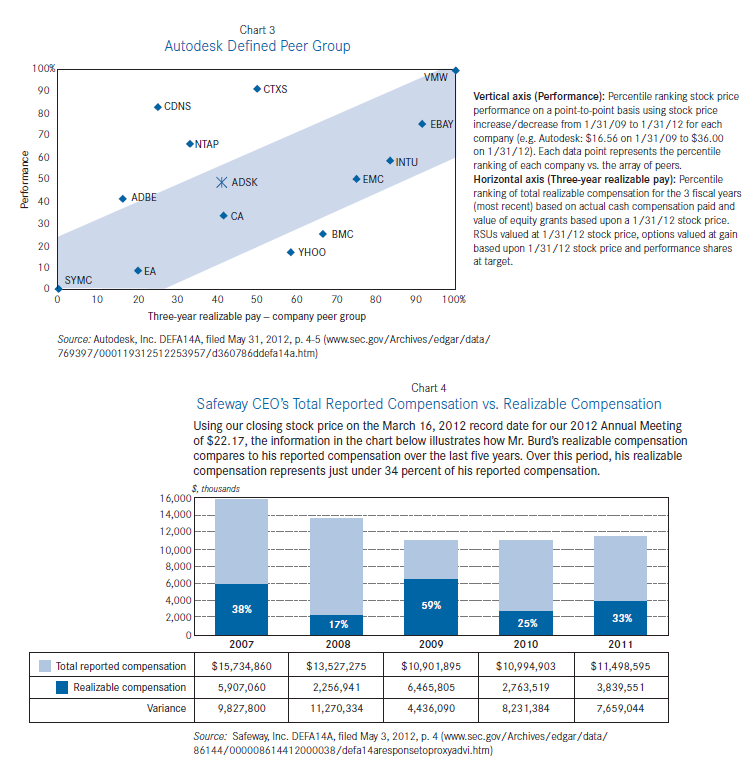
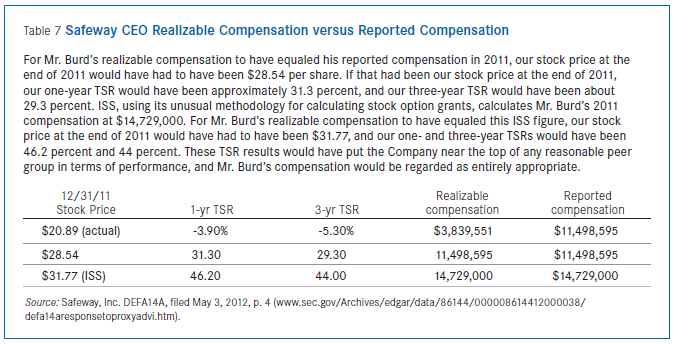
Safeway further argued that its CEO’s realizable compensation aligned with pay for performance with a table and explanation (Table 7).
Limitations of “Realizable” Pay
Independent consulting firm Pay Governance found that more than 10 percent of the companies it surveyed that had a pay-for-performance disconnect under ISS’s guidelines would not have had such disconnects if realizable pay rather than SCT pay had been used to determine pay-for-performance alignment.
However, realizable pay also has its limitations. Like realized pay, there is no one defined or accepted approach to defining realizable pay, and there may be difficulties in comparing companies because of the different ways that companies define and calculate realizable pay. Further, because realizable pay is still a hypothetical measure of pay, it recognizably does not measure actual pay outcomes and does not take into account potential events—for example, the forfeiture of compensation that could occur due to the failure to attain certain performance goals. Still, of the various methods of defining “pay” for pay-for-performance alignment purposes, realizable pay appears to hold the most promise for study and use by companies. It is far superior to SCT pay and target pay, which measure pay opportunities and not actual pay, and is superior to realized pay in eliminating the payment timing variables that reflect executive investment decisions more than company performance.
Conclusion
Pay for performance has been at the heart of proxy adviser and investor focus in the 2011 and 2012 proxy seasons as the majority of U.S. public companies have propounded their first mandatory say-on-pay votes under the Dodd-Frank Act. That focus likely will intensify in the upcoming 2013 proxy season, with much attention paid to the definition of “pay” for testing pay-for-performance alignment.
The current manner in which pay is discussed and analyzed by ISS, members of the media, and some companies is derived from the summary compensation table. However, SCT pay is a poor tool for evaluating pay-for-performance alignment on a retrospective basis due to its inherent disconnects in mixing realized pay with pay opportunities. Due to these disconnects, companies and their advisers have begun to move away from SCT pay and toward realized pay and realizable pay analysis and disclosure. While realized pay may be the most accurate measure of how much compensation executives received under cash-based accounting notions, we assert that realizable pay is likely to be the best measure for most companies. It is better than SCT pay or target pay in pay-for-performance analytics because it takes into account post-grant changes in stock price and generally reflects actual compensation earned during the relevant measurement period, coupled with the actual or estimated payouts from nonequity long-term incentives and the value of equity that an executive may recognize based on actual stock performance. However, unlike realized pay, realizable pay excludes compensation realized from equity awards that are cashed out during a measurement period but granted outside the period being tested because such realized amounts are dependent on an executive’s investment decision to exercise options or SARs or be paid full value equity awards that may have been granted in the distant past.
The delay by the SEC in issuing Dodd-Frank mandated rules on pay versus performance has provided an opportunity for say-on-pay vote outcomes to sharpen and refine pay-for-performance analytics and disclosure, as companies, compensation consultants, investors, and proxy advisers have debated the various approaches. We look forward to further debate and expect more companies to move to realizable pay methodologies and to eventually reach a consensus on the definition of “realizable pay.” The SEC should continue to study developments in the marketplace and should take those developments into account in its adoption of pay-versus-performance rules to give companies flexibility to analyze and disclose pay-for-performance alignment in ways that make the most sense for them and their investors.