 Print
PrintBarbara Novick is Vice Chairman at BlackRock, Inc. This post is based on a Policy Spotlight issued by Blackrock.
Index funds have democratized access to diversified investment for millions of savers, who are investing for long-term goals, like retirement. As index funds are currently growing more quickly than actively managed funds, some critics have expressed concern about increasing concentration of public company ownership in the hands of index fund managers. While it is true that assets under management (or “AUM”) in index portfolios have grown, index funds and ETFs represent less than 10% of global equity assets. [1] Further, equity investors, and hence public company shareholders, are dispersed across a diverse range of asset owners and asset managers.
As of year-end 2017, Vanguard, BlackRock, and State Street manage $3.5 trillion, $3.3 trillion, and $1.8 trillion in global equity assets, respectively. [2] These investors represent a minority position in the $83 trillion global equity market. As shown in Exhibit 1, the combined AUM of these three managers represents just over 10% of global equity assets. The largest 20 asset managers only account for 22%. Moreover, about two-thirds of all global equity investment is conducted by asset owners choosing to invest in equities directly rather than by employing an asset manager to make investments on their behalf.
Exhibit 1: Equity Market Investors [3]
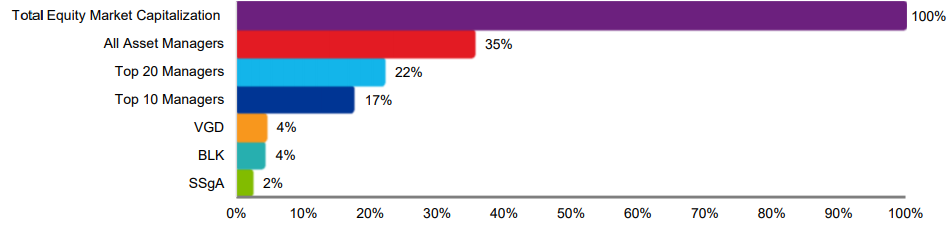
Exhibit 1 alone does not paint a complete picture of the diversity of equity market investors, as there is significant variation amongst asset managers and asset owners. Further, for any individual asset manager, AUM represents a variety of investment strategies, each with different investment objectives, constraints, and time horizons. For example, BlackRock has more than 50 equity portfolio management teams managing nearly 2,000 equity portfolios. These portfolios range from index strategies to actively managed products, across geographies, sectors, and market capitalization. In addition, multi-asset class portfolios, like target date funds, invest in equities as well as other asset classes. Finally, there is often some variation in the way shares are voted across portfolios, even among those managed by a single asset manager. This is due to a variety of reasons including the fact that some clients vote their own shares even though their assets are managed by an asset manager. Approximately one-quarter of equity separate account clients do not delegate voting authority to BlackRock.
The different objectives of each type of investor, which translate into different financial incentives and investment strategies, are often missing from the discussion. These differences are essential to understanding the investment behaviors of shareholders. Following are some examples of types of equity market investors.
Institutional Asset Owners
The majority of equity assets are managed directly by asset owners. Examples of asset owners include pension plans, sovereign wealth funds (SWFs), and insurance companies, the largest of which are shown in Exhibit 2. [4]
- Pension Plans include plans sponsored by public entities or by companies. They can be defined benefit (DB) or defined contribution (DC). DB pension plans offer a payout upon retirement based on a pre-determined formula, and thus have long-dated obligations to make future payments to plan participants. DB plans thus seek to match their assets with their liabilities. On the other hand, DC pension plans place the obligation to select investments on the plan participant and do not offer a defined future payout. Due to their long time horizon and the importance of pension assets to individuals’ financial security, DC pension plans generally offer a suite of diversified investment options to participants. DC plan participants are increasingly investing in multi-asset portfolios, a trend that reflects the benefit of diversification over long time horizons. While there is variation across pension plans, equities comprise an average of 46% of pension plans’ assets [5]
- Sovereign Wealth Funds (SWFs) are pools of assets invested on behalf of sovereign nations generally to benefit a country’s citizens by diversifying the country’s sources of wealth or pursuing development SWFs have varying charters and thus bespoke investment portfolios. On average, equities make up 44% of SWF’s assets. [6]
- Insurance companies include property and casualty, health, life, and monoline insurers as well as reinsurers. Insurance companies seek to earn a return on investment that exceeds their liabilities while complying with regulatory, accounting, and tax requirements. Insurers tend to be more heavily weighted towards fixed income, with equities constituting closer to 10% of their assets. [7]
Exhibit 2: Largest Asset Owners by Type—Total Assets
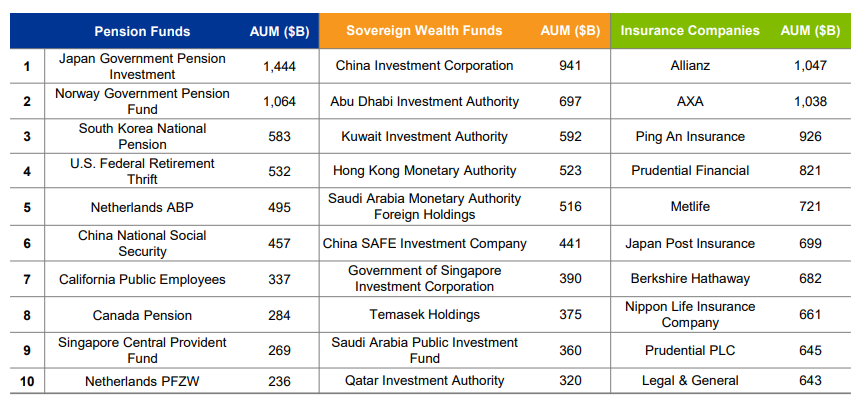
Sources: Pension Funds: Willis Towers Watson / Thinking Ahead Institute, Pensions & Investments World 300; as of year-end 2017. Sovereign Wealth Funds: Sovereign Wealth Fund Institute; as of February 2019. Sovereign wealth fund rankings exclude sovereign pension funds, which are included in pension fund rankings. Insurance Companies: Relbanks, World’s Top Insurance Companies; as of September 30, 2017.
Traditional Asset Managers
Traditional asset managers manage assets primarily on behalf of the world’s pensioners and savers (including institutions like pension plans and individual investors), who are seeking risk-adjusted returns over long time horizons to meet their investment objectives (e.g., saving for retirement). Many traditional asset managers offer investment strategies that are diversified across markets, asset classes, and/or sectors, as broad diversification reduces portfolio volatility and mitigates exposure to the fortunes or failures of any single investment. The primary focus of traditional asset managers’ investment stewardship engagement with companies flows from the fact that asset managers are fiduciaries on behalf of long-term investors. Their engagement is generally focused on corporate governance matters that promote long-term performance and protect shareholder rights. As a general matter, traditional asset managers engage with companies and vote proxies; however, they do not seek board seats, nor do they initiate proxy fights or shareholder proposals. Further, asset managers’ voting records demonstrate variation in voting patterns (see the Policy Spotlight, Proxy Voting Outcomes: By the Numbers). [8]
In recent years, regulation and market developments have encouraged price competition amongst traditional asset managers, leading to lower fees. Since 2009, average annual expenses on equity mutual funds domiciled in the US have dropped by almost one-third, with many equity index strategies being offered for single-digit basis points. [9] While lower fees mean more money in the pockets of retirees and savers, this trend places greater importance on economies of scale. As a result, as shown in Exhibit 3, 24 traditional asset managers now manage equity assets of more than $275 billion.
Exhibit 3: Largest Asset Managers by Equity AUM
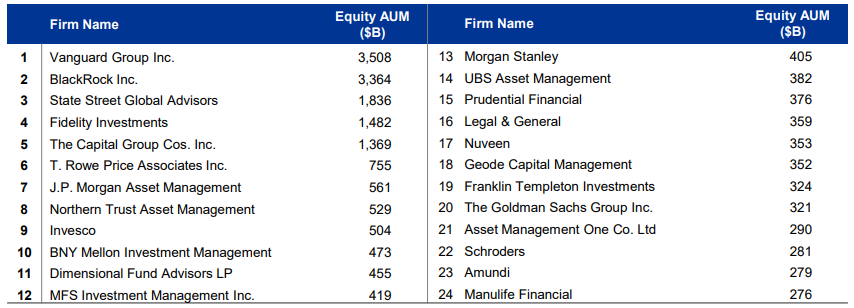
Source: Pensions & Investments (P&I). All data as of December 31, 2017.Updated May 2018.
Activist Investors
Activist investors are primarily private fund managers whose strategy is to take a position in a company and then vigorously advocate for changes to corporate strategy and often structure, as well as to the board of directors. Their investment strategies are significantly more concentrated in individual companies than broadly diversified strategies. Many activist investors offer funds to third party investors; the value proposition of these funds is their ability to influence the strategic direction of a company to increase value. In contrast to traditional asset managers, activist investors often seek board seats and solicit or agitate for changes in corporate strategy or structure in line with their investment strategy and portfolio concentration. Exhibit 4 lists some of the largest activist investors in the US.
Exhibit 4: “Activist” Investors & Other Investors Who Take Concentrated Stakes and Board Seats
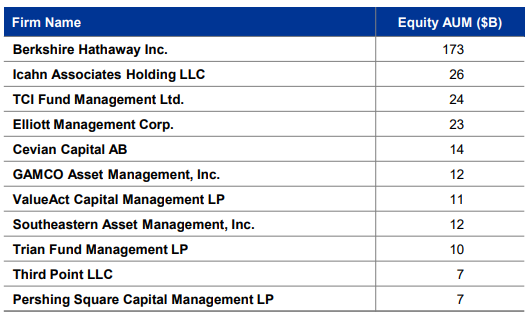
Source: Berkshire Hathaway Inc., 2018 Annual Report. Data as of December 31, 2018; Sharkwatch 50 as of March 26, 2019.
Bottom line:
While the equity assets managed by the world’s largest index managers are sizeable, the largest three index fund managers represent less than 5% each, and in aggregate manage just over 10% of total global equity market capitalization. The other 90% of equity assets are dispersed across a diverse range of investors—including in-house asset managers, independent asset managers, activist investors, and individuals. These investors have different investment objectives and strategies.
Endnotes
1BlackRock, ViewPoint: Index Investing Supports Vibrant Capital Markets (Oct. 2017). Available at https://www.blackrock.com/corporate/literature/whitepaper/viewpoint-index-investing-supports-vibrant-capital-markets-oct-2017.pdf.(go back)
2Pensions & Investments (data as of Dec. 31, 2017). (go back)
3Source: Asset managers’ AUM: Pensions & Investments (data as of Dec. 31, 2017); Total Equity Market Capitalization: World Federation of Exchange Database, BIS (data as of Q2 2017), HFR, Cerulli, Simfund (data as of Nov 2017), iShares GBI (data as of Nov 2017), Global Heat Map, McKinsey Cube (data as of December 2016). P&I data is self reported and may not be comprehensive of all managers everywhere. Total equity market capitalization data includes institutional and hedge fund figures sourced from McKinsey Cube data as of the previous year due to data availability(go back)
4For more on the different types of asset owners and their objectives and constraints, see BlackRock, ViewPoint, Who Owns the Assets? Developing a Better Understanding of the Flow of Assets and the Implications for Financial Regulation (May 2014), available at https://www.blackrock.com/corporate/literature/whitepaper/viewpoint-who-owns-the-assets-may-2014.pdf.(go back)
5Global estimates across defined benefit and defined contribution plans as of 2017. See Willis Towers Watson / Thinking Ahead Institute, Pensions & Investments World 300, available at https://www.thinkingaheadinstitute.org/en/Library/Public/Research-and-Ideas/2018/09/P_I_300_2018_research_paper; and PwC, The rising attractiveness of alternative asset classes for Sovereign Wealth Funds (Jan. 2018), available at https://preview.thenewsmarket.com/Previews/PWC/DocumentAssets/498560.pdf.(go back)
6As of 2016 based on PwC Market Research Centre data. See PwC, The rising attractiveness of alternative asset classes for Sovereign Wealth Funds (Jan. 2018), available athttps://preview.thenewsmarket.com/Previews/PWC/DocumentAssets/498560.pdf.(go back)
7As of 2017 based on OECD data. See PwC, The rising attractiveness of alternative asset classes for Sovereign Wealth Funds (Jan. 2018), available at https://preview.thenewsmarket.com/Previews/PWC/DocumentAssets/498560.pdf.(go back)
8BlackRock, ViewPoint, The Investment Stewardship Ecosystem (July 2018). Available at https://www.blackrock.com/corporate/literature/whitepaper/viewpoint-investment-stewardship-ecosystem-july-2018.pdf.(go back)
9Tim McLaughlin, “Investors Save Billions as Funds Cut Fees, Fight for Market Share”, available at https://www.reuters.com/article/us-funds-fees-outlook-analysis/investors-save-billions-as-funds-cut-fees-fight-for-market-share-idUSKCN1MD18I. As of October 3,(go back)