 Print
PrintJohn Gould is senior vice president at Cornerstone Research. This post is based on a report from the Stanford Law School Securities Class Action Clearinghouse and Cornerstone Research, available here. For more information, contact Mr. Gould or Alexander Aganin. A report from Cornerstone Research about last year’s class action filings is available here.
Federal securities class action filing activity in the first half of 2012 has decreased compared with 2011. There were 88 filings in the first six months of 2012, down 6 percent from both the first half and second half of 2011. If current trends hold, there will be 176 filings in 2012 by year-end, less than the 1997 to 2011 average of 193 but in line with the 2009 to 2011 average of 177.
The slight decrease in total filings was largely due to a substantial decline in Chinese reverse merger (CRM) and merger and acquisition (M&A) filings. There were five CRM-related filings and seven M&A-related filings in the past six months. Compared with the first half of 2011, CRM filings were down 79 percent and M&A filings were down 67 percent. Compared with the second half of 2011, CRM filings were down 44 percent and M&A filings were down 68 percent. Despite the drop in CRM-related filings, filings against foreign issuers as a percentage of all filings were greater than every year except 2011. The decrease in M&A filings easily exceeds the 15 percent decline in the number of M&A deals in the first half of 2012 compared with the first half of 2011. [1] While the number of nontraditional filings has declined, traditional securities class action filings have increased by 23 percent since the second half of 2011.
At 36 days, the median lag between the class end date and the filing date was longer than the lag observed in recent semiannual periods. This is partly due to the decrease in the number of M&A-related filings, which tend to have a shorter turnaround between the end of the class period and filing.
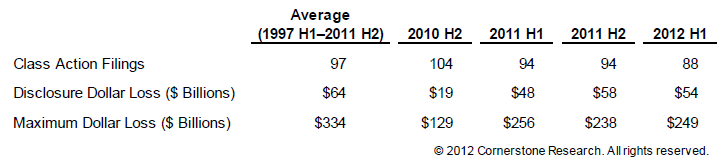
The market capitalization declines in 2012 associated with announcements at the end of the class period were consistent with those in 2011 and remained below historical levels (Figure 1). The total Disclosure Dollar Loss (DDL) of $54 billion in the first six months of 2012 represented a slight decrease from the second half of 2011 and was lower than the 1997 to 2011 historical average of $64 billion. There were two “mega DDL” filings in the first half of 2012 associated with combined end-of-class market capitalization losses exceeding $26 billion. These two filings constituted 49 percent of the DDL Index™ in the first half of 2012. The total Maximum Dollar Loss (MDL) of $249 billion in the first half of 2012 fell between the totals from the first and last six months of 2011. The total in the first half of 2012 was 25 percent below $334 billion, the average MDL observed in the six-month periods between 1997 and 2011. Eight mega MDL filings constituted 65 percent of the MDL Index™ in the first half of 2012, while four mega MDL filings accounted for 76 percent of the MDL Index™ in the second half of 2011. [2]
Figure 1: Class Action Filings Summary Six-Month Periods
Number of Filings
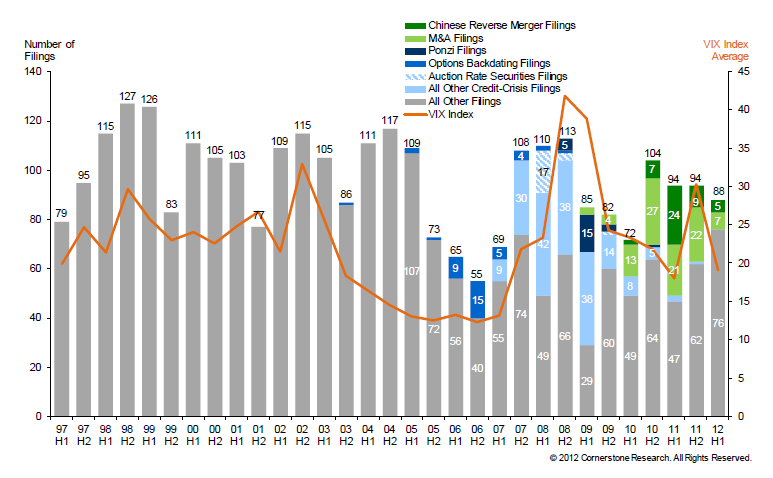
The Class Action Filings Index (CAF Index™) reports 88 filings in the first half of 2012 (Figure 2). Of these, five were related to CRMs and seven were related to M&A deals. The number of filings related to M&A deals has decreased substantially compared with the average of 21 M&A-related filings over the previous four semiannual periods.
The composition of cases filed against Chinese companies has begun to shift in the past six months. The proportion of filings against Chinese companies that were related to CRMs was 57 percent in the second half of 2011 and 42 percent in the first half of 2012. This represents a clear break from the trend between 2009 and 2011, when more than 77 percent of the cases filed against Chinese companies were associated with CRMs. While the total number of filings has declined from 94 filings in the last semiannual period, traditional filings have increased by 23 percent, partially offsetting the decline in nontraditional filings. If the number of traditional filings had been consistent with 2010 or 2011 levels, total filings would have been at their lowest level since 2006.
Figure 2: CAF Index™ Semiannual Number of Class Action Filings 1997–2012 H1
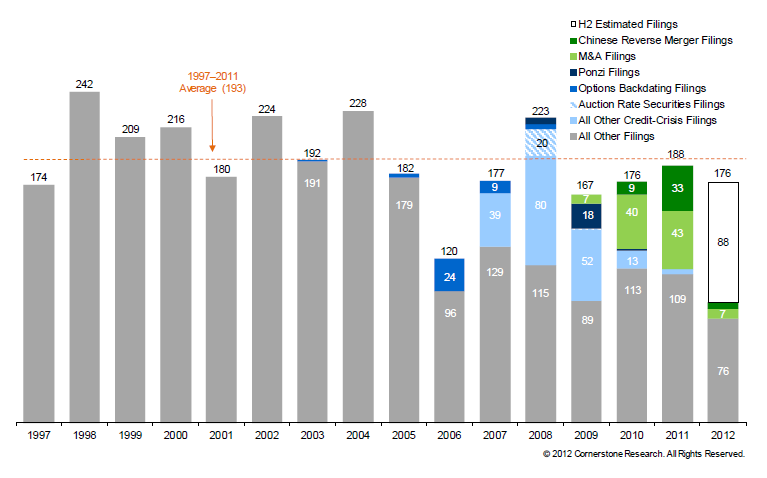
If filings continue at the same pace in the second half of 2012, there will be a total of 176 filings by the end of 2012 (Figure 3). This projection assumes an equal number of filings across all types in the second half of the year. If current filings trends continue, the number of filings in 2012 would be below the historical average of 193 but would be similar to the average of 177 from 2009 to 2011.
Figure 3: CAF Index™ Annual Number of Class Action Filings 1997–2012 H1
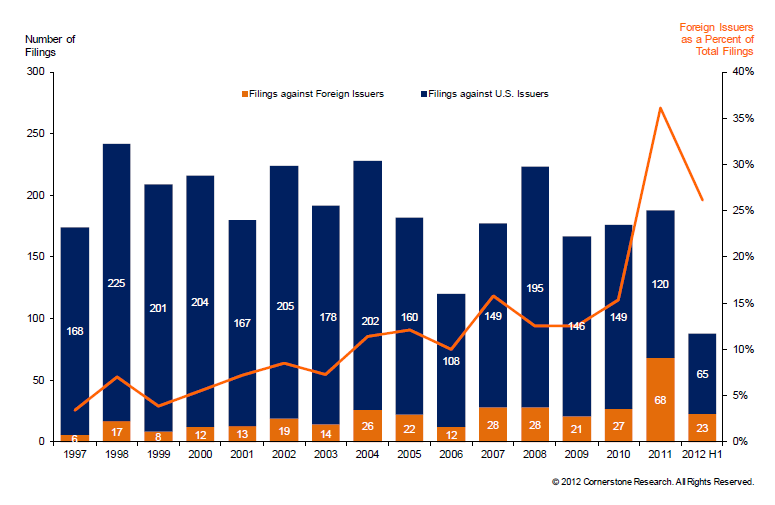
The Class Action Filings-Foreign Index (CAF-F Index™) tracks the number of filings against issuers headquartered outside of the United States relative to total filings (Figure 4). Filings against foreign issuers as a percentage of total filings decreased in the first half of 2012 after a sharp increase in 2011—driven by CRM filings—but remained significantly above historical levels. After rising to 36 percent in 2011, the percentage of total filings against foreign issuers in the first half of 2012 decreased to 26 percent, still well above the average of 14 percent from 2008 to 2010 and 9 percent from 1997 to 2010. While Chinese firms were named in 40 of the 68 filings against foreign issuers in 2011, in the first half of 2012, they accounted for only 12 of the 23 filings against foreign issuers. In the first half of 2012, there were seven filings against Chinese companies that were not related to CRMs, compared with eight such filings in all of 2011. [3] There were 11 filings against non-Chinese foreign firms in the first six months of 2012, the same number as in the first six months of 2011. In all, filings against foreign issuers have decreased from 37 in the first half of 2011, to 31 in second half of 2011, and to 23 in the first half of this year.
Figure 4: CAF-F Index™ Annual Number of Class Action Filings by Location of Headquarters 1997–2012 H1
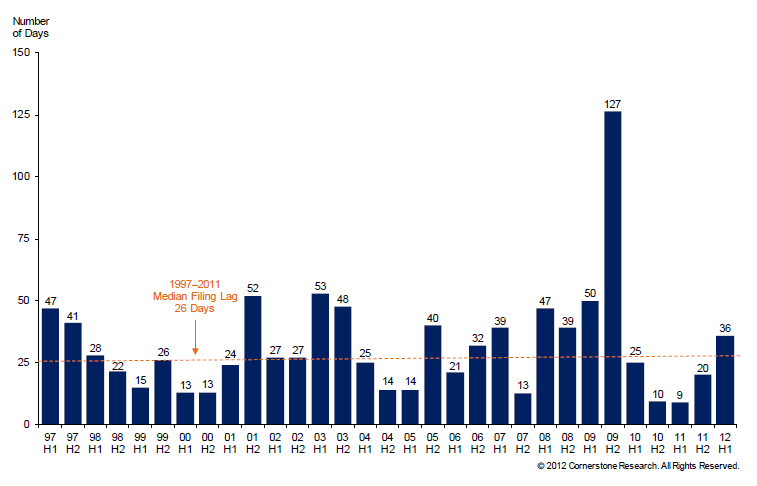
The median filing lag between the end of the class periods and the filing dates increased from 20 days in the last six months of 2011 to 36 days in the first half of 2012, above the historic median lag from 1997 to 2011 (Figure 5). This increase is driven by an increase in filings with a filing lag of more than 50 days. In the first half of 2012, more than 43 percent of all filings had a lag of more than 50 days compared with a quarter of all filings throughout 2011. Historically, roughly 40 percent of all filings have had a lag of more than 50 days since 1997. Consistent with past years, M&A filings tend to have a shorter filing lag compared with other filings. If M&A filings were excluded from this analysis, the median lag would have been 45 days for the first half of 2012 compared with 37 days for the second half of 2011.
Figure 5: Semiannual Median Lag between Class End Date and Filing Date 1997–2012 H1
Heat Maps
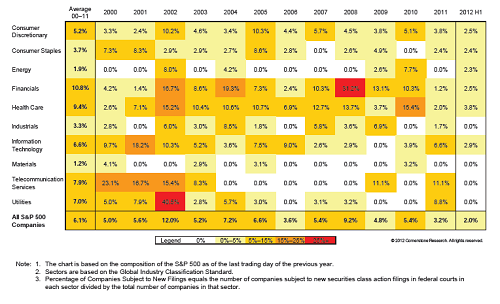
The Heat Maps of S&P 500 Securities Litigation™ facilitate the analysis of securities class action activity by sector. Our analysis focuses on companies in the S&P 500 Index, which represents 500 large, publicly traded companies in all major sectors. Starting with the composition of the S&P 500 Index at the beginning of each year, the Heat Maps examine two factors for each sector. First, what percentage of these companies was subject to new securities class actions in federal court during the year? Second, of the total market capitalization of the companies, what share was accounted for by companies named in new securities class actions?
Out of the 88 filings in the first half of 2012, 10 involved companies in the S&P 500. This is slightly more than during the first half of 2011, when eight S&P 500 companies had been named in new securities class actions. While it is to be expected that the percentage of companies subject to new filings will increase by year-end, the total is projected to be well below the average of 6.1 percent from 2000 to 2011 (Figure 6). [4]
Figure 6: Heat Maps of S&P 500 Securities Litigation™ Percentage of Companies Subject To New Filings 2000–2012 H1
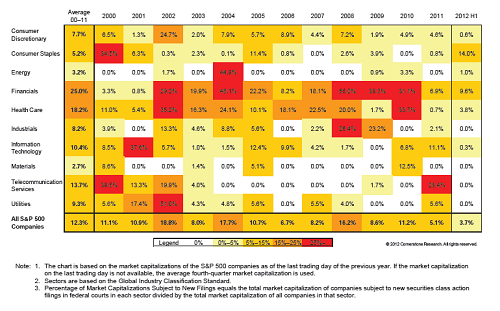
Companies in the S&P 500 subject to new filings in the first half of 2012 constitute 3.7 percent of the overall S&P 500 market capitalization compared with 3.3 percent in the first half of 2011. The percentage of S&P 500 market capitalization subject to new filings is greater than the percentage of S&P 500 companies affected, which implies that the firms named in new filings tended to be larger than the average S&P 500 firm. Financials and Consumer Staples were the two sectors with the largest percentage of affected market capitalization. The increased market capitalization percentage in the Consumer Staples sector was driven entirely by a single class action filed against the largest member of the sector. For the first half of 2012, companies comprising 9.6 percent of the Financials sector’s market capitalization were named in new filings. The Financials sector historically has been more exposed than others to class action securities filings, but filings for this sector remain below the 2000 to 2011 average in terms of both number of filings and market capitalization affected (Figures 6 and 7).
Overall, the level of class actions against S&P 500 companies is projected to be low compared with historical averages, both in terms of the number of companies named as defendants and the percentage of market capitalization represented by the defendants.
Figure 7: Heat Maps of S&P 500 Securities Litigation™ Percentage Of Market Capitalization Subject To New Filings 2000–2012 H1
Market Capitalization Losses
To measure changes in the size of filings, market capitalization losses for defendant firms are measured during and at the end of the class periods. [5] Declines in market capitalization may be driven by market, industry, and firm-specific factors. To the extent that the observed loss reflects factors unrelated to the allegations in the class action complaints, indices based on class period losses would not represent potential defendant exposure in class actions. This is especially relevant for the post-Dura securities litigation environment. [6] This report tracks market capitalization losses at the end of each class period using DDL and market capitalization losses during each class period using MDL.
DDL is the dollar value change in the defendant firm’s market capitalization between the trading day immediately preceding the end of the class period and the trading day immediately following the end of the class period. MDL is the dollar value change in the defendant firm’s market capitalization from the trading day with the highest market capitalization during the class period to the trading day immediately following the end of the class period. MDL and DDL should not be considered indicators of liability or measures of potential damages. Instead, they estimate the impact of all information revealed during or at the end of the class period, including information unrelated to the litigation.
In the first half of 2012, DDL and MDL were consistent with 2011 results (Figures 8 and 9). Both measures remained below historical averages.
Figure 8: Disclosure Dollar Loss Index™ Six-Month Periods 1997–2012 H1
Dollars in Billions
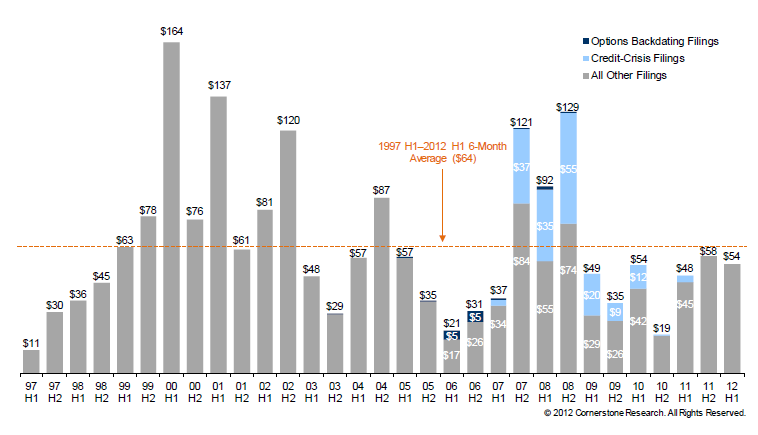
There was a 7 percent decrease in the Disclosure Dollar Loss Index™ (DDL Index) from the second half of 2011 to the first half of 2012. The DDL Index still remains below its historical six-month average of $63 billion but is above the 2009 to 2011 six-month average of $44 billion.
The Maximum Dollar Loss Index™ (MDL Index) for the first half of 2012 has increased by 5 percent since the second half of 2011. The MDL Index remains below historical averages but is in line with the 2009 to 2011 six-month average of $253 billion.
Figure 9: Maximum Dollar Loss Index™ Six-Month Periods 1997–2012 H1
Dollars in Billions
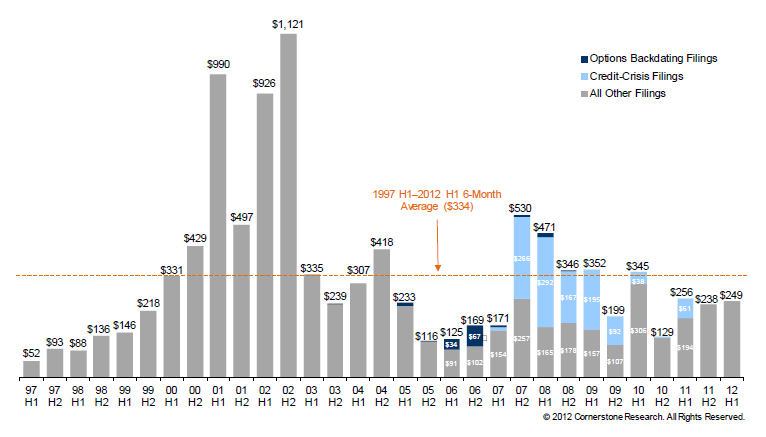
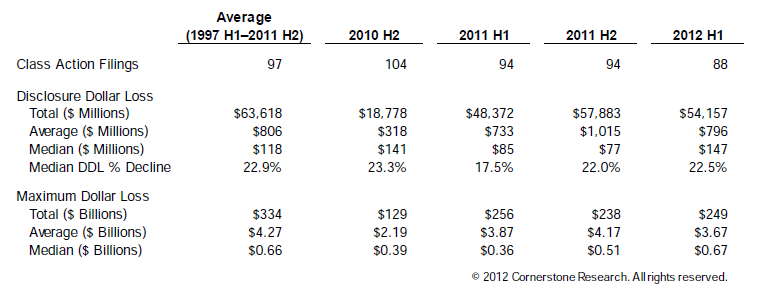
Figure 10 provides summary statistics for filings in the first half of 2012 compared with filings in the six-month periods from the second half of 2010 to 2011 and the semiannual average between 1997 and 2011. The average DDL of $796 million in the first half of 2012 was lower than the average for the second half of 2011 and slightly lower than the average for the 14 years ending December 2011. However, the median DDL in the first half of 2012 was higher than the median DDL in the second half of 2011 and the 14-year average median DDL. Filings in the first half of 2012 had a lower average MDL than either filings in the second half of 2011 or filings over the previous 14 years. Filings had a higher median MDL in the first six months of 2012 than filings in the last three six-month periods. The median MDL of $0.67 billion for the first half of 2012 is 31 percent higher than the median MDL of $0.51 billion in the second half of 2011.
Figure 10: Filings Comparison Six-Month Periods
Mega Filings
An analysis of mega filings, as measured by MDL and DDL, shows that a small number of filings account for the majority of total market capitalization losses associated with class actions. The number of mega DDL filings per six-month periods has remained constant since the beginning of 2011, though the proportion of the total DDL index made up of those filings has varied.
Disclosure Dollar Loss
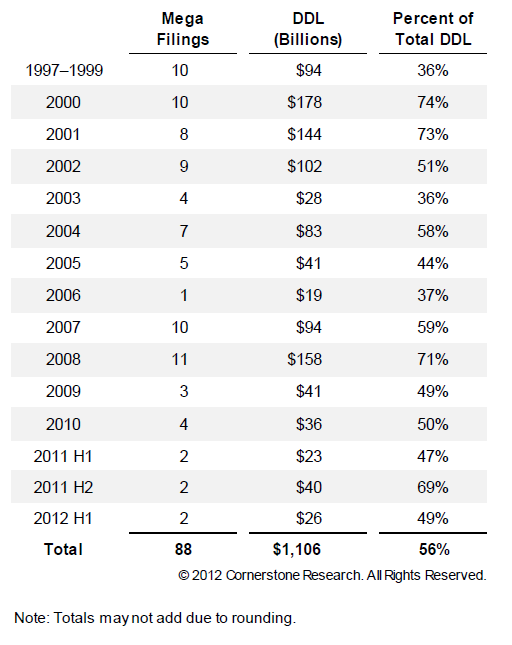
In the first half of 2012, there were two mega DDL filings—filings with a DDL of $5 billion or more. These filings accounted for $26 billion, or 49 percent, of the DDL Index in the first half of 2012, a decrease from 69 percent in the previous six-month period but a slight increase from the first half of 2011. Mega DDL filings represented 56 percent of the total DDL of all filings between 1997 and June 2012 (Figure 11).
Figure 11: Disclosure Dollar Loss Mega Filings (>$5 Billion)
Maximum Dollar Loss
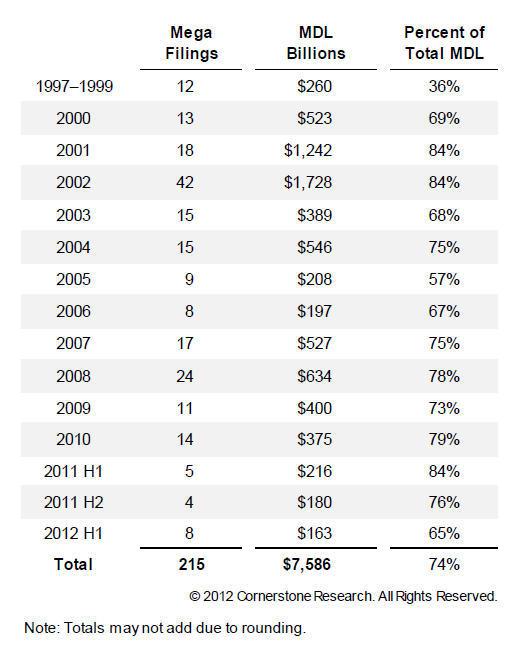
In the first half of 2012, there were eight mega MDL filings—filings with an MDL of $10 billion or more— up from four such filings in the previous six-month period, and only one less than the number of mega MDL filings for all of 2011. Although these eight cases represent the largest number of mega filings since the first half of 2010, they accounted for only 65 percent of the total MDL. Mega filings represented 74 percent of the total MDL of all filings between 1997 and June 2012 (Figure 12).
Figure 12: Maximum Dollar Loss Mega Filings (>$10 Billion)
New Developments
Amgen v. Connecticut Retirement Plans and Trust Funds
On June 11, 2012, the Supreme Court agreed to hear Amgen Inc.’s appeal of a securities class action in which the plaintiffs, led by Connecticut Retirement Plans and Trust Funds, alleged that Amgen misled the market about the safety of two of its drugs, thus artificially inflating the company’s share price. When the Food and Drug Administration raised concerns about the safety of these drugs, Amgen’s share price dropped by 9 percent.
The question before the Supreme Court is the stage at which the plaintiffs must prove that alleged misrepresentations by the company had a material effect on share price. Amgen argues that once the plaintiffs have achieved class certification, the looming risk of a massive judgment may force a company to settle for a large amount, regardless of the merits of the case. If plaintiffs are required to establish materiality before class certification, a company is allowed a chance to defend itself.
The Ninth Circuit ruled in this case that plaintiffs need only plausibly allege materiality at the class certification stage. This is consistent with rulings in similar cases in the Third and Seventh Circuits. However, the Second and Fifth Circuits do require a plaintiff to establish materiality at the class certification stage. When the Supreme Court hears arguments during the upcoming term beginning in October, it will presumably settle the issue, and the result may affect the number of future securities class actions and their outcomes. If the Court rules that materiality must be established at the class certification stage, it may be more difficult for plaintiffs to advance their cases past the class certification stage, potentially resulting in fewer filings and/or more dismissals prior to class certification. If the Court rules the other way, plaintiffs will have an easier path through class certification in those circuits that currently require that plaintiffs prove materiality at the class certification stage.
Dodd-Frank Whistleblower Program
The SEC published its first annual report on the Dodd-Frank Whistleblower Program in November 2011. Based on the November 2011 report, there were 334 whistleblower tips received from August 12, 2011, through September 30, 2011. The most common complaint categories were market manipulation, corporate disclosures and financial statements, and offering fraud. Together, these accounted for more than 47 percent of the tips received. The SEC has not released updated information on the program, but anecdotal evidence suggests that the number of tips received in a single day have increased. In February 2012, at an annual SEC conference, SEC Chairman Mary Shapiro stated that the whistleblower program had provided the agency with “hundreds of higher-quality tips, helping us to avoid investigatory dead-ends ….” [7] Once the November 2012 report is released, it will be possible to observe whether the rate and composition of the whistleblower tips have continued throughout 2012.
Endnotes
[1] Stilwell, Victoria, “Ernst and Young: U.S. M&A activity falling,” Wall Street Journal, July 2, 2012.
(go back)
[2] Disclosure Dollar Loss and Maximum Dollar Loss are defined in the “Market Capitalization Losses” section of this report.
(go back)
[3] There were 33 CRM filings in 2011, but in one case, the company involved was nominally headquartered outside of China. Therefore, out of 40 filings against Chinese issuers in 2011, there were eight not related to CRMs.
(go back)
[4] In Figures 6 and 7, all new filings against the same company have been consolidated so that the totals reflect unique companies.
(go back)
[5] Market capitalization measures are calculated for publicly traded common equity securities, closed-ended mutual funds, and exchange-traded funds only where data are available. MDL and DDL are not calculated for Section 14 M&A cases.
(go back)
[6] In April 2005, the Supreme Court ruled that the plaintiffs in a securities class action are required to plead a causal connection between alleged wrongdoing and subsequent shareholder losses.
(go back)
[7] Carton, Bruce, “Is the SEC’s Whistleblower Program Working?” Compliance Week, April 10, 2012.
(go back)
