 Print
PrintMatteo Tonello is managing director of corporate leadership at the Conference Board. This post is based on an issue of the Conference Board’s Director Notes series by Cory Searcy, associate professor at Ryerson University, and Laurence Clement Roca. This Director Note was based on an article written by Ms. Clement Roca and Mr. Searcy; the full version, including footnotes, is available here.
A growing number of corporations are releasing stand-alone sustainability reports. To provide insight into corporate sustainability performance, many reports contain sets of performance indicators. However, questions remain about what should be reported and the indicators disclosed vary widely. This report presents an analysis of the indicators disclosed in 94 Canadian corporate sustainability reports.
Sustainability policies, plans, programs, and projects have been initiated in corporations around the world. Given the broad nature of sustainability, the breadth and depth of these initiatives varies widely. For example, initiatives as diverse as measuring a corporation’s carbon footprint, fostering diversity in the workplace, and supporting community development could all be classified under the umbrella of sustainability. These initiatives are of interest to a variety of internal and external stakeholders. Depending on the issue, these stakeholders may include employees, investors, customers, suppliers, regulators, nongovernmental organizations, and local communities, to name a few.
One important way corporations share information about their sustainability initiatives is through the release of publicly available reports. Although the titles of these reports differ, they typically include words such as “sustainability,” “responsibility,” “accountability,” or “citizenship,” and they focus on addressing the economic, environmental, and social dimensions of corporate performance through a review of both qualitative and quantitative information. (For the remainder of this issue, the term “sustainability report” is used.)
While few mandatory requirements for sustainability reporting exist, a number of voluntary guidelines for corporate sustainability reporting have emerged to provide corporations with a starting point in the development of their reports. The most prominent of these are the guidelines produced by the Global Reporting Initiative (GRI). The GRI establishes reporting principles, provides guidance on setting the boundary of the report, and lists a number of standard disclosures. Despite evidence that the GRI is becoming institutionalized, substantial differences still exist in corporate sustainability reporting practices, both between and within sectors.
International consulting companies KPMG and SustainAbility have periodically analyzed the structure and content of sustainability reports since the 1990s. In addition, academic research on the content of these reports and trends in sustainability reporting in general highlight an increasing scope and improving quality of the reports. However, they also show an inconsistency in the organization of the reports and a great range in the types of information covered.
One area where there is considerable variation in reporting is in the types of performance indicators disclosed. There has been little academic or practitioner research on this topic—a significant oversight given the importance of indicators in conveying progress, or lack thereof, towards sustainability goals and targets. Wide variation in the indicators disclosed also hinders benchmarking efforts. This report addresses these issues by presenting an analysis of indicators disclosed in corporate sustainability reports.
Indicators Disclosed
To develop a database of indicators disclosed, a total of 94 Canadian corporate sustainability reports were analyzed. The analysis revealed that a total of 585 different indicators were disclosed. Of the indicators disclosed:
- twenty-two percent were used by more than three corporations;
- fifty-five percent were used only once;
- sixteen percent were used twice and
- seven percent were used three times.
Clearly, there is incredible diversity in the indicators disclosed. A number of factors may have contributed to this diversity, including differing interpretations of sustainability, a relative lack of mandatory standards for reporting, the fact that different sectors have different reporting priorities, and the need to accommodate local circumstances. Sustainability reporting is still relatively new to many corporations, which may further contribute to the uncertainty about what to disclose.
Further analysis of the indicators reveals a reasonable balance in terms of reporting on economic, environmental, and social issues. A total of 42 percent were classified as economic indicators, 33 percent were classified as environmental indicators, and 25 percent were classified as social indicators.
Table 1 provides a summary of the indicators disclosed in 10 or more reports. A variety of economic, environmental, and social indicators are immediately apparent. The table shows that only four indicators were reported by 30 or more corporations. However, the table also shows that similar issues can be addressed by different indicators. For example, several indicators focused on employees, safety, greenhouse gas emissions, donations, water use, and energy use. The table also shows that the indicators were reported in a number of different ways. Presenting the indicators in tables or charts was generally the most common means of sharing the information, but there were exceptions.

GRI Indicators Disclosed
Nearly half (48 percent) of the corporations in the sample reported using the GRI guidelines. Only one-third of the reports contained explicit summaries of their reporting on the GRI indicators. Of the corporations reporting on the GRI indicators:
- one reported on all 79 of the performance indicators suggested by the GRI;
- ten reported between 50 and 78 indicators;
- seven reported between 30 and 49 indicators; and
- thirteen reported between 10 and 29 indicators.
Each of the GRI indicators was reported at least five times. Table 2 provides a summary of the GRI indicators disclosed in 20 or more reports. The table shows that the economic, environmental, and social themes were all addressed by the most reported indicators.
As Table 2 shows, all but one of the most frequently disclosed GRI indicators is a “core” indicator. Five more “additional” indicators were used by more than 15 Canadian corporations:
- Initiatives to reduce greenhouse gas emissions and reductions achieved [EN18];
- Energy saved due to conservation and efficiency improvements [EN5];
- Initiatives to provide energy-efficient or renewable energy based products and services, and reductions in energy requirements as a result of these initiatives [EN6];
- Strategies, current actions, and future plans for managing impacts on biodiversity [EN14]; and
- Percentage of employees receiving regular performance and career development reviews [LA12].
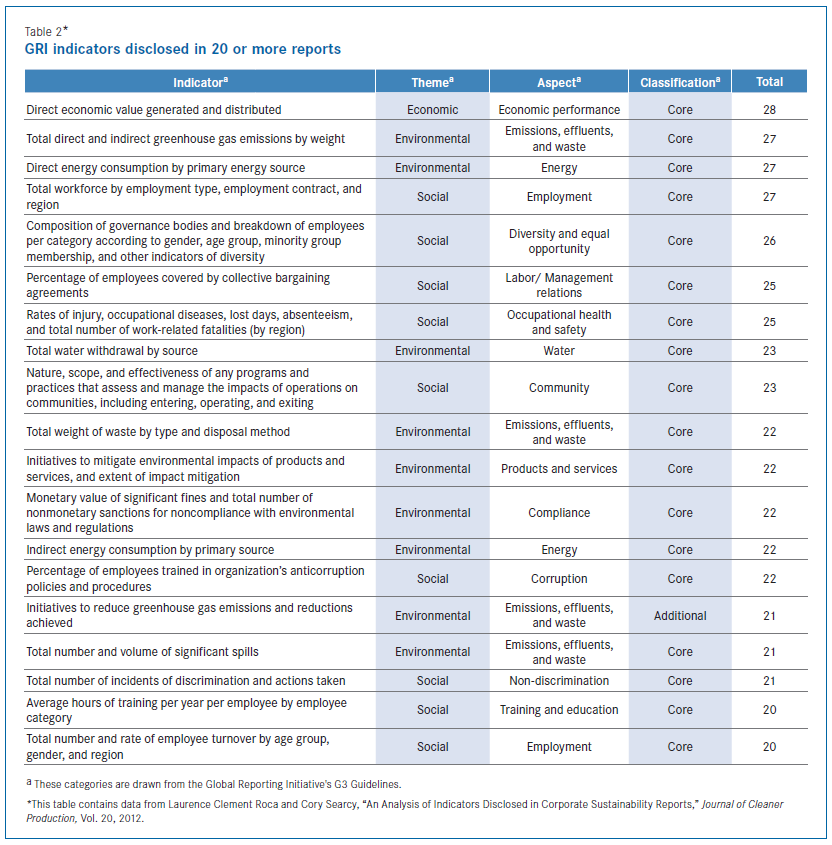
The average number of core indicators disclosed per report was 17.6, while the average number of additional indicators disclosed was 11.9.
The table reveals an inconsistency in the application of the GRI indicators. In addition to the possible factors noted above, this may be due to the fact that the GRI guidelines are voluntary and that organizations have the ability to select indicators they are most comfortable reporting. It is also interesting to note that there is considerable overlap between the most frequently disclosed indicators listed in Table 1 and Table 2.
Differences by Sector
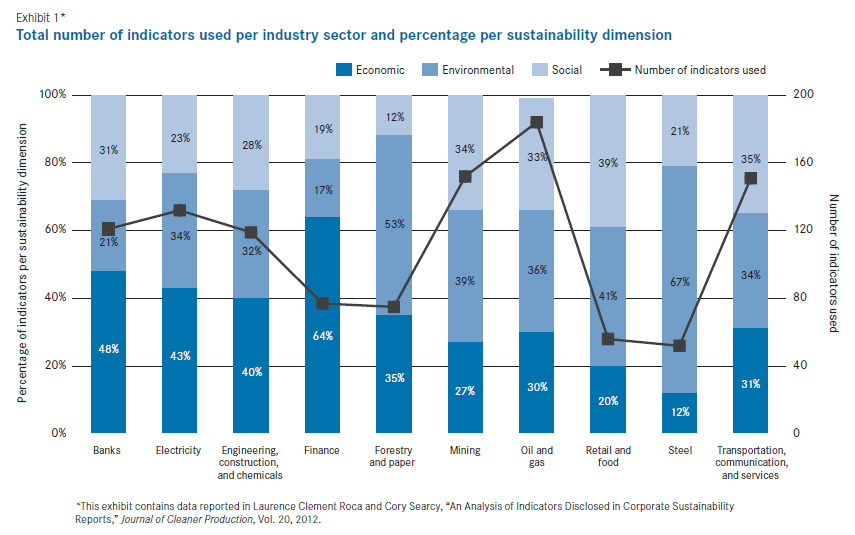
There were several key differences in indicator disclosure, both between and within the sectors studied. Exhibit 1 summarizes the number of different indicators in terms of sector and theme.
Exhibit 1 shows that the oil and gas; mining; transportation; electricity; banking; and engineering, construction, and chemicals sectors all reported at least 100 different indicators. The large number of indicators reported shows that a wide range of indicators are reported within these sectors. With the exception of banking, these sectors are traditionally regarded as having a relatively high impact on the environment. Academic research has shown that sectors with high environmental impacts tend to have higher levels of disclosure. The steel and retail and food sectors had the lowest number of different indicators disclosed. All 10 sectors in Exhibit 1 reported on the three key dimensions of sustainability, though there was considerable variation in the reporting of each dimension by sector.
Banking Corporations in this sector emphasized the economic dimension of sustainability, which is not entirely surprising given the nature of the business. The most commonly reported indicators in this sector were “employees per region,” “taxes and royalties,” “number of branches,” “total employees,” “women executives,” “employees with disabilities, visible minorities’ employees,” and “distribution of donations.”
Electricity Corporations in this sector also heavily emphasized economic indicators. The most commonly reported indicators in this sector, however, did include environmental and social indicators. They were “environmental spills and releases,” “total revenues,” and “all injury frequency,” respectively.
Engineering, construction, and chemicals Economic indicators outnumbered the other two dimensions. However, both environmental and social indicators were well represented in the total disclosures. The most commonly reported indicators were “greenhouse gas emissions,” “energy consumption,” “regulatory notifications and fines,” “total employees,” “employees by region,” “total revenues,” “total assets,” “lost time injury frequency,” “hazardous waste,” and “water consumption.”
Finance This sector had the highest proportion of economic indicators. Again, given the nature of the business, this is not a surprise. The most commonly reported indicators in this sector were “funding, donations, and sponsorship”; “total employees”; and “number of individual clients.”
Forestry and paper Over half of the indicators disclosed in this sector were environmental. This sector had the smallest proportion of social indicators in the sample. All of the corporations in this sector reported on “greenhouse gas emissions.” The other most frequently disclosed indicators were “total suspended solids” and “biochemical oxygen demand.”
Mining All three dimensions of sustainability were well represented in this sector, with environmental indicators being the most numerous. Several safety indicators were prominently featured in the reports, including “lost time injury frequency” and “all injury frequency.” This underscores the safety concerns in this sector.
Oil and gas Each of the three dimensions of sustainability accounted for at least 30 percent of the indicators in this sector. The most commonly used indicators in the sector were “funding, donations, and sponsorship”; “greenhouse gas (or CO2 equivalent) emissions”; and “total employees.”
Retail and food Both the environmental and social dimensions accounted for roughly 40 percent of the indicators in this sector. Relatively few indicators were used by multiple corporations in this sector. The most frequently cited indicator was “funding, donations, and sponsorship.”
Steel This sector reported more environmental indicators than the other two dimensions combined. This sector had the lowest proportion of economic indicators. The most frequently reported indicators were “greenhouse gas (or CO2 equivalent) emissions,” “total fluoride emissions,” “total PAH emissions,” “energy consumption,” “all injury frequency,” “total production,” and “number of planted trees.”
Transportation, communication, and services This was the only sector where the largest proportion of indicators were classified as social. Overall, the indicators were closely balanced amongst the three dimensions of sustainability. The most frequently disclosed indicators were “funding, donations and sponsorship” and indicators describing employee diversity.
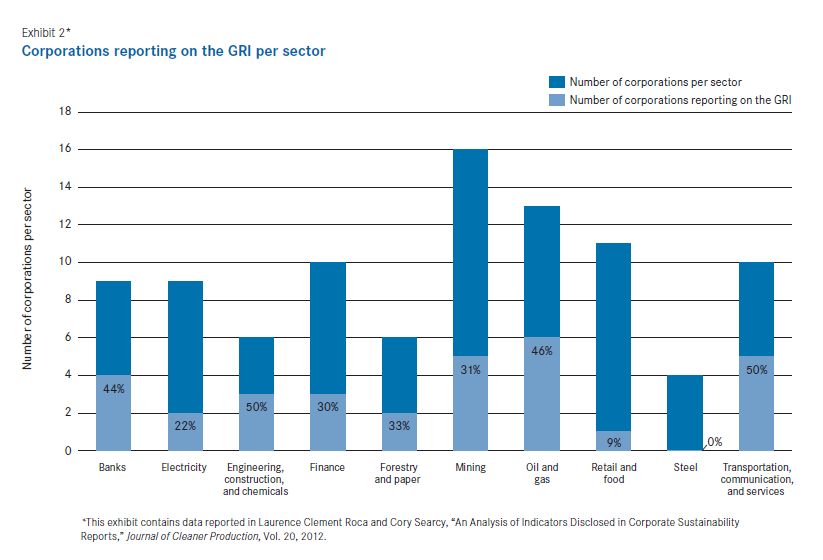
Overall, there was little consistency in the indicators disclosed between the sectors. It should be noted that there was considerable variation in the reporting practices within each sector as well. Similar trends can be observed when only the GRI indicators are considered. The percentage of corporations reporting on the GRI indicators is shown by sector in Exhibit 2. The steel sector was the only sector that did not have at least one corporation reporting on the GRI indicators. The transportation, communication, and services; engineering, construction, and chemicals; oil and gas; and banking sectors had the highest proportion of corporations reporting on the GRI indicators.
Reflections on the Results
Performance indicators have become a critical part of many corporate sustainability reports, and, as this study shows, there is an incredible variety in terms of the indicators disclosed.
A wide range of indicators
First, the number of indicators disclosed varied widely from corporation to corporation. While there is no known optimal number of indicators to report, there are risks associated with sharing too much or too little. If a relatively small number of indicators are disclosed, there is a risk that key issues will not be addressed. On the other hand, if a large number of indicators are disclosed, it is possible that readers will be overwhelmed and important issues could be lost in a sea of indicators. The choice of how many indicators to report is further complicated by the fact that different organizations have different data collection, analysis, and reporting capabilities. Different corporations also have different stakeholders, which likely influences the number of indicators reported.
Several indicators used to track similar issues
The study shows that there are many potential indicators for essentially the same issue. A number of different indicators were used to measure issues related to employees, greenhouse gas emissions, philanthropy, and resource use, among others. It is recognized that indicators must be suited to unique local circumstances, and that corporations need to select indicators that will be useful to their internal and external stakeholders. However, using a wide range of indicators to measure similar issues makes benchmarking problematic, even within the same sector. The potential for comparability between indicators is further compromised due to differing measurement schemes for indicators with the same name. Even when corporations use the GRI indictors, there are questions as to whether they have been measured in the same way.
There are a number of possible approaches to help ease these problems, including:
- sharing more of the information that underlies the indicators;
- developing more prescriptive guidelines for sustainability reporting; and
- increasing mandatory requirements for sustainability reporting.
These approaches should be viewed as complementary. At the corporate level, corporations could consider sharing more information on how the data for each indicator are collected and analyzed. This would clarify the scope of the indicators, improve transparency, increase the credibility of the measures, and potentially provide a basis for enhanced verification of the data by external parties. This could also provide a more meaningful basis for comparisons between corporations. At the sector level, the development of more prescriptive guidelines for sustainability reporting could bring several benefits. In addition to the benefits cited above, it could bring the numbers and names of indicators utilized by corporations within the same sector into better alignment. At the government level, there is the potential to introduce additional mandatory requirements for sustainability reporting. Given the broad nature of sustainability, however, any mandatory requirements would by necessity have to be fairly limited. Each of these approaches has potential drawbacks, such as increased costs, risks associated with disclosing too much information to competitors, and the difficulty in determining which indicators to report. Mandatory requirements are difficult to align across different political jurisdictions and provide no guarantee against data manipulation. They also place additional burdens on corporations that are often already heavily regulated. Notwithstanding these challenges, there is a clear need to improve the comparability of sustainability indicators if they are ever to be taken with the same seriousness as the financial information provided in annual reports.
Conclusion
Reporting on corporate sustainability performance is inherently challenging. Sustainability is complex, ambiguous, and does not have a clear endpoint. It is not directly measurable and indicators must be viewed as proxies for sustainability. The fact that corporations must struggle with contradictory goals and differing stakeholder perspectives in a continuously changing business environment introduces further complications.
Even if corporations have developed an understanding of what sustainability means to them, identified their key sustainability issues, and developed indicators linked to clear goals and targets, they must resolve further questions of what to publicly report and on how that information should be shared. Together, these challenges help explain the incredible diversity in the indicators disclosed in corporate sustainability reports.
Nonetheless, many corporations have made commendable efforts to share information on their sustainability performance. Performance indicators can help inform decision making, enhance communication, and promote understanding of a corporation’s key sustainability issues. However, these features can be enhanced through corporate, industry, and government efforts to improve the transparency and credibility of sustainability reports and indicators. There is a clear need to improve the comparability of the indicators disclosed in corporate sustainability reports, particularly among corporations in the same sector. Future work should focus on resolving these challenges.
