 Print
PrintThe following post comes to us from Alexander Aganin, vice president at Cornerstone Research. This post is based on the introduction of a Cornerstone Research report, titled “Securities Class Action Filings: 2012 Year in Review.” For more information, contact Mr. Aganin. The full report is available here.
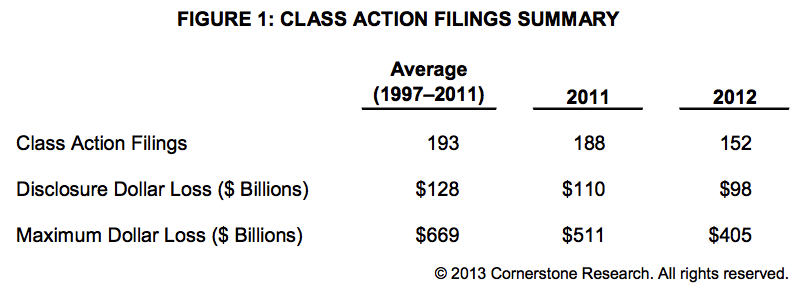
Federal securities fraud class action filing activity slowed sharply in 2012. There were 152 filings in 2012 compared with 188 in 2011. The number of federal securities fraud class actions (also referred to in this report as filings, class actions, or cases) filed was 21 percent below the annual average of 193 filings observed between 1997 and 2011 (Figure 1).
The following trends are noteworthy for 2012:
- Compared with the past two years, federal filings associated with merger and acquisition (M&A) transactions have fallen sharply. Thirteen cases were filed in 2012 compared with 40 and 43 in 2010 and 2011, respectively. Evidence indicates these actions are now being pursued almost exclusively in state courts after the unusual jump in federal M&A filings in 2010 and 2011. [1]
- The rush of filings against Chinese issuers listed on U.S. exchanges through reverse mergers (Chinese reverse mergers, or CRMs) seen in late 2010 and throughout 2011 has subsided. New CRM cases declined substantially from 31 filings in 2011 to 10 filings in 2012, or only 6.6 percent of all federal securities class actions, compared with 16.5 percent in 2011. The majority of these filings occurred in the first half of 2012, with only four cases recorded in the second half of the year.
- The wave of credit crisis–related filings is over. No new class actions related to the credit crisis were filed in 2012 compared with three such filings in 2011. This marks the first post–credit crisis year with no related filings.
- Filing activity in the second half of 2012 was considerably slower than in the first half of the year, with only 64 filings compared with 88 such filings in the first half of the year. Fourth-quarter activity was particularly slow with only 25 filings, the lowest number of filings in any quarter in the last 16 years.
- There has been an increase over recent years in the percentage of filings in which Rule 10b-5 claims were made. In 2012, 85 percent of filings made Rule 10b-5 claims, whereas only 10 percent and 9 percent made Section 11 or Section 12(2) claims, respectively. The number of filings in which no Rule 10b-5, Section 11, or Section 12(2) claims were made decreased in 2012 to 9 percent, due to the decrease in federal M&A filings.
Disclosure Dollar Loss and Maximum Dollar Loss
Consistent with the overall decline in filing activity, the loss of market capitalization associated with filings also decreased in 2012 and remained below the historical averages observed between 1997 and 2011 (Figure 1):
- The total Disclosure Dollar Loss (DDL) of $98 billion in 2012 represented an 11 percent decrease from 2011 and is 23 percent below the historical average of $128 billion. There were four “mega DDL” filings in 2012 associated with end-of-class market capitalization losses exceeding $5 billion, the same number as in 2011. The historical average of such filings is six.
- The total Maximum Dollar Loss (MDL) of $405 billion in 2012 is 21 percent below the total MDL in 2011 and 39 percent below $669 billion, the historical average MDL. There were 10 “mega MDL” filings with losses of more than $10 billion, one more than in 2011. However, the 10 mega MDL filings in 2012 were 43 percent smaller in aggregate than the nine in 2011. Mega MDL filings represented only 55 percent of the MDL IndexTM in 2012, while the mega MDL filings in 2011 represented 77 percent of the MDL Index. [2]
Activity by Industry
Filing activity has continued to be most prevalent against companies in the Consumer Non-Cyclical sector. Of the 49 filings in this sector, the majority were against healthcare, biotechnology, and pharmaceutical companies. Filings against these types of companies have consistently been a sizeable portion of filings in recent years, even as filings in other sectors have declined. There were 33 filings in these three industries in 2012 (22 percent of all filings) compared with 28 in 2011 (15 percent) and 33 in 2010 (19 percent). Overall filings in the Financial sector further decreased in 2012, as financial companies were defendants in 15 filings (10 percent of all filings) compared with 25 (13 percent) in 2011 and 43 (24 percent) in 2010.
An analysis of large public companies listed on the S&P 500 shows that only 3.4 percent were defendants in class actions filed during the year. This is substantially lower than the 2000–2011 average of 6.1 percent and comparable to the 13-year low observed in 2011 (3.2 percent).
New for the 2012 Year in Review
- An analysis of the progression and outcome of class actions based on how quickly they were filed. We have examined the case progression of filings that occurred within 60 days of the alleged class period (faster filings) in comparison to those that took longer than 60 days (slower filings). We observe that the faster filings were more likely to settle early and as a consequence less likely to reach a motion to dismiss. Slower filings were more likely to be dismissed (Figures 6 and 7).
- Detail on the location of filings against issuers with corporate headquarters outside the United States. Foreign filings remained high in 2012 even as the number of CRM cases declined (Figure 9).
- A summary of Dodd-Frank whistleblower tips in comparison to SEC enforcement actions. We have contrasted the tips received under the whistleblower program in fiscal year 2012 with the SEC’s enforcement actions over the same period (Figures 19 and 20).
The full report includes detailed figures and discussions about the topics presented here, along with other information about securities class action filings in 2012; the report is available here.
Endnotes:
[1] Cornerstone Research, Recent Developments in Shareholder Litigation Involving Mergers and Acquisitions, March 2012 Update, Robert M. Daines and Olga Koumrian.
(go back)
[2] Disclosure Dollar Loss and Maximum Dollar Loss are defined in the Market Capitalization Losses section of this report.
(go back)