 Print
PrintThe following post comes to us from Barry J. Kramer, partner in the corporate and securities group at Fenwick & West LLP and is based on a Fenwick publication by Mr. Kramer and Michael J. Patrick; the full publication, including detailed results and valuation data, is available here.
We analyzed the terms of 156 venture financings closed in the first quarter of 2014 by companies headquartered in Silicon Valley.
Overview of Fenwick & West Results
Valuation results in 1Q14 were very strong.
- Up rounds exceeded down rounds 76% to 8% with 16% flat. The 68 point difference between up and down rounds was the largest since 2Q07, when the spread was 70 points
- The Fenwick & West Venture Capital Barometer™ showed an average price increase of 85%, a significant increase from 57% in 4Q13.
- The median price increase of financings in 1Q14 was 52%, a significant increase from 27% in 4Q13 and the highest amount since we began calculating medians in 2004.
- Software and internet/digital media continued to be the strongest industry sectors, with life science, cleantech and hardware lagging but showing respectable results. The percentage of all financings that are for software companies has trended up in recent years, hitting 45% in this quarter.
- The use of senior liquidation preference fell for the third quarter in a row, an indication of companies having leverage in negotiations with investors.
Overview of Other Industry Data
The first quarter of 2014 was very strong for the U.S. venture industry.
- Venture capital investment hit its highest levels since 2001.
- The number of venture backed IPOs was the highest since 2000.
- Venture funds raised the most amount of money since 4Q07.
- Acquisitions of venture backed companies improved over 4Q13.
- Venture capitalist sentiment increased for the seventh straight quarter.
But recently things have become much more choppy. On March 7, 2013 Nasdaq was at 4371 and up over 5% for the year, but since then has fallen close to 6%, and many tech companies have fallen much more. For example, the BVP Cloud Computing Index fell by 30% from early 2014 until late April 2014 and the Thomson Reuter Post-Venture Capital Index, which tracks the post IPO results of U.S. venture backed companies that have gone public in the past ten years, was down 6.5% in the month of March alone (which is the most recent month available).
Venture Capital Investment
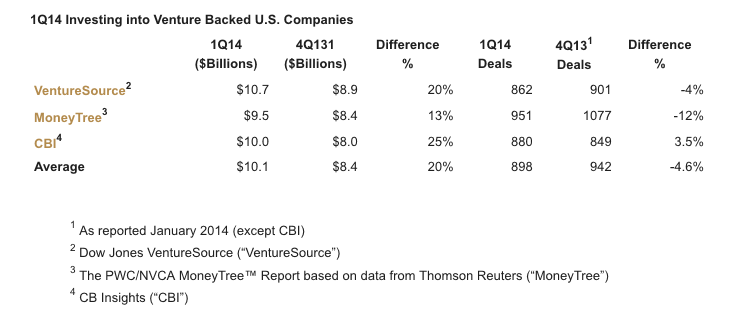
U.S. venture capital investment in 1Q14 hit its highest quarterly level (in dollar terms) since 2001, and rose approximately 20% in dollar terms over 4Q13. A summary of results published by three leading providers of venture data is below:
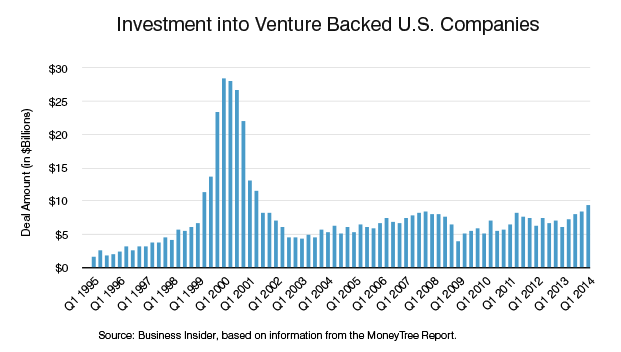
While investment in 1Q14 certainly indicates a recovery from the “Great Recession” of 2008-09, it does not approach the “Dot-Com” era level of investment as shown in the following chart from Business Insider.
Investment in later stage deals was especially strong in 1Q14, comprising 47% of all dollars invested, while Series A investment fell to a five quarter low at 15%, per CBI. Valuations of late stage companies were also strong, with 11 venture backed companies raising funds at a valuation of over $1 billion for the first time in 1Q14, more than did so in all of 2013.

One of the reasons for the increased valuations in late stage financings is the increased participation in recent years of non-venture capital investors such as hedge funds, mutual funds, public venture funds and private equity funds. According to the Venture Capital Journal, hedge and mutual funds participated in 23 venture deals through mid-April, compared to 41 in all of 2013. This participation has been important given the increased time to liquidity for many venture backed companies and the reduced venture fundraising in recent years. That said, companies considering taking investments from these alternative entities should recognize that these entities are often structured differently than venture capitalists, and should inquire as to (i) whether the entity’s limited partners/investors can withdraw substantial funds on a quarterly basis or other short time frame, possibly limiting the ability of the fund to participate in future company financings, especially during tough economic times, or even having to liquidate their earlier investment, and (ii) whether the investor has public reporting obligations that could require them to publicly report the current value of their private company investments. For a related article see Hedge Fund Rising.
Hardware investing has increased recently, receiving $848 million of venture investment in 2013, nearly twice the prior record of $442 million raised in 2012, according to VentureWire. This is due in part to start up hardware companies benefitting from new productivity advantages that allow them to prototype and test market products cheaper and easier than before. These advantages include new technologies (3D printing), third party assistance (contract manufacturers and accelerators), decreasing component costs (due to mass production of mobile device components) and new funding techniques which are especially useful to start up consumer electronics companies (crowdfunding cash for product). See Correlated Causation.
The San Francisco Bay Area received a record 50% of U.S. venture investment in 2014 per the Venture Capital Journal. Especially notable was the increase in investing in the city of San Francisco, which has gone from attracting 6% of the region’s venture capital in 2003 to 40% in 2013, according to VentureWire.
IPO Activity
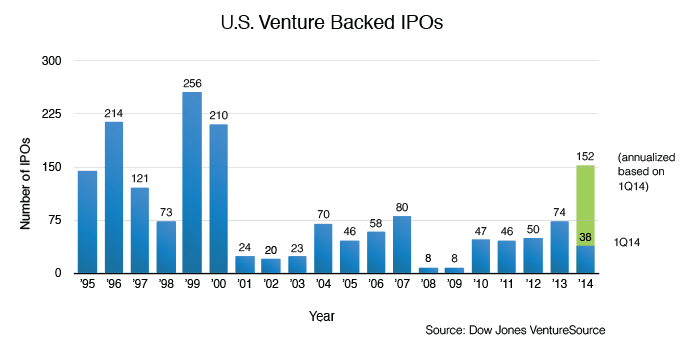
The number of U.S. venture back IPOs in 1Q14 hit the highest levels since 2000.
There were 38 venture backed IPOs raising $2.9 billion in 1Q14, a 60% increase from the 24 IPOs reported in 4Q13, although a 45% decline in dollars raised, according to VentureSource.
Similarly, Thomson Reuters and the NVCA (Thomson/NVCA) reported 36 IPOs in 1Q14, a 50% increase in IPOs from 4Q13. Notably, 24 of the 36 IPOs were life science companies, and 35 of the 36 IPOs were for U.S. based companies.
If this level of IPOs would continue throughout 2014 (a very big “if”), 2014 would be a very strong year for IPOs, but still less significantly than 1999-2000.
An interesting IPO trend is a possible rebound/increase in venture backed foreign companies choosing to go public in the U.S., as evidenced by the recent IPO of Weibo, and the filing for a U.S. listing by Alibaba. While a large part of the attraction of U.S. markets is their depth and transparency, it is also their acceptance of dual classes of stock and super voting shares, and their willingness to not require that a company be profitable, that has mattered to foreign companies. In an interesting twist, one of the justifications for U.S. exchanges having looser standards is the presence of an active plaintiffs bar to police the actions of companies and their controlling persons, allowing the government and exchanges to regulate less.
Merger and Acquisition Activity
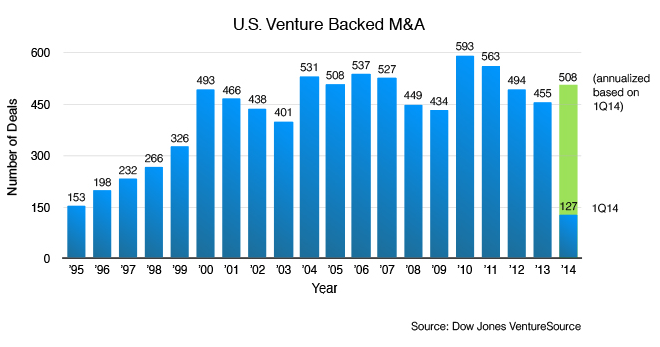
M&A deal volume increased in 1Q14 with VentureSource reporting a 3% increase in the acquisition of venture backed companies (115 in 4Q13, as reported in January 20141, compared to 119 deals in 1Q14), and Thomson/NVCA reporting a 30% increase (81 in 4Q13, as reported in January 20141, compared to 105 deals in 1Q14).
VentureSource reported that $17 billion was paid in 1Q14 venture company M&A, the largest amount in a quarter since 3Q00, and CB Insights reported that of the ten largest exits in 1Q14, seven were via acquisition rather than IPO, and all seven were in the IT industry.
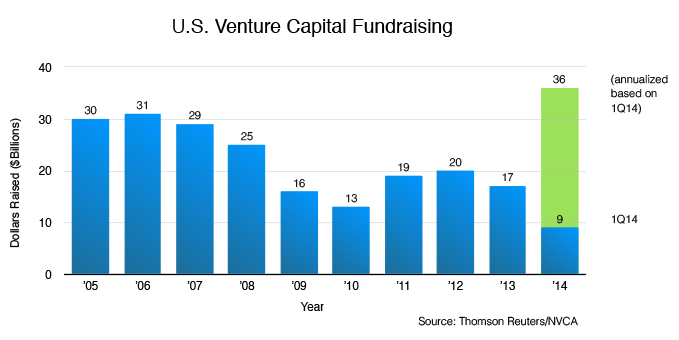
Venture Capital Fundraising
It was a very good quarter for venture fundraising.
A total of $8.9 billion was raised by 58 funds in 1Q14, a 82% increase in dollars from the $4.9 billion raised by 53 funds in 4Q13 and a 9% increase in funds, according to Thomson/NVCA. 1Q14 was the strongest quarter for fundraising (in dollars) since 4Q07 and saw the largest number of new venture funds (25) since 4Q00.
While the increased investment in venture capital is welcome, it is hopefully part of a long term plan by investors to invest in the asset class, and not a short term reaction to the recently improved liquidity market, as most of the companies to be funded by these new investments are unlikely to benefit from the current liquidity environment.
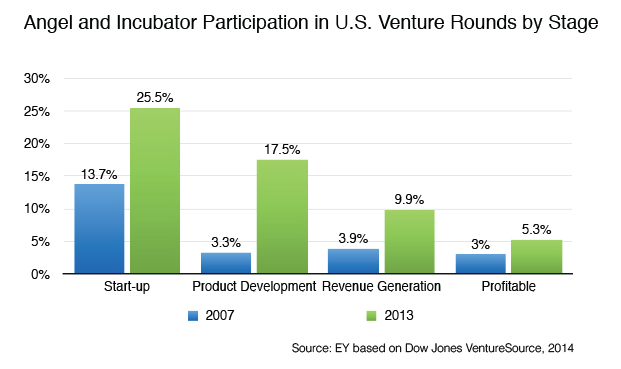
Angel/Accelerator Financing
The angel/accelerator environment continues to broaden and evolve.
Angel and accelerator participation in financing rounds has grown significantly in the past seven years, as reported by EY.
Similarly, the Center for Venture Research reported a 8.3% increase in angel investment in 2013 over 2012, in dollar terms.
Corporations are becoming increasingly involved in accelerator and angel investing, despite their reputation for being late stage investors, as they search for early stage promising technologies to fuel their next generation of products, according to TechCrunch.
While the rapid growth in the angel/accelerator environment holds the potential for excess (leading to a Series A and/or B crunch), we note that in general it is not easy for an entrepreneur to be accepted by an accelerator, with TechCrunch reporting that less than 4% of accelerator applicants are accepted.
To assist entrepreneurs in their evaluation of accelerators, accelerators should be encouraged to disclose the historical track record of graduates from their program, including fundraising success or failure.
On a related point, we note CB Insights efforts to independently evaluate AngelList syndicators to assist potential syndicate investors, and StrictlyVC’s suggestion that AngelList syndicators provide their potential “limited partners” with the syndicator’s investment track record.
And as the angel/accelerator environment continues to develop, Y Combinator has decided to end its program in which specific venture firms provided a small amount of automatic funding to all YC participants, to avoid any “signaling” risk if the venture firm does not participate in a follow on investment, as well as any possible appearance of bias towards such funds. Y Combinator has also decided to institute a standard economic arrangement with all their participants—$120,000 of funding for 7% of the participant’s equity—to simplify financial arrangements.
Further evidence that the accelerator industry has “arrived” is professors crunching data to rank the best accelerators. As reported in TechCrunch, the professors determined that the top three were Y Combinator, TechStars and AngelPad.
Secondary Markets
The secondary markets for shares in venture backed companies continue to expand as companies wait longer to go public and the public markets provide healthy valuations.
In March the Nasdaq Private Market (“NPM”) was launched as a joint venture of Nasdax OMX Group and SharesPost. The NPM is aiming for the higher end of the market using broker dealers to implement trades in private companies and requiring that a company have $50 million in enterprise value, annual net income of $750,000 and a two year operating history to be listed, as reported by the Venture Capital Journal.
Also in March, SharesPost launched the SharesPost 100 Fund. The fund is open to both accredited and non-accredited investors who want to invest in a pool of private companies selected and sourced by SharesPost.
These new additions to the secondary market, together with an increase in public and private funds making secondary purchases in venture backed companies, provide for a dynamic secondary market. And while this market provides a useful mechanism for companies to provide liquidity to insiders to facilitate the company staying independent and private longer, it also poses issues for companies—such as having less sophisticated shareholders who might react poorly when investments fall in value and who may not be able to support the company during tough times.
That said, with all the new late stage investor types, if markets decline significantly, secondary purchasers with investable cash could be very busy.
Interesting Trends and Articles
Immigration—Immigrants currently comprise 20% of the U.S. high tech work force and 17.3% of high tech entrepreneurs, a significant increase from 13.7% and 13.5%, respectively, in 2000, as discussed in a Kauffman Foundation report. Meanwhile the H-1B visa quota for fiscal year 2015 was reached on April 7, 2014, just one week after the window for submitting applications opened.
In a very creative approach to address the immigration difficulties encountered by foreign born graduates of U.S. universities who want to stay in the U.S. post-graduation to start companies, Massachusetts is considering exploiting a little known provision of immigration law that exempts universities from the H-1B visa cap. Massachusetts would accomplish this by employing such graduates in universities on a part time basis post-graduation thereby solving the visa problem, and allow the graduates to spend the remainder of their time as entrepreneurs, according to AlwaysOn.
Employee compensation—Historically it has been difficult to get good information on start up tech company employee compensation. This might be changing, as AngelList makes information available from its job search service. Using this data TechCrunch has reported on averages and trends by type of compensation (cash vs. equity) and region (Silicon Valley vs. East Coast), and we expect further uses of this data in the future as the data base expands.
Non Competition Agreements—Another pro-entrepreneur action being considered by Massachusetts according to AlwaysOn is the prohibition of employee non competition agreements. In California employee non competition agreements have long been generally illegal. In Massachusetts (and many other states) they are generally legal if reasonable. Many years ago, Professor Gilson of Stanford Law School wrote an article positing that the illegality of non competition agreements in California was a significant reason for the entrepreneurial vibrancy and employee mobility that developed in Silicon Valley. Similarly, he posited that the ability of Massachusetts companies to prevent employees from “competing”, despite their not using intellectual property or confidential information from their ex employer, played a significant role in the relative decline of Route 128 compared to Silicon Valley. We believe that Massachusetts would do itself (and entrepreneurism in general) a favor by ridding itself of this restriction on employee mobility.
Regulation—As technology causes change faster than the courts and legislatures can react, increasing numbers of new companies (e.g., Uber, Airbnb, Tesla, Aereo, Amazon drones, Google cars, Bitcoin) are not only wrestling with developing new technologies and markets, but are also trying to understand (and influence) how government might regulate them.
Venture Capital Sentiment
The Silicon Valley Venture Capitalist Confidence Index by Professor Mark Cannice at the University of San Francisco reported that the confidence level of Silicon Valley venture capitalists increased to 4.03 on a 5 point scale, an increase from the 3.94 reported last quarter. The result was the seventh consecutive quarterly increase and the highest results since 3Q07. Venture capitalists noted the breadth of sectors providing good investment opportunities (cloud, big data, cybersecurity, mobile, 3D printing, batteries, education), and while concern was expressed over consumer oriented internet and selective other “breathtaking high” valuations, the overall sense was that the venture market was promising.
Venture Capital Returns
Cambridge Associates reported that the value of its venture capital index increased by 11.9% in 4Q13 (1Q14 results have not been publicly released), which slightly exceeded the Nasdaq increase of 10.7% during the period. However, Nasdaq returns have exceeded the venture index for the most recent 1, 3 and 5 year time periods, while the venture index beat Nasdaq for the 10 year time period and longer.
Nasdaq
Nasdaq decreased 1% in 1Q14, but has decreased another 1% in 2Q14 through May 12, 2014.
