 Print
PrintJohn Gould is senior vice president at Cornerstone Research. This post is based on a Cornerstone Research report. The complete publication is available here.
Number and Size of Filings
- Plaintiffs filed 189 new federal class action securities cases (filings) in 2015—the most since 2008, and an 11 percent increase compared with 2014. The number of filings in 2015 was in line with the average number of filings observed annually between 1997 and 2014.
- The total Disclosure Dollar Loss (DDL) of cases filed in 2015 jumped to $106 billion from $57 billion in 2014—an 86 percent increase. DDL remained below its historical average of $121 billion.
- The total Maximum Dollar Loss (MDL) increased by 73 percent—from $215 billion in 2014 to $371 billion in 2015. MDL was approximately 61 percent of the historical average of $607 billion.
- The number of mega filings in 2015 increased substantially from 2014. There were five mega DDL cases (those with a DDL of at least $5 billion) and eight mega MDL cases (those with an MDL of at least $10 billion)—compared to zero and two in 2014, respectively.
Other Measures of Litigation Intensity
- Looking at the full universe of U.S. exchange-listed companies, 4.0 percent were subject to filings in 2015, up from 3.6 percent in 2014 and the third consecutive yearly increase. This is the highest annual rate in the dataset (since 1997).
- Filings against companies in the S&P 500 remained at levels well below historical averages based on either the number of filings or the market capitalization of companies subject to class actions.
Figure 1. Class Action Filings Summary
| Average 1997–2014 |
2014 | 2015 | |
|---|---|---|---|
| Class Action Filings | 188 | 170 | 189 |
| Disclosure Dollar Loss ($ Billions) | $121 | $57 | $106 |
| Maximum Dollar Loss ($ Billions) | $607 | $215 | $371 |
Key Trends
- The general characteristics of claims asserted and allegations made in 2015 filings were fundamentally similar to 2014 filings.
- Filings against foreign issuers were up slightly from 2014 (from 34 to 35), but fell as a percentage of total filings.
- Filings against companies in the Financial sector were well below historical averages, declining from 26 in 2014 to 17 in 2015. For the first time since 2006, there were no filings against Banks.
- The Consumer Non-Cyclical sector again had the most filings in 2015. This sector is predominantly composed of Biotechnology, Pharmaceutical, and Healthcare companies, which collectively totaled 43 filings—one more filing than in 2014.
- There were more filings in the Ninth Circuit than in any time in the data period. The four largest industry subsectors by number of filings in the Ninth Circuit were Internet, Biotechnology, Pharmaceutical, and Semiconductor. Filings in the Second and Ninth Circuits made up 62 percent of all filings in 2015.
New and Updated Analyses
Trends in IPOs and Their Litigation Exposure
This analysis tracks the number of IPOs and examines the likelihood they were the subject of a class action filing.
- IPOs fell from 207 in 2014 to 117 in 2015, but remained above post dot-com bubble levels.
- At 117 IPOs, 2015 represents the lowest annual number of IPOs since 2012.
- Filings have been more likely to target IPOs initiated after the financial crisis in 2008 than IPOs in prior periods.
Dismissal and Settlement Trends
This analysis presents trends in the outcomes of class action filings. In light of evidence of increases in the likelihood of dismissals, this analysis tracks dismissal and settlement rates for recent annual filing cohorts. It examines these rates in the first three years after the filing of a class action to gain insight on the early resolution trend for filings in the most recent years.
- Dismissal rates appear to be trending down since the 2010 and 2011 filing cohorts.
- Beginning with the 2012 filing cohort and continuing through the 2014 filing cohort, evidence from the timing of dismissals in the first three years after filing indicates that dismissal rates have subsided.
- The percentage of cases settled within three years of their filing dates has generally decreased since 2006, with the exception of a few annual filing cohorts.
Number of Filings
For presentation purposes, only the last 10 years are reflected in this figure and others that follow. Appendix 1 of the complete publication tracks these data over a longer time frame, with a summary of basic metrics starting in 1997.
Key Findings
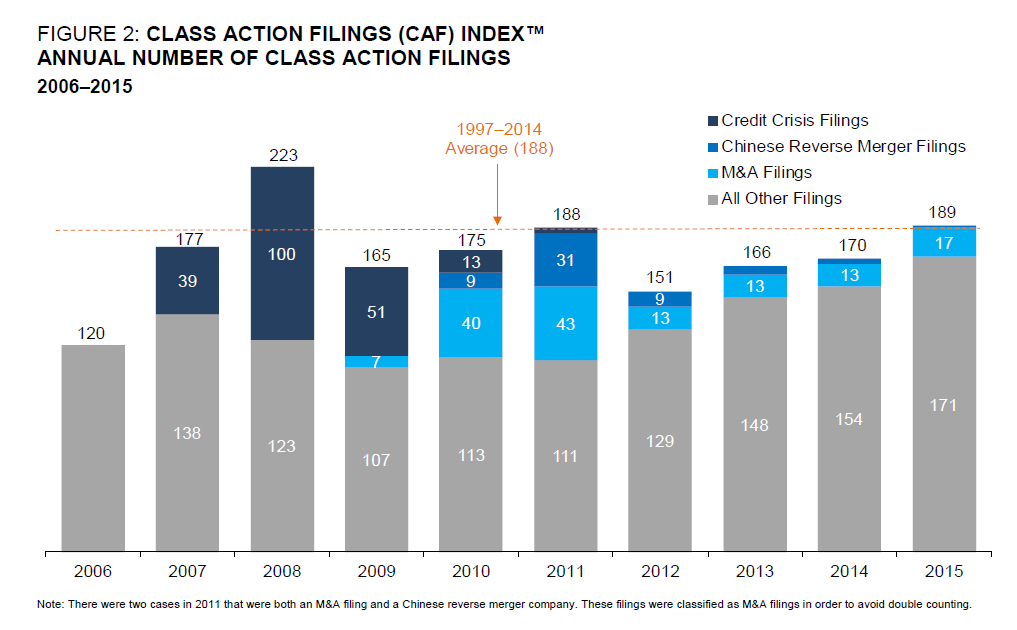
- The 189 filings in 2015 represent an 11 percent increase from 2014, and are in line with the 1997–2014 annual average of 188 filings. The year 2015 was the first time since 2008 in which the number of filings was above the historical average.
- The increase in filings since 2011 is not the result of a wave of “nontraditional” filings as observed in 2010 and 2011, when merger and acquisition (M&A) and Chinese reverse merger (CRM) filings increased rapidly.
- The number of CRM filings continued to decline, with only one filing in 2015. Filings related to M&A transactions have remained fairly constant over the past four years.
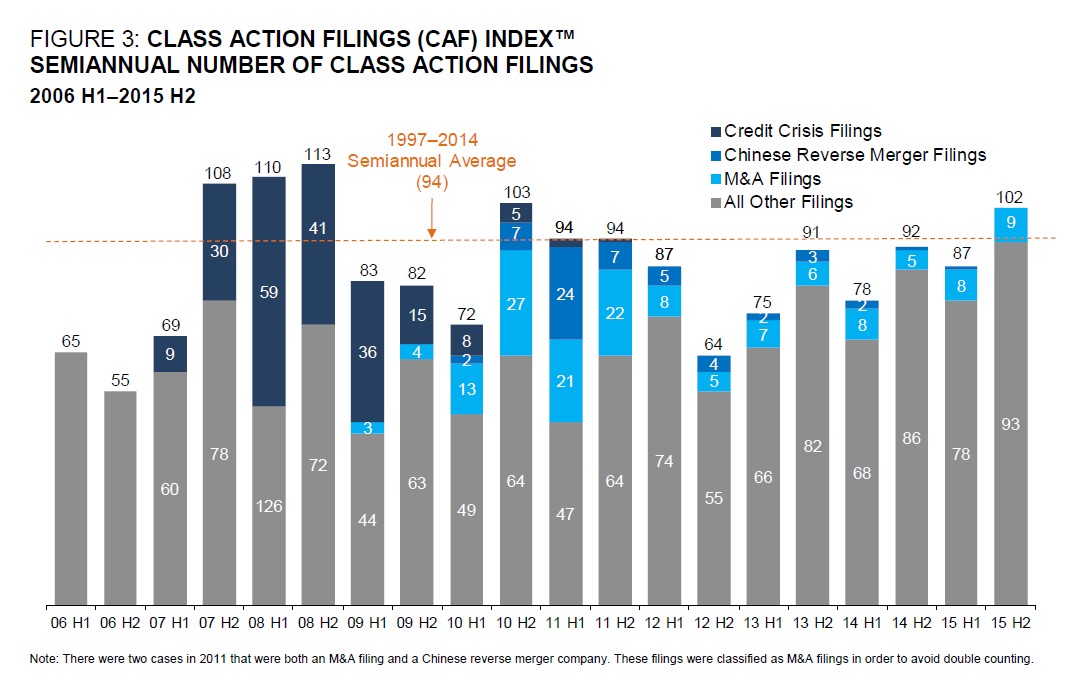
- Total filing activity increased 17 percent in the second half of 2015 compared to the first half of the year.
- Since 2013, filings in the second half of the year have distinctly outpaced the first half, although the difference was greatest in 2013.
- M&A filings have continued at a low but steady rate since the first half of 2012.
- There was one CRM filing in the first half of 2015, but none in the second half.
The complete publication is available here.
