 Print
PrintAnn Yerger is an executive director at the EY Center for Board Matters at Ernst & Young LLP. The following post is based on a report from the EY Center for Board Matters.
The EY Center for Board Matters collects and analyzes governance data for more than 3,000 US public companies through its proprietary corporate governance database. We invite you to explore Corporate Governance by the Numbers.
Board Composition
| Board composition* | S&P 500 | S&P MidCap 400 | S&P SmallCap 600 | S&P 1500 | Russell 3000 |
|---|---|---|---|---|---|
| Age | 62 years | 63 years | 62 years | 62 years | 61 years |
| Gender diversity | 2 (21%) | 2 (16%) | 1 (14%) | 2 (17%) | 1 (14%) |
| Independence | 85% | 82% | 81% | 83% | 79% |
| Tenure | 9 years | 9 years | 9 years | 9 years | 8 years |
| * Numbers based on all directorships in each index; gender diversity data represents average number of women directors on a board (and the percentage this represents) | |||||
Board Meetings and Size
| Board meetings and size | S&P 500 | S&P MidCap 400 | S&P SmallCap 600 | S&P 1500 | Russell 3000 |
|---|---|---|---|---|---|
| Board meetings | 8 | 7 | 8 | 8 | 8 |
| Board size | 10.8 | 9.3 | 8.3 | 9.4 | 8.8 |
Board Leadership Structure
| Board leadership structure* | S&P 500 | S&P MidCap 400 | S&P SmallCap 600 | S&P 1500 | Russell 3000 |
|---|---|---|---|---|---|
| Separate chair/CEO | 47% | 57% | 61% | 55% | 56% |
| Independent chair | 28% | 37% | 42% | 36% | 36% |
| Independent lead director | 54% | 51% | 41% | 48% | 40% |
| * Percentage based on portion of index; data through 31 Dec 2015 | |||||
Board Elections
| Board elections* | S&P 500 | S&P MidCap 400 | S&P SmallCap 600 | S&P 1500 | Russell 3000 |
|---|---|---|---|---|---|
| Annual elections | 91% | 62% | 55% | 69% | 60% |
| Majority voting in director elections | 88% | 60% | 38% | 62% | 44% |
| * Percentage based on portion of index; data through 31 Dec 2015 | |||||
Board and Executive Compensation
| Board and executive compensation | S&P 500 | S&P MidCap 400 | S&P SmallCap 600 | S&P 1500 | Russell 3000 |
|---|---|---|---|---|---|
| Independent directors | $291,987 | $310,238 | $171,120 | $248,625 | $226,053 |
| CEO 3-yr average pay | $12.4 million | $6.2 million | $3.3 million | $7.1 million | $5.6 million |
| NEO 3-yr average pay | $4.7 million | $2.2 million | $1.2 million | $2.6 million | $2.1 million |
| Average pay ratio: CEO / NEO | 2.6 times | 2.8 times | 2.8 times | 2.7 times | 2.7 times |
| * Numbers based on all directorships and executive positions in each index | |||||
Russell 3000 Opposition in Votes in Director Elections
| Russell 3000: Opposition votes in director elections | Full year 2015 | Year to date 2016 |
|---|---|---|
| Total elections | 17,808 | 15,529 |
| Average opposition votes received (support) | 4.0% (96.0%) | 4.1% (95.9%) |
| Russell 3000: Opposition votes received by board nominees | Full year 2015 | Year to date 2016 |
|---|---|---|
| Directors with less than 80% support (% of nominees) | 4.0% | 4.0% |
| Number of directors | 709 | 615 |
| Directors with less than 50% support (% of nominees) | 0.3% | 0.3% |
| Number of directors | 56 | 46 |
Say-on-Pay Proposals
| Russell 3000: Say-on-Pay proposals voted | Full year 2015 | Year to date 2016 |
|---|---|---|
| Total proposals voted | 2,194 | 1,850 |
| Proposals with less than 70% support (% of proposals) | 8.0% | 6.7% |
| Number of proposals | 175 | 124 |
| Proposals with less than 50% support (% of proposals) | 2.6% | 1.5% |
| Number of proposals | 56 | 27 |
| Say-on-Pay proposals vote support | Full year 2015 | Year to date 2016 |
| S&P 500 | 92.0% | 91.5% |
| S&P 1500 | 91.6% | 91.8% |
| Russell 3000 | 91.3% | 91.5% |
Shareholder Proposals
| Shareholder proposal categories | Number voted | Portion of voted proposals |
|---|---|---|
| Environmental/social | 199 | 39% |
| Board-focused | 163 | 32% |
| Compensation | 56 | 11% |
| Anti-takeover/strategic | 86 | 17% |
| Routine/other | 7 | 1% |
| All | 511 | 100% |
| Top shareholder proposals by vote support* | Average support |
|---|---|
| Eliminate Classified Board | 74.7% |
| Adopt Majority Vote to Elect Directors | 68.5% |
| Eliminate Supermajority Vote | 61.0% |
| Adopt/Amend Proxy Access | 51.8% |
| Allow Shareholders to Call Special Meeting | 41.9% |
| Allow Shareholders to Act by Written Consent | 39.7% |
| Increase/Report on Board Diversity | 35.4% |
| Address Corporate EEO/Diversity | 32.5% |
| Appoint Independent Board Chair | 29.2% |
| Review/Report on Climate Related Risks | 28.6% |
| * Based on topics where at least 5 shareholder proposals went to a vote | |
| Top shareholder proposals by number voted* | Number voted |
|---|---|
| Adopt/Amend Proxy Access | 76 |
| Appoint Independent Board Chair | 47 |
| Review/Report on Lobbying Activities | 40 |
| Review/Report on Political Spending | 29 |
| Address Human Rights | 23 |
| Adopt Majority Vote to Elect Directors | 22 |
| Limit Post-Employment Executive Pay | 21 |
| Report on Sustainability | 20 |
| Allow Shareholders to Call Special Meeting | 18 |
| Review/Report on Climate Related Risks | 18 |
| * Based on topics where at least 5 shareholder proposals went to a vote | |
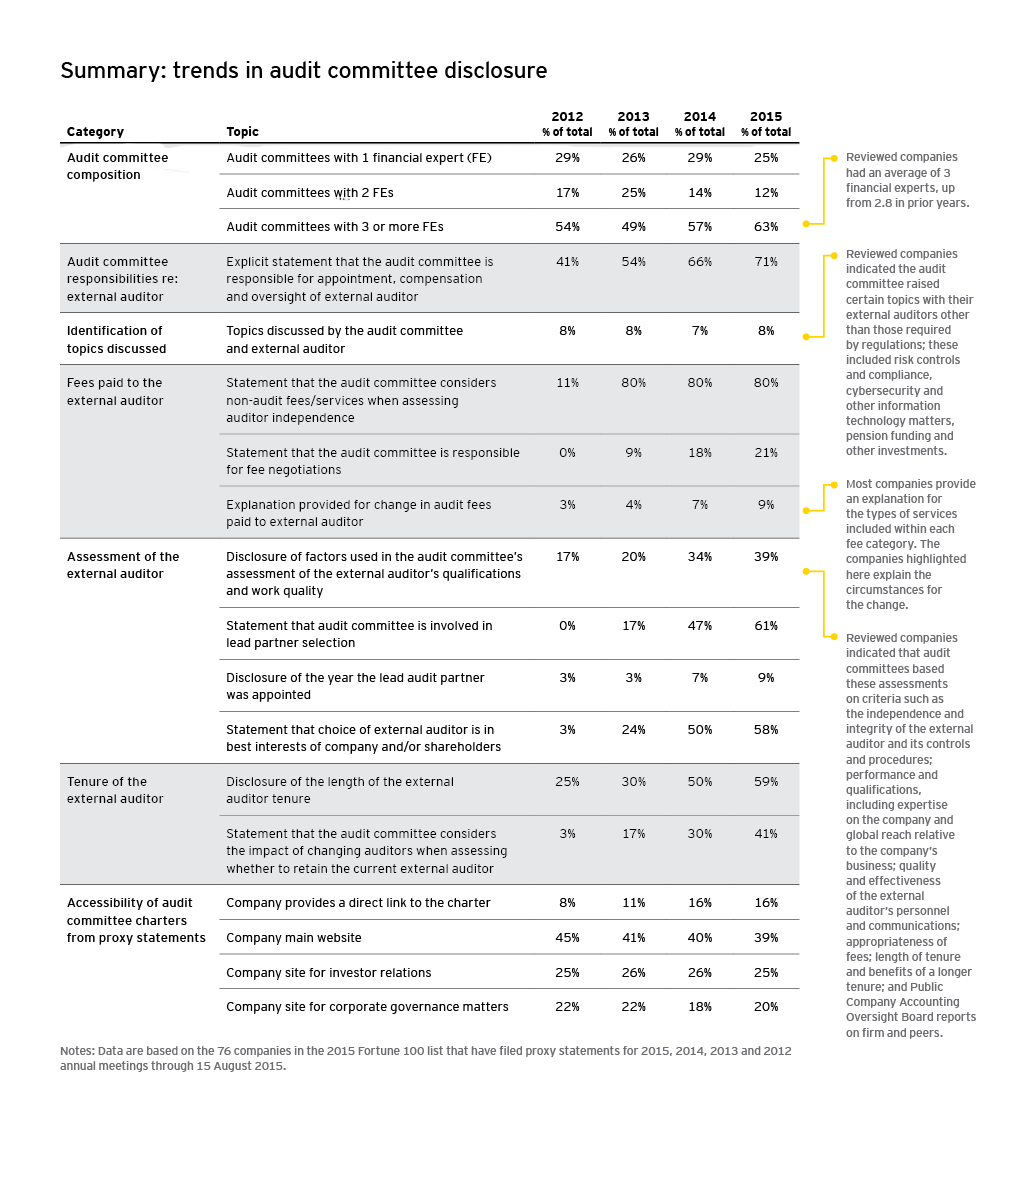
Trends in Audit Committee Disclosures
The data below was current as of August 2015 and appears in Audit committee reporting to shareholders in 2015.
Shareholder Engagement Trends
The data below was current as of June 2016 and appears in Four takeaways from proxy season 2016 (discussed on the Forum here).
S&P 500 companies disclosing engaging with investors*
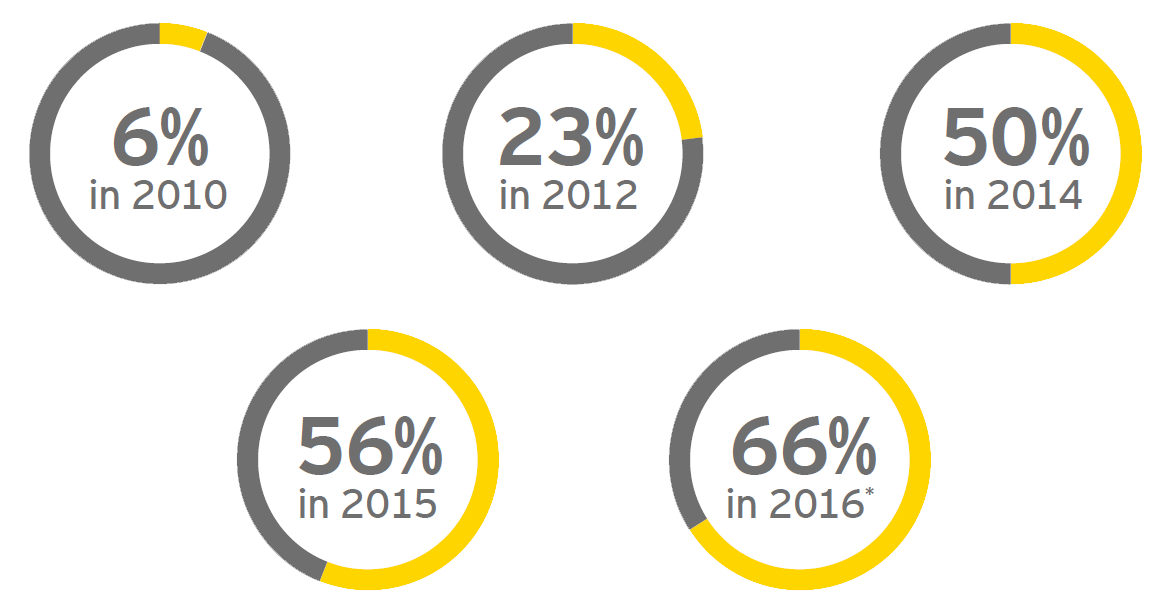
*Percentages for 2016 based on 436 proxy statements for S&P 500 companies available as of June 10, 2016.
