 Print
PrintBrian Bell is Associate Professor of Economics at University of Oxford and John Van Reenen is a Professor of Applied Economics at the MIT Sloan School of Management. This post is based on a recent paper by Professors Bell and Van Reenen. Related research from the Program on Corporate Governance includes: Paying for Long-Term Performance by Lucian Bebchuk and Jesse Fried (discussed on the Forum here).
Lacklustre growth seems to be the new normal almost everywhere in the world except for one area—the pay of Chief Executive Officers (CEO). For S&P500 firms, the average CEO made 31 times the wage of the average production worker in 1970 but rose to 325 by 2008 (Conyon et al., 2011) and 335 in 2015. This has not gone unnoticed by politicians and the media.
CEO pay could have risen purely through market forces. For example, globalization and technological change enables a CEO to leverage his ability (it is rarely a “her”) over a larger scale. As the size of firms increases so does CEO pay (e.g. Gabaix and Landier, 2008). But other factors may also play an important role as attested by many corporate governance scandals. And why does CEO pay rise when firm performance does not? Or when firms do well for reasons unrelated to the talent or effort of the CEO, for example a stock market bubble or oil price boom? To provide fresh evidence on these questions, our new research uses UK publicly listed firms as a case study because since the late 1990s, there has been a major shift towards rewarding CEOs based on relative performance. A typical “Long Term Incentive Plan” (LTIP) is to grant executives equity conditional on improving shareholder returns relative to a “peer group” of large firms in the same sector (e.g. being among the top quartile of performers over a three year period). These relative performance contracts contrast to more standard US-style stock option contracts that are based on general improvements in equity prices.
Figure 1 shows that at the start of our sample around a quarter of LTIPs had a sector component. This share almost doubled over the course of the 2000s. At the same time, the share of total pay that was accounted for by LTIP awards also doubled. US corporations have also been moving towards these plans, but at a slower rate. De Angelis and Grinstein (2016) report that, by 2007 only 30% of S&P 500 firms used some form of relative performance evaluation in any part of their CEO pay package. As an early adopter, the UK experience can shed light on the efficacy of such plans. Unfortunately, we find that relative performance contracts and other LTIPs (all of which have some performance condition attached to them) seem to have failed to solve the problems of aligning CEO and shareholder incentives.
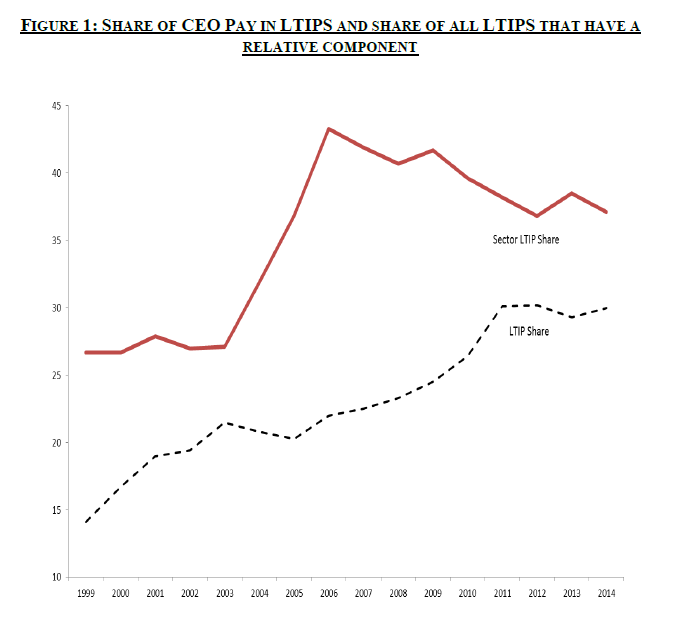
Notes: “LTIP share” is the proportion of total CEO pay in the form of Long-term Incentive Plans. Sector LTIP Share shows the percentage of all LTIPs that have a sector component in the performance evaluation (i.e. are benchmarked against an industry peer average).
Source: Authors’ calculations based on Boardex data
Using data on almost 500 firms that account for about 90% of the UK stock market we show that there is a strong relationship between pay and performance for CEOs. This isn’t the case for lower level employees where incentive pay matters much less. To examine whether the pay-performance relationship reflects market forces we looked at two tests: “pay asymmetry” and “pay for luck”.
CEO pay is not symmetric: it responds more to increases in firm performance than to decreases. To explore whether this is because of corporate governance issues, we split the firms into two groups depending on whether a large share of the equity of the firm is held by institutional investors—since such shareholders are more likely to exert strong external control on the firm’s executives. We show that the asymmetry in pay is only observed when there is weak external control (see Figure 2 Panel B).
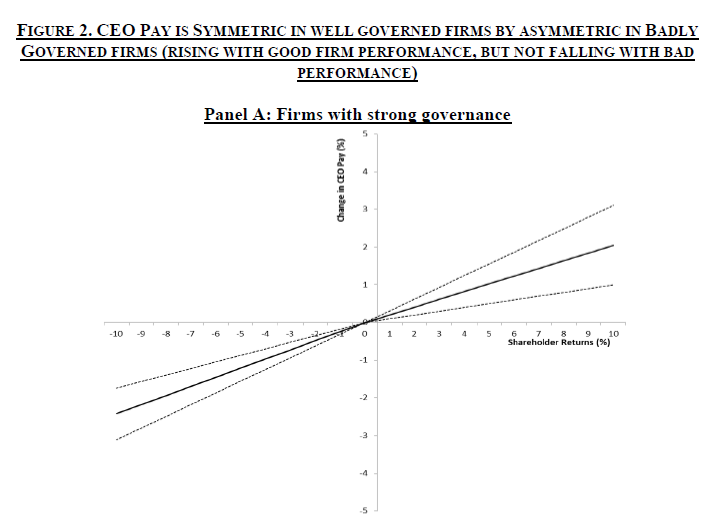
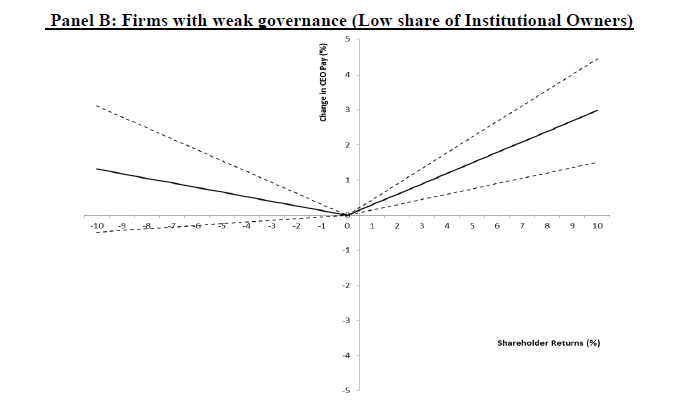
Notes: Theses figures represent the implied effect of a percentage change in a firm’s performance (as measured by TSR, Total Shareholder Returns) on the percentage increase in CEO pay. The coefficients are from the specification in column (5) of Table 4 of Bell and Van Reenen (2016). 95% confidence intervals shown. Strong governance is measured by a high share of Institutional Owners and weak governance by a low share. Panel A shows that in well governed firms the pay-performance relationship is symmetric whereas in badly governed firms, CEO pay does not fall, even when the firm does badly.
Second, we found substantial “pay for luck”, i.e. CEO pay increased when the industry experiences a random positive shock. Surprisingly, this was still the case even when the CEO was subject to plans rewarding them for performance relative to the industry. One reason for this was because CEOs were able to rig the system. When the share price underperformed, the top boss managed to extract some particularly juicy new LTIPs to make up for his expected loss of performance pay. This undermining of the system was only in firms who were weakly governed, consistent with the findings on pay asymmetry.
The fundamental problem is that CEO remuneration packages are so opaque and complex it is hard for shareholders to gauge their true generosity. Regulations to force more transparency will help, but are unlikely to be sufficient. Institutional owners, because they have greater resources and larger block-holdings, are more likely agents of change as they have the ability and incentive to be active monitors. Unless more of these investors step up to the plate, political calls for cruder and more direct intervention in CEO pay will become increasingly shrill.
The full paper is available for download here.
