 Print
PrintIra Kay is a Managing Partner at Pay Governance LLC. This post is based on a Pay Governance publication by Mr. Kay, Blaine Martin, and Clement Ma.
In the Dodd-Frank Act legislation after the 2008 Financial Crisis, the inclusion of shareholder SOP voting was driven by bipartisan Congressional support to “control executive compensation…” at corporations. In 2009, a former SEC chief accountant said, “Executive compensation at this point in time has gotten woefully out of hand… The time to adopt ‘say on pay’ type legislation is certainly past due.” [1] Politicians, regulators, and some institutional shareholders clearly thought that, “The impetus for passage of Dodd-Frank’s say-on-pay requirement in 2011 focused on remedying ‘excessive’ CEO pay.” [2]
Some of the original economic, governance, and social objectives of this legislation are certainly debatable. However, the proponents clearly intended to reduce CEO pay levels.
After 5 years of SOP votes, it is now possible to review the pre- and post-SOP statistical impact on CEO compensation. With sufficient historical data post-SOP, we answer 2 fundamental questions regarding this legislation’s consequences:
- SOP was implemented to reduce or freeze CEO pay. Pay Governance reviewed broad trends in S&P 500 CEO pay levels pre- and post-SOP to test the impact of this legislation.
- Median S&P 500 CEO pay increased 27% for the 4 years after SOP implementation relative to the 3 years preceding SOP.
- The continued upward trend in median CEO pay post-SOP, combined with shareholder support for SOP averaging >90%, suggest that SOP may have bolstered the executive pay model by documenting broad, transparent shareholder support.
- However, the rate of CEO pay increases at the median of our sample slowed to low single digits post-SOP. While SOP may have influenced this lower increase rate, CEO pay rate increases or decreases have traditionally tracked broader economic factors (eg, CEO pay declined during the pre-SOP financial crisis).
- *While CEO pay increased at the median, the overall distribution of CEO pay compressed. This was indicated by a narrowing ratio between the sample’s 90th and 10th percentiles after SOP implementation.
- Our analysis of year-over-year trends at the top and bottom of the CEO pay distribution indicates that CEO pay at the 90th percentile was generally flat in the post-SOP years, while CEO pay generally increased 2%-13% annually in the rest of the distribution.
- We believe that proxy advisors’ and shareholders’ focus on the highest-paying S&P 500 companies, and the diminished benchmarking of CEO pay to the 75th percentile, may have slowed CEO pay growth at many companies.
- We conclude that SOP did not reduce overall S&P 500 CEO pay levels, but it may have slowed the rate of growth in median CEO pay and has possibly sustained a flat amount of CEO pay at the 90th percentile of the sample.
- For all companies—particularly those with CEO pay at the 90th percentile of the S&P 500—it is important to use executive compensation strategically and creatively to recruit, retain, and motivate executive talent while maintaining strong corporate governance standards.
1) Did the amount of S&P 500 CEO pay decline since SOP (2011)? 2) Does the CEO labor market structure have a more compressed compensation range post-SOP? [3]
SOP implementation increased proxy advisors’ governance impact. These quasi-regulatory bodies have influenced qualitative changes to executive compensation program design over the past 6 years: an increased weight of performance-based stock awards, the use of TSR as a performance metric, the virtual elimination of excise-tax gross-ups on CIC severance, and the increased prevalence of stock ownership guidelines, among others.
However, this viewpoint addresses the most quantifiable potential impact: SOP’s effect on CEO pay opportunity structure and amounts. Our research found that median CEO pay has continued to rise post-SOP. While this continued increase was disappointing to the architect and other advocates of SOP, [4] this was not surprising to corporate directors, executives, and most institutional investors. It is arguably another example of the CEO labor market’s relative competitiveness. Shareholders at a clear majority of companies endorse the labor market: of the >14,000 SOP votes Pay Governance has tracked for major US companies (the Russell 3000) over the past 6 years, only 2.1% failed.
Background
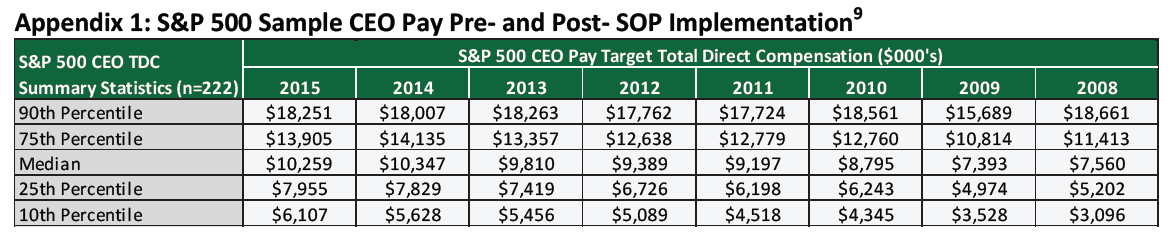
In order to answer the questions above, we assessed CEO pay level trends before and after SOP. Pay Governance assembled a multi-year database of 222 S&P 500 companies for the fiscal years 2008-2015 (3 years of data pre-SOP [first vote in 2011] and 4 years of data post-SOP). [5] We focus our analysis on CEO target total direct compensation because total CEO pay (as disclosed in the proxy) has been—and remains—the primary emphasis of SOP, proxy advisory firms, shareholders, and the media. Our analysis of this large, multi-year data set (summarized below) provides factual data on the recent CEO pay level history, from which we draw conclusions about SOP’s role and influence on the CEO pay market.
Amidst the economic/stock market recovery and many other concurrent governance changes, SOP represented a single—but potentially dominant—corporate governance impact on CEO pay levels. While our findings provide insight into the broad pre- and post-SOP CEO pay market, they cannot isolate the specific impact of SOP. Thus, our summary findings represent a broad historical perspective on CEO pay from 2008-2015, split by the dominant corporate governance shift in 2011: SOP. We then interpret the impact and role that SOP may have had on these findings.
Question 1: Did the amount of S&P 500 CEO pay decline since SOP (2011)?
We examined median S&P 500 CEO pay for the 3 years before SOP (2008-2010) and the 4 years after SOP (2012-2015). Table 1 below indicates that median CEO pay for 2008-2010 was $8M, compared to $10.2M for the 4-year post-SOP period (2012-2015). Thus, total CEO pay post-SOP was 27% above pre-SOP levels.
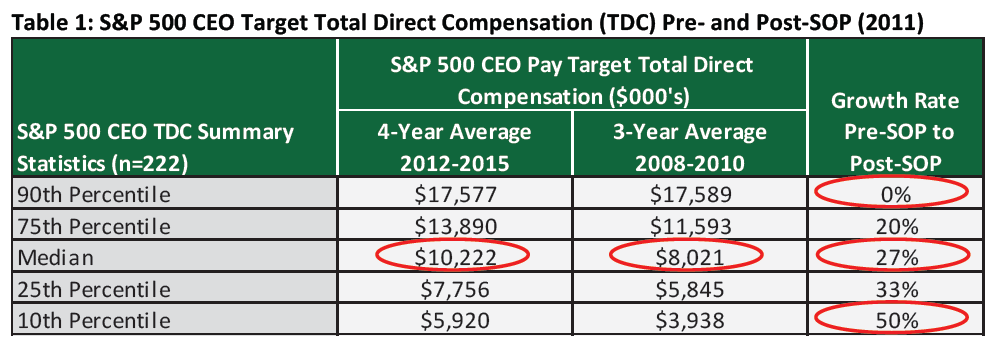
While some commentators may have expected SOP to decrease or flatten median CEO pay among S&P 500 companies, this was not the case. It is not possible to prove that SOP caused the continued increase over the reviewed period or that CEO pay would have increased further had SOP not been in place. However, the continued upward trend in median CEO pay post-SOP occurred simultaneously with high levels of shareholder support for executive pay programs (average SOP support: >90%). The combination of these 2 phenomena suggests that SOP may have bolstered the executive pay model by documenting broad, transparent shareholder endorsement.
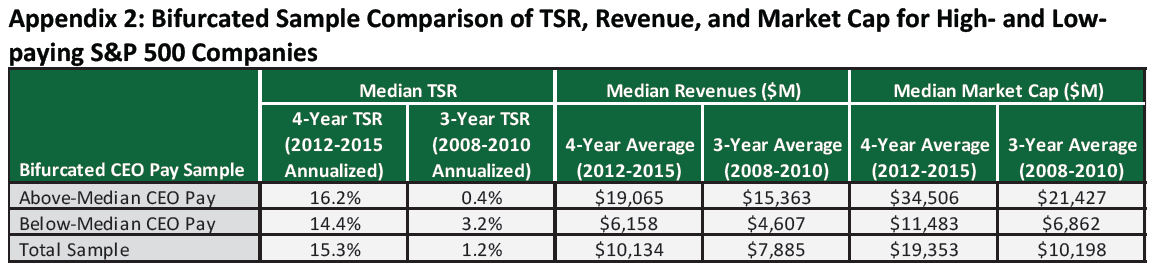
For most companies, TSR post-SOP is significantly above TSR pre-SOP, with a median of 15.3% versus 1.2% on an annualized basis. This higher overall median TSR post-SOP may have provided support for Compensation Committees’ increasing CEO pay levels at most companies based on proxy advisor and institutional investor comparisons of CEO pay and TSR. Nevertheless, it appears that TSR was not a significant factor in the size of individual company CEO pay increases post-SOP. For example, we found that companies in the 90th percentile (which effectively had flat CEO pay post-SOP) had approximately the same TSR as companies in the 10th percentile (which experienced major increases in pay post-SOP). This, as well as the observation that company size measured using revenue scope and market cap were the most significant differentiators of CEO pay levels both pre- and post-SOP, are shown in Appendix 2.
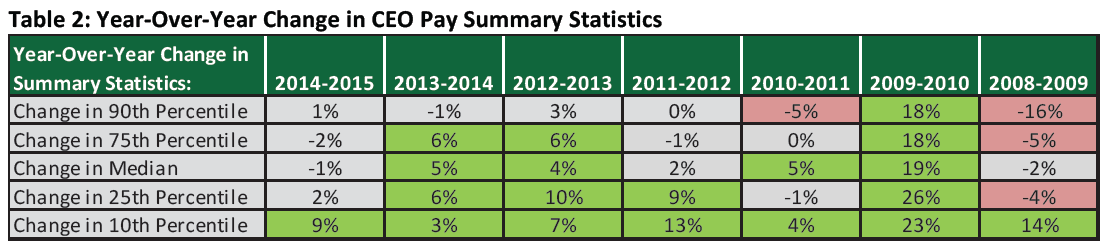
Based on the time period reviewed (2008-2015 in Table 2 below), low single-digit pay increases at the median appear to be lower post-SOP than pre-SOP. However, CEO pay decreased in 2008-2009 during the financial crisis [6] and was reduced dramatically in 2001 when the Tech Bubble burst. These decreases indicate that companies did adjust CEO pay—both up and down—based on company, stock market, CEO labor market, and overall economic events before the regulatory pressure of SOP. We will continue to monitor this issue.
Question 2: Does the CEO labor market structure have a more compressed compensation range post-SOP? [7]
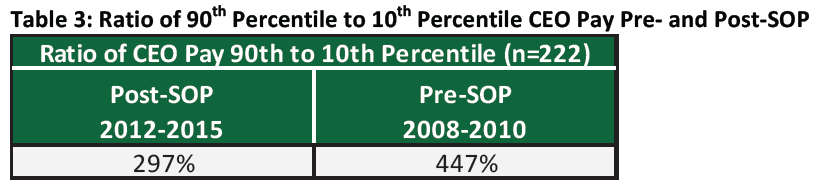
While the trend in median S&P 500 CEO pay levels is clearly up, how did SOP affect the range of CEO pay within the S&P 500? To answer this question, we looked at the compression of CEO pay, measured by comparing the ratio between the 90th and 10th percentiles of the sample for the years pre- and post-SOP. Table 3 below demonstrates that CEO pay was more concentrated in the years after SOP: the ratio between the 90th and 10th percentiles decreased from 447% pre-SOP to 297% post-SOP. This indicates that the lowest-paid CEOs received large pay increases post-SOP and the highest-paid CEOs received effectively zero increases. Thus, while CEO pay increased at the median post-SOP, the extremes of the sample moved closer together after SOP implementation. This is consistent with our consulting experience with very large and often very successful companies. While some advocates may attribute this finding as a SOP success, it may also indicate restricted executive motivation and corporate performance.
We examined year-over-year CEO pay trends at various percentiles of the S&P 500 sample to provide further insight into the observed CEO pay squeeze. Table 2 above shows that, post-SOP, CEO pay generally increased at all levels of the distribution with the exception of the 90th percentile. At the 90th percentile of the S&P 500, CEO pay has generally been flat since 2010. Thus, the shrinking ratio between 90th and 10th percentile CEO pay—shown in Table 3—is being driven primarily by larger CEO pay increases at the lowest-paying S&P 500 companies (the 10th percentile) and stable CEO pay at the highest-paying companies (the 90th percentile).
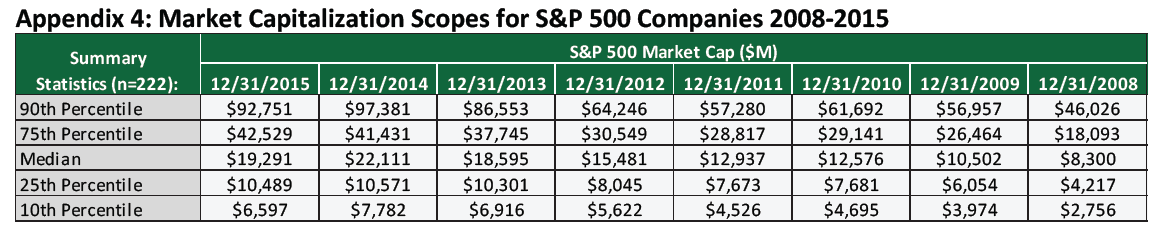
Companies with 90th percentile CEO pay are generally among the largest public companies globally by revenue. Appendix 2 shows that CEO pay opportunity is significantly correlated with company revenue and market cap scope. However, CEO pay at the 90th percentile has remained relatively flat since 2010 despite above-median TSR, a 17% increase in 90th percentile revenue scope, and a 50% increase in 90th percentile market cap between 2010-2015 (see Appendices 3 and 4). Since CEO pay at the 90th percentile did not increase with the substantial increase in scope, SOP implementation and the associated corporate governance changes may have played a role in continuing relatively-flat CEO pay at the 90th percentile of S&P 500 companies.
Based on our consulting experience, there may be many reasons for this compression:
- Due to the rigid structure of the proxy advisors’ P4P tests, higher-paying companies—even if larger than most economic peers—are more at risk of an “against” recommendation from proxy advisors and, thus, SOP challenges. This can occur, and has occurred, at long-term high-performing companies that have experienced a temporary dip in relative TSR performance and have been pressured to freeze CEO pay. To the extent that this occurs, the regulatory framework of SOP may restrict the use of incentive compensation and labor market efficiencies.
- Additionally, proxy advisors’ ongoing criticisms of pay-benchmarking philosophies above an industry peer group’s median have made this practice uncommon in the SOP environment. Thus, some of the largest and highest-paying companies in the S&P 500 now benchmark executive pay against the median of peer groups that may be different in scope, industry, and business model, potentially resulting in lower year-over-year increases in CEO pay.
- However, companies below the median of the S&P 500 sample—especially the 10th percentile—experienced relatively large pay increases. This could be because they had a wider selection of industry peers and could benchmark CEO pay to the median of an appropriately-sized industry peer group, which may have been higher than their current CEO pay level.
- Recent memos by prominent institutional shareholders have indicated a focus on the absolute quantum of CEO pay when those investors cast their SOP votes. This heightened focus, they argue, is justified by the income inequality debate and the associated company reputational risk of “excessive” CEO pay. One memo clarified screening criteria, focusing on the absolute quantum of CEO pay for companies paying their CEOs significantly above the average for Dow 30 companies. In our sample, this level of pay would generally be included in the top 10% of highest-paid CEOs. [8]
- Alternatively, the recent relatively flat pay at the high end of the S&P 500 sample could indicate a steady-state for top talent among the largest public companies in the US and globally. If correct, this could be an advantage for private companies in the short-term.
Conclusions
The data reviewed in this viewpoint provide useful context for the post-SOP CEO pay environment. We found that CEO pay continued to increase after SOP—possibly at a slower rate than historical CEO pay increases—and that CEO pay distribution was narrower after SOP than it was before shareholder voting on executive compensation was implemented.
These findings are generally consistent with our intuitive understanding of the CEO pay market post-SOP. SOP implementation as well as the increased attention by shareholders and proxy advisors on the highest-paid S&P 500 CEOs may have continued a moderating effect on the 90th percentile of the S&P 500 CEO pay market. In contrast, the rest of the CEO pay distribution experienced ongoing pay increases as companies in the lower 3 quartiles increased pay to compete for top corporate management talent.
For all companies, but particularly those companies with CEO pay opportunity levels at the higher end of the S&P 500, continued monitoring of the pay market remains important. To the extent that SOP may have constrained the market for CEO talent of these highest-paying companies, the focus will continue to be on strategically and creatively using executive compensation in order to balance the tension: motivating executive talent while maintaining strong P4P linkage and corporate governance standards.
Appendix

Endnotes
1Lynn Turner. As cited in: Lisa Zagaroli. “Will financial crisis give shareholders a say in exec pay?” McClatchy. January 8, 2009. http://www.mcclatchydc.com/news/article24522490.html.(go back)
2Michael Bauch. “Executive Pay: How Much Do Shareholders Really Care?” Investopedia.http://www.investopedia.com/articles/personal-finance/112013/executive-pay-how-much-do-shareholders-really-care.asp.(go back)
3We define CEO pay compression as the convergence of CEO pay distribution. In this post, we measure compression by comparing ratio changes between research sample’s 90th and 10th percentiles.(go back)
4Ross Kerber. “Dodd-Frank co-author disappointed on pay votes, cites fund managers.” Reuters. March 27, 2015. http://in.reuters.com/article/ceo-pay-barneyfrank-idINL2N0WR16B20150327.(go back)
5Our sample was limited to 222 companies to ensure data continuity for all sample companies across several consolidated databases. Data were provided using Equilar.(go back)
6Equilar. “2009 and 2010 CEO Pay Strategies Reports.” 2009 and 2010. www.equilar.com.(go back)
7We define CEO pay compression as convergence in CEO pay distribution. In this post, we measure compression by comparing ratio changes between the 90th and 10th percentiles of the research sample.(go back)
8State Street Global Advisors Worldwide Entities. “Guidelines for Mitigating Reputational Risk in C-Suite Pay.” June 1, 2016. https://www.ssga.com/investment-topics/general-investing/2016/Guidelines-for-Mitigating-Reputational-Risk-in-C-Suite-Pay.pdf.(go back)
9The sample used for this analysis is different than the S&P 500 CEO sample used for Pay Governance’s recent viewpoint, “S&P 500 CEO Compensation Increase Trends,” which excludes CEOs that were not in their roles for at least 3 years. We note that both samples indicate similar median CEO pay levels and year-over-year changes.(go back)