 Print
PrintAnnalisa Barrett is a clinical professor of finance in the University of San Diego School of Business and the founder and CEO of Board Governance Research LLC; and Jon Lukomnik is Executive Director of the Investor Responsibility Center Institute (IRRCi). This post is based on an IRRCi publication by Professor Barrett and Mr. Lukomnik.
This post examines age diversity within the boards of the companies in the S&P 500. At a time when board refreshment of public companies and director diversity, or lack thereof, is a key concern of companies, investors and others, the dispersion of age within the board has largely been ignored. Therefore, this analysis examines the age diversity of boards with analyses by industry, company size (market capitalization), and company age (years since the company’s initial public offering). We also consider the number of age groups (defined by decades) represented on each board.
Key findings include:
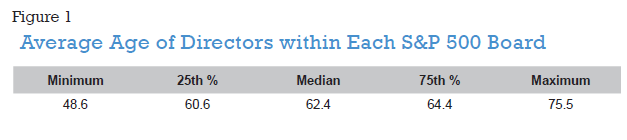
- There is little dispersion in the average age of directors between different S&P 500 company The average age of all boards was 62.4. Looking at the variance, fewer than 25% of companies had an average age of the board as a whole of less than 60.6 years, and fewer than 25% of all companies had an average age of the board as a whole of more than 64.4 years.
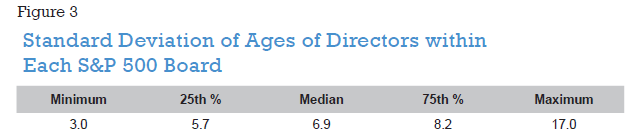
- Within individual boards, more than half (55%) of the S&P 500 boards have three decades represented on their boards, most commonly directors in their fifties, sixties and Looking at the standard deviation of the average board reveals a tighter cohort. The median standard deviation of ages at S&P 500 company boards was 6.9 years, and 50% of all boards had a standard deviation of dispersion of between 5.7 and 8.2 years.
- In general, board age diversity does not vary significantly by company size, or by industry segment. Information technology firms do have the youngest median board age at 3 years, but that is only about a year less than the median of all S&P 500 firms. Real Estate firms boast the oldest median board age, at 63.4 years, a year more than the index median.
- Boards in the Information Technology industry have the most age diverse boards (a standard deviation of 8.1 years), while Utilities companies have the least age diverse boards (standard deviation of 6.1 years).
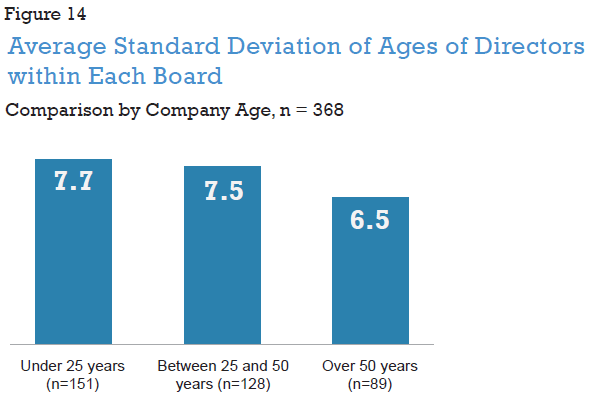
- Companies which have been publicly-traded for more than 50 years have the least age diverse boards (standard deviation of 6.5 years, compared to the index average of 7.2 years).
- Directors who have served on their respective boards for less than three years are, on average, 7 years younger than directors who have been on their respective boards longer than 10 years.
- The vast majority (77%) of the directors studied with tenures over ten years joined their respective boards when they were in their forties or fifties.
- More director turnover, as measured by the number of director changes made between 2014 and 2016, did not result in more age diverse boards in most
The Diversity Conversation
Diversity in the corporate boardroom continues to be the topic of many conversations, conference panels and studies. However, the diversity of ages within each corporate board had not been analyzed until this report. Presumably the benefits of having a board which includes people from different age groups would be similar to benefits of other types of board diversity. People from different age groups bring different life experiences and perspectives to the important work done by corporate boards.
Previous studies had shown that directors are typically in their mid-sixties; that there are a significant number of directors in their seventies and eighties; and that there are very few people under the age of 40 serving on boards. For example, a recently-published study conducted for IRRCi by Institutional Shareholder Services on board refreshment trends over the last eight years examines the ages of directors serving on S&P 1500 boards as a group and finds that nearly three-quarters (73.6%) of S&P 1500 directors are in their fifties and sixties. [1]
In this post, we examine the age diversity of S&P 500 boards by industry, company size (market capitalization), and company age (years since the company’s initial public offering). We also consider the number of age groups (defined by decades) represented on each board.
Discussions of board “refreshment” have focused on replacing departing directors with candidates who bring more diversity to boards. One question addressed in this post is whether the current pattern of director replacement has increased the age diversity of the boardroom. In order to analyze this more granularly, we selected on a subset of the S&P 500 which includes the five largest companies in each of the 11 GICS industry sectors.
Age Dispersion within S&P 500 Boards
Average Age of Individual Boards
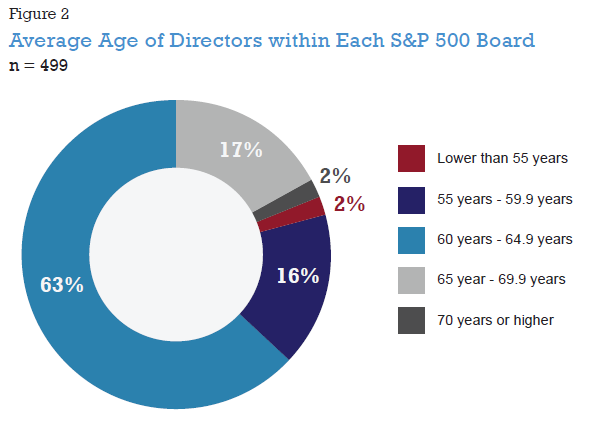
The average age of individual boards reflects a general assessment of the ages of the directors serving on that board. The table below presents information regarding the average ages of the boards of S&P 500 companies (Figure 1). [2] Not surprisingly, most (80%) of the boards have an average age in the sixties, with a range from the late forties to the mid-seventies. The outliers are truly outliers, however. Fewer than 2% of S&P 500 boards had average ages of more than 70 or less than 55 (Figure 2).
Standard Deviation of Ages of Directors Serving on Each Board
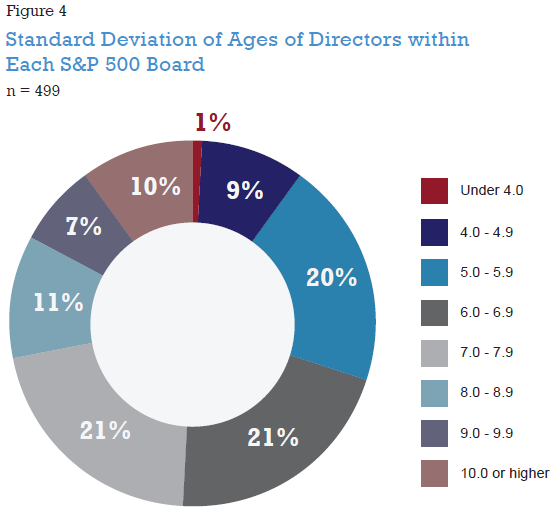
The dispersion of the ages for each board was determined by calculating the standard deviation of the ages of the directors within each board. The median standard deviation of the director ages on the boards studied was 6.9 and the average standard deviation was 7.2 (Figure 3). Most (62%) S&P 500 boards include directors with a standard deviation of ages between 5 and 8 (Figure 4).
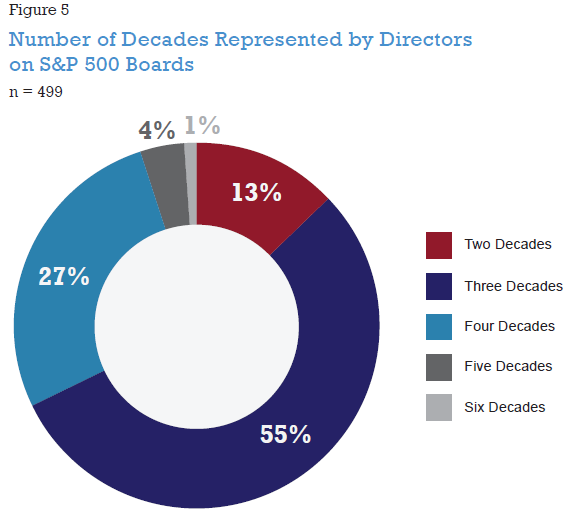
Number of Decades Represented on Board
In addition to average and standard deviation, we also examine ages on each board by considering how many people of different age groups are represented in each board room. For the purposes of this analysis, the age groups used were defined by decades (i.e., directors in their forties, fifties, sixties, etc.). While, we acknowledge that all people the same age do not think alike or share the same experiences and backgrounds, such an analysis does demonstrate whether an individual board is comprised of a tight age cohort or of directors with a variety of ages.
As shown in the chart below (Figure 5), most (55%) of S&P 500 companies have three decades represented on their boards. Very few (5%) of S&P 500 companies have five or six decades represented on their boards. None of the boards studied have directors who all have ages in the same decade.
Among those boards that have three decades represented, those three decades are the fifties, sixties and seventies at more than three-quarters (80%). When four decades are represented, a similar percent of those boards (76%) have directors in their forties, fifties, sixties and seventies.
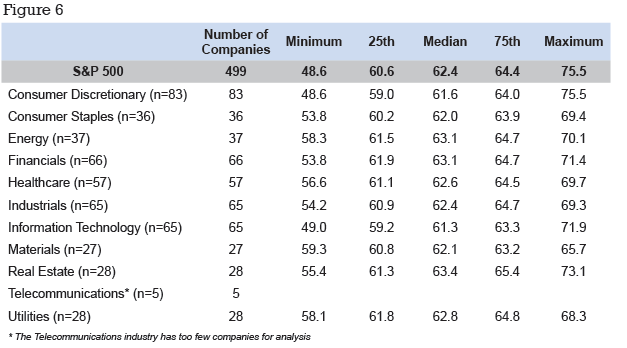
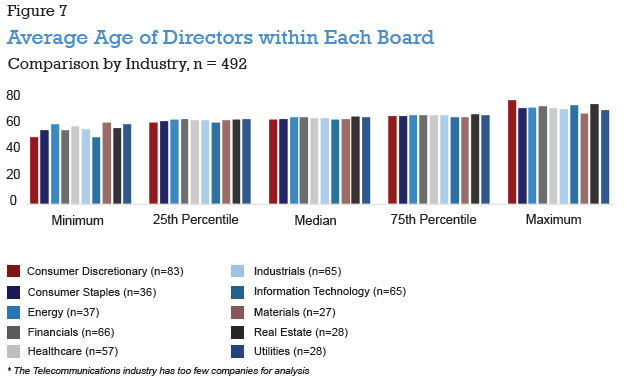
Analysis by Industry
We broke down the S&P 500 by industry, based on GICS Sector codes, in order to assess any differences in board age diversity between industries. [3] Somewhat counterintuitively, the table and chart below (Figures 6 and 7) show that there is little difference in average board age across industries. The Consumer Discretionary and Information Technology industries do have the youngest median average age and the youngest minimum average age when compared to the other industries, but the differences are minimal. In general, boards in different industries have similar average individual board ages.
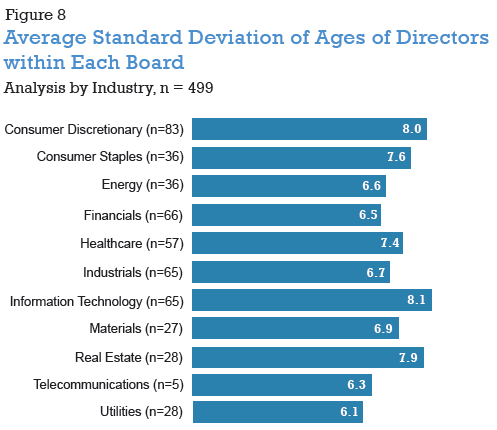
Information Technology companies have the most age dispersion within their boards; Consumer Discretionary and Real Estate round out the three most age diverse industries. The lowest average standard deviation of director ages is found among the boards of the Utilities industry (Figure 8).
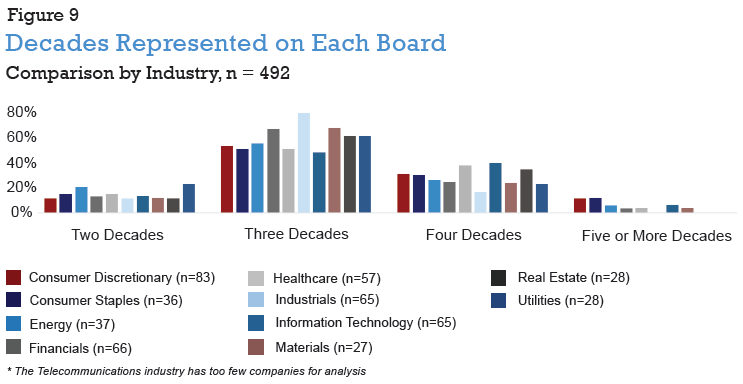
Consistent with the dispersion analysis, Information Technology boards are also the most likely to have four decades represented in their board rooms (Figure 9). However, it is also notable that—while the numbers are low—the Consumer Discretionary and Consumer Staples boards have the most companies with five or more decades represented. At the other extreme, boards in Utilities industry are the most likely to have the least age diversity, with the most companies with only two decades represented.
Analysis by Company Size
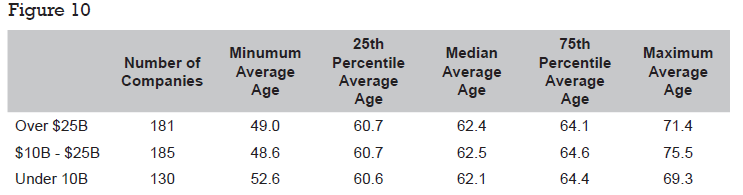
There is very little difference in the average age of the directors on boards when compared by company size. In fact, the 25th, 50th (median), and 75th percentiles are nearly the same for all three company size categories, though the smaller companies in the S&P 500—those under $10 billion in market capitalization—appear to have a tighter range of average ages overall (Figure 10).
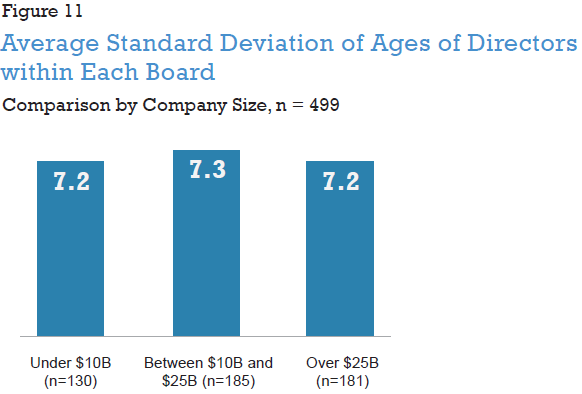
The dispersion of director ages within the boards of larger companies is not much different than that of smaller companies. As shown in the following chart, the average standard deviation is nearly the same for each of the three company size categories analyzed.
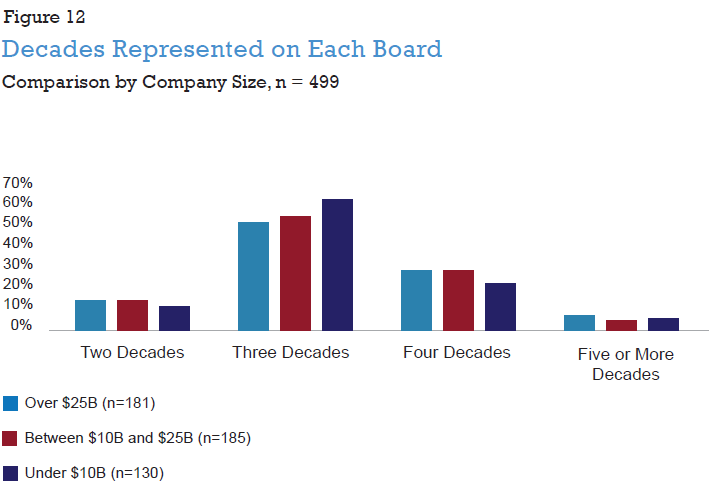
The number of decades represented on each board is the only analysis that shows a slight difference by company size (Figure 12). The ages of the directors serving on the boards of the smaller S&P 500 companies (under $10 billion in market capitalization) are more likely to be spread over three decades when compared to the larger companies in the index. Additionally, the largest S&P 500 companies (with more than $25 billion in market capitalization) are slightly more likely than the smaller companies in the index to have five or more decades represented on their boards.
Analysis by Company Age
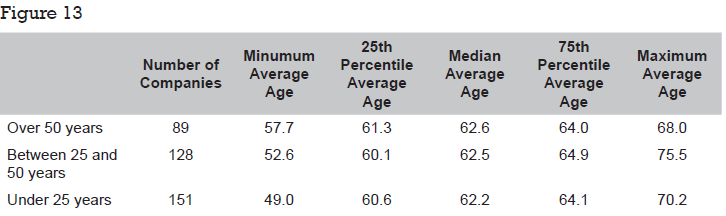
In order to determine whether age diversity varies by company age, we analyzed the data examining the number of years since the company’s IPO. [4] Company age was available for 368 of the S&P 500 companies for purposes of this analysis.
The table (Figure 13) and chart (Figure 14) below show that relatively newer companies (i.e., companies that went public less than 25 years ago) have boards with a slightly wider distribution of average ages than do the older companies in the S&P 500. However, the differences are minor; the overall finding is that the boards of companies of all ages have generally similar average ages on their boards.
However, the chart below shows that companies in the oldest company age category, having gone public more than 50 years ago, have the lowest age dispersion within their individual boards. The companies which have been publicly-traded for less than 25 years have the highest dispersion of director ages.
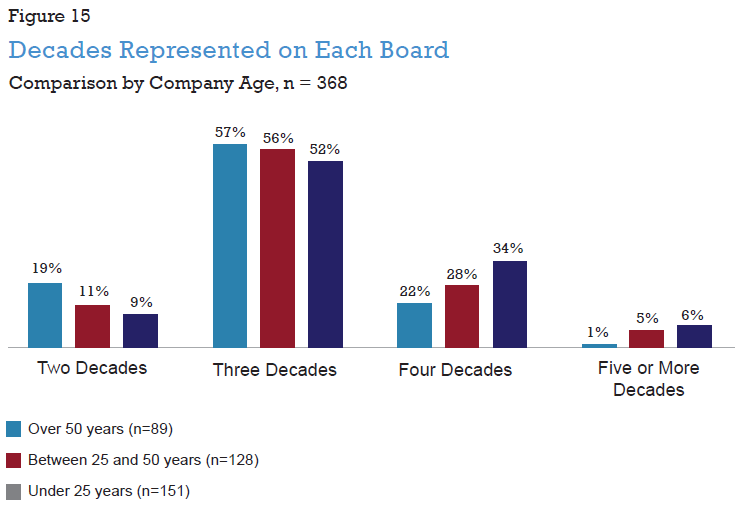
Older companies also have a higher proportion of companies which have representatives from only two decades in their boardrooms. The relatively younger companies are more likely to have more age diverse boards, with the highest proportion of companies with representatives from four or more decades in their boardrooms (Figure 15).
Board Age Diversity and Director Tenure
Director Tenure
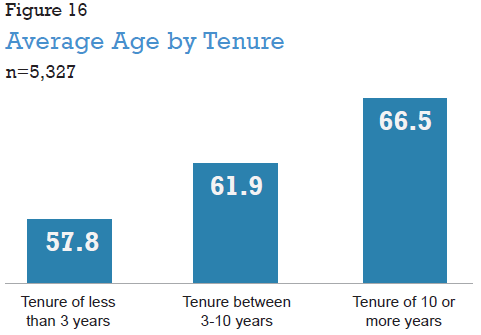
Examining the relationship between the average ages of the directors serving on S&P 500 boards and the number of years they have served on their respective boards not surprisingly found a correlation. Directors with longer tenures are older. Specifically, as shown in the chart below (Figure 16), directors who have been on their board for fewer than three years are, on average, 8.7 years younger than directors who have served on their boards for more than ten years (57.8 years and 66.5 years, respectively). [5]
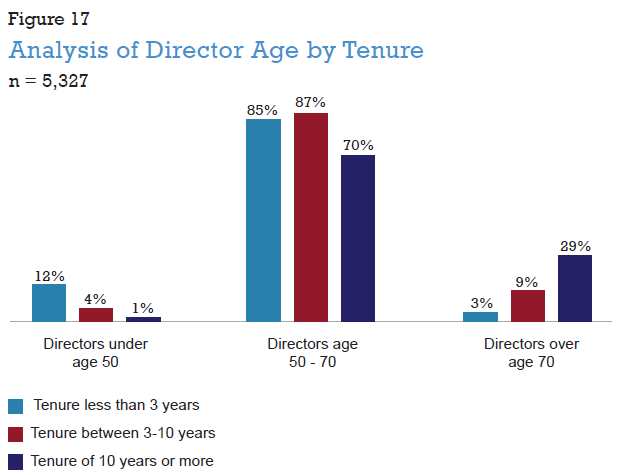
Further analysis finds that directors with shorter tenures tend to be younger than typical directors, while directors with longer tenures tend to be older. As the chart below shows (Figure 17), directors who have served on their boards for less than three years are the most likely to be under age 50, while directors who have served on their boards more than 10 years are the most likely to be over age 70.
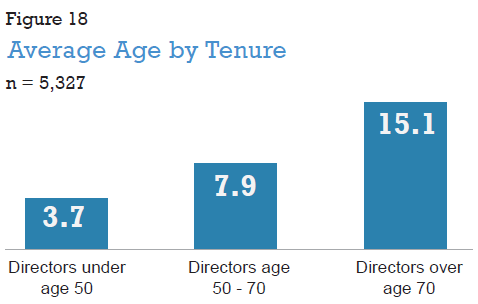
The chart below (Figure 18) presents the findings from an analysis of director tenure by director age range. Similar to the findings above, we see that older directors tend to have served on their respective boards for much longer than have younger directors. On average, directors over the age of seventy are 11.4 years older than directors who are not yet fifty years old (with tenures of 15.1 years and 3.7 years, respectively)
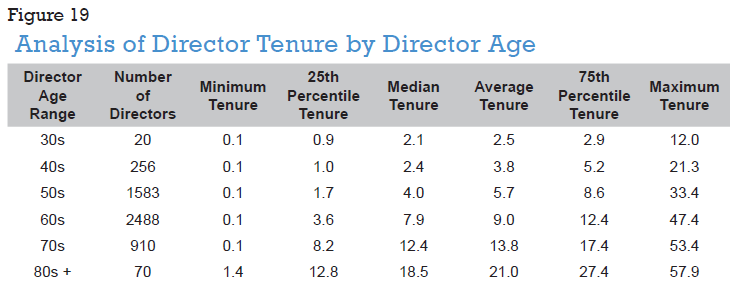
However, as the table shows (Figure 19), many younger directors have already served on their boards for many years. For example, one quarter of the directors in their forties have served on their boards for more than 5.2 years and one quarter of the directors in their fifties have served on their board for more than 8.6 years.
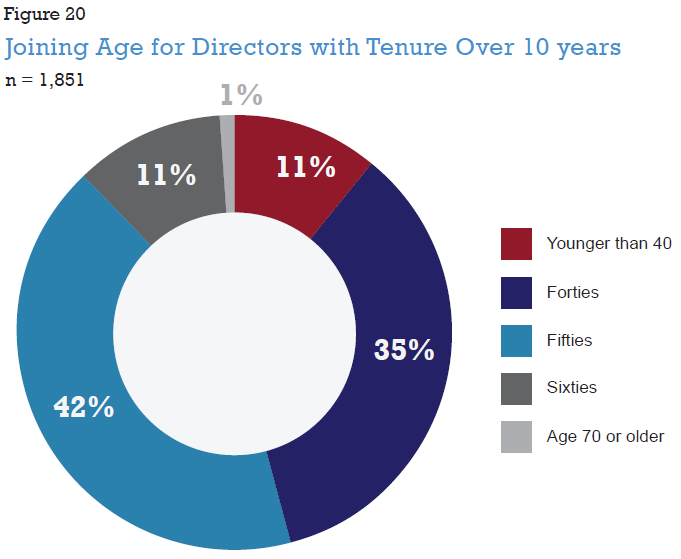
One of the concerns sometimes raised when a board considers the addition of a younger director is that it will lead to a situation where that director could serve on the board for a long time. [6] With institutional investors increasingly voicing concern about the independence of long-tenured directors, boards are sometimes hesitant to nominate a younger director if he or she may serve on the board for several decades.
In order to provide context on this issue, for those directors with tenures over ten years we examined the age at which they joined their current board. As shown in the chart below (Figure 20), the vast majority (77%) of the directors who currently have a tenure of more than 10 years on their respective boards joined those boards when they were in their forties or fifties.
Board Age Diversity and Director Turnover
Director Turnover
We also conducted an in-depth analysis of director changes within boards to explore whether an increase in director turnover increases the age diversity of boards by examining the impact of director changes on board age diversity for a subset of the S&P 500. This subset, which includes 55 companies, was constructed by selecting the five largest companies (measured by market capitalization) in each of the 11 GICS Sectors.
For each of the companies in the subset, we analyzed the ages of directors who joined or left each board between each company’s 2014 and 2016 proxy filings. The resulting changes in the dispersion of ages within each board during this timeframe were also examined. For purposes of this analysis, turnover is measured as the number of director changes (additions or departures) during the 2014-2016 timeframe. (Three of the companies in the subset did not make any director changes during this time.)
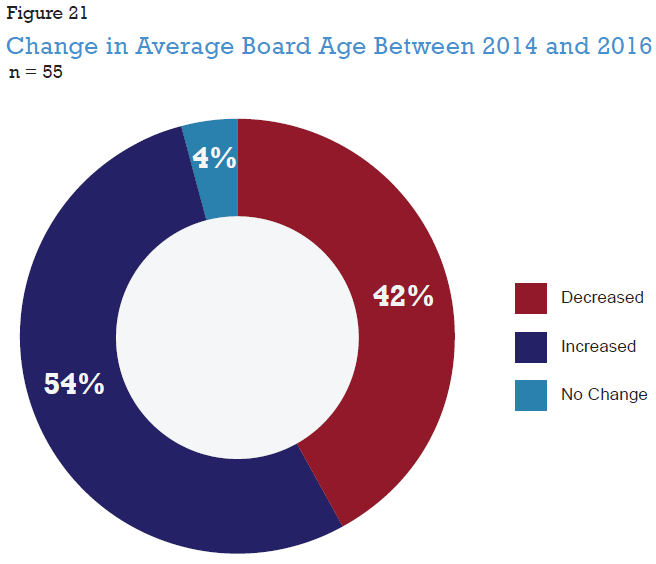
Change in Average Board Age
Nearly half (42%) of boards had a lower average age in 2016 than in 2014 (Figure 21). This decrease in average board age indicated that director turnover at those companies led to younger boards.
Changes in Board Age Dispersion
The finding above begs the question: Does more director turnover result in a more age diverse board? Do the boards that have the most director changes also have the largest changes in the dispersion of the ages of the directors within each board?
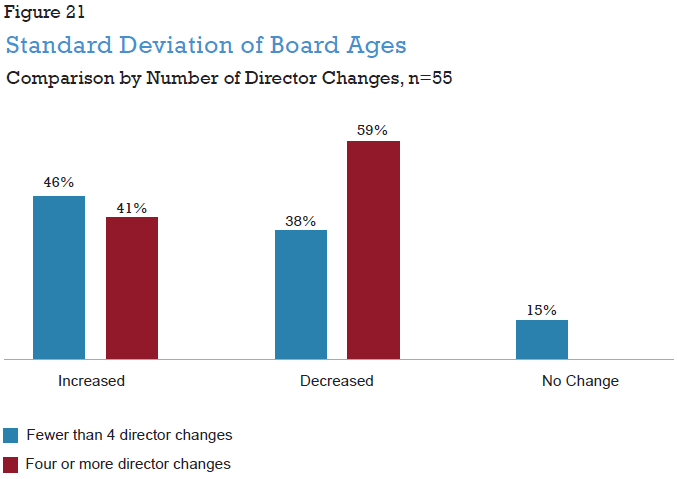
We analyzed the changes between 2014 and 2016 in the standard deviation of the ages of the directors on each of the 55 boards in the subset of the S&P 500. The boards were divided in to two categories: those which had fewer than four director changes in the timeframe studied, and those which had four or more director changes.
As shown in the chart below (Figure 22), nearly half of both categories—46% of the companies which had fewer than four director changes and 41% of the companies which had four or more director changes—saw an increase in age diversity. Somewhat counterintuitively, companies with fewer than four director changes were more likely to have an increase in the dispersion of the ages of their directors than were the companies with four or more director changes. In other words, more director changes between 2014 and 2016 did not lead to more age diversity among the companies studied.
Endnotes:
1Institutional Shareholder Services, “Board Refreshment trends at S&P 1500 Firms: 2008 to 2016”, January 2017, discussed on the Forum here.(go back)
2The study includes 499 of the S&P 500 companies because Fortive Corporation had not yet filed a 10K or proxy statement as a stand-alone company (after having spun-off from Danaher Corporation in July 2016), as of the researching of this report.(go back)
3The GICS Sectors were provided by Bloomberg in October 2016; GICS Sectors were not available for two S&P 500 companies because they were acquired prior to the retrieval date.(go back)
4A suggestion for further research would be to conduct a similar analysis by using the company’s founding date rather than its IPO date to calculate company age, since some directors (especially founders) may have been with the firm since its pre-IPO stage.(go back)
5Tenure data was available for 5,327 S&P 500 director seats.(go back)
6For a further discussion of board refreshment, independence and diversity, please see Institutional Shareholder Services, “Board Refreshment trends at S&P 1500 Firms: 2008 to 2016”, January 2017, discussed on the Forum here.(go back)