 Print
PrintLes Brorsen is EY Americas vice-chair for public policy. This post is based on an EY publication by Mr. Brorsen, David Brown, Jeff Grabow, Chris Holmes, and Jackie Kelley.
Public market trends: US companies get bigger, more stable
US listings dropped after the dot-com bubble, but the market has largely stabilized, and US public companies today are much larger than in the past.
During the dot-com peak in 1996, US listings hit a record high of more than 8,000 domestically incorporated companies listed on a US stock exchange with an average market capitalization of $1.8b in today’s dollars. The number of domestic US-listed public companies decreased precipitously through 2003, with almost 2,800 companies lost because of M&A activity and delistings. By 2003, there were 5,295 domestic US-listed companies. The loss of domestic US-listed companies in 1996–2003 represents 74% of the loss from 1996 to date. (See figures 1 and 2).
Figure 1: Change in the number of US public companies
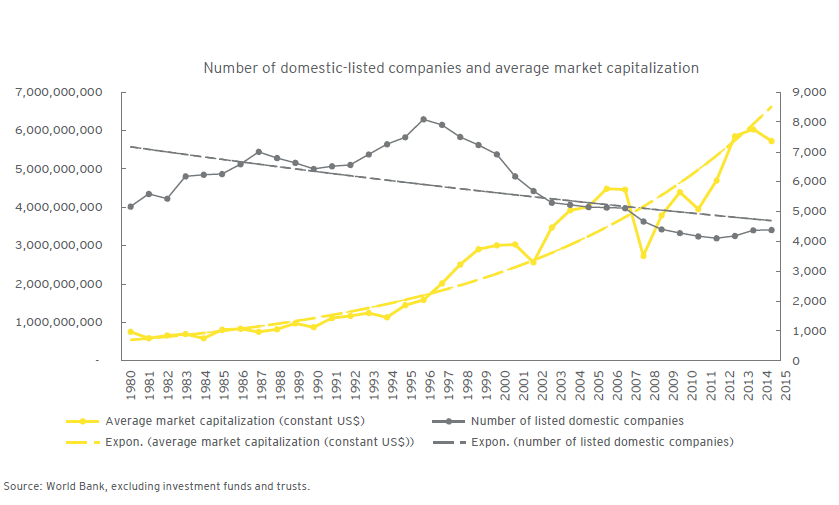
Source: World Bank, excluding investment funds and trusts.
Since the 2008 financial crisis, the total number of domestic US-listed companies has largely stabilized again, ranging between 4,100 and 4,400. During this same period, foreign companies listed on US exchanges have steadily increased in number. (See figure 2.)
Figure 2: Domestic and foreign US public companies
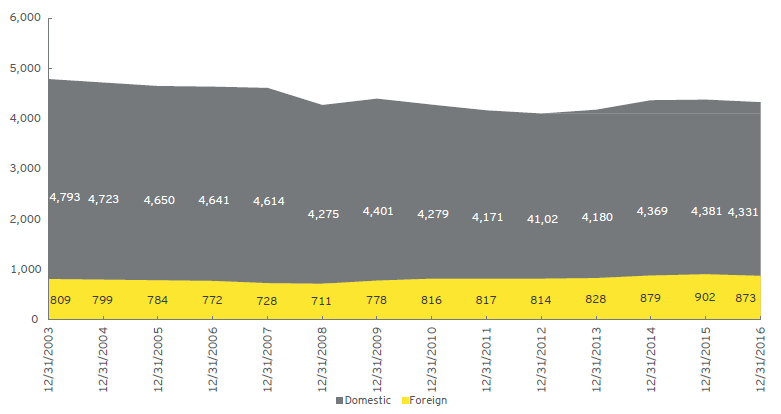
Source: World Federation of Exchanges, excluding investment funds and trusts.
Public companies have also grown in size. A typical domestic-listed company today has a higher market capitalization than in the 1990s, a trend that has accelerated in recent years (See figure 1.) As of early 2017, the average market capitalization of a US-listed company is $7.3b, and the median is $832m. Also, the largest 1% of US public companies represent 29% of the total market capitalization. About 140 companies now each exceeds $50b in market value, representing more than half of the total US market capitalization.
“The U.S. Listing Gap,” a June 2016 academic study using listing data from major exchanges from 1975 to 2012, highlighted some of the delisting trends beginning in the 1990s due to the dot-com bubble. Table 4, Panel A of the study reveals that following the dot-com peak, 2,101 companies were “delisted for cause” over the next seven years (1997–2003), unable to meet the listing standards of their exchange; an average of 300 companies a year. From 2003 to 2012, for-cause delistings fell to fewer than 100 per year. —Doidge C., Karolyi G.A., & Stulz RM. The U.S. Listing Gap. Discussed on the Forum here.
IPO trends: keeping sight of the big picture
US IPOs are down from their peak in the 1990s, but companies conducting a US IPO today are raising more money than ever before, and more foreign companies executing cross-border listings choose to list in the US, compared with anywhere else in the world.
Public stock offerings of high-profile companies often gain intense public attention, but IPOs are just one of many options for emerging companies to attract investors. While IPO activity has increased after the 2008 recession, the number of public offerings has remained well below its mid-1990s levels. Among other factors, the growth of robust private investment markets and alternative financing methods has extended the private financing stage of the corporate life cycle.
In 2014, the number of US IPOs soared to 291 (see figure 3), the highest level since 2000, while the total amount of capital raised through IPOs hit a record of $96b. However, 2015 and 2016 were down years for the IPO market. In 2016, there were only 112 completed IPO deals, raising a total of $21b.
Figure 3: US IPO market 1991–2016
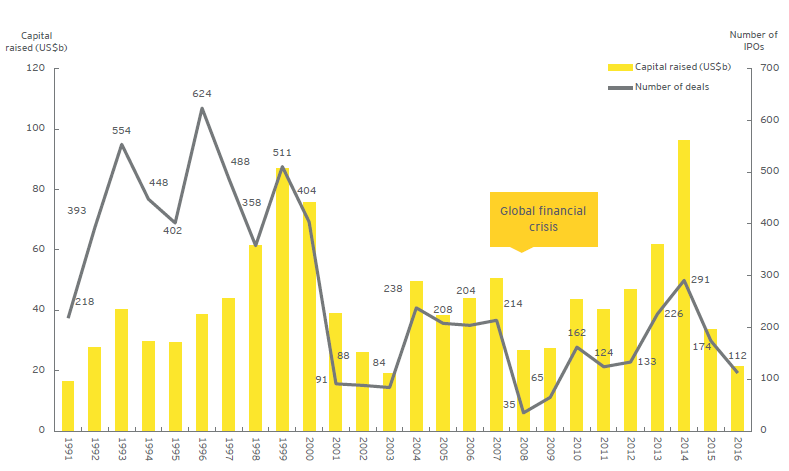
Source: Dealogic and EY analysis
Based on IPO activity on US exchanges, including cross–border deals; excludes special purpose acquisition companies (SPACs) and business development companies (BDCs).
Why the decline in US IPOs in 2016? Market analysts point to a number of contributing factors, including an early 2016 market correction (i.e., increased equity market volatility) stemming from historically high market valuations and uncertainty associated with the US elections, interest rates and global macroeconomic issues. Additionally, the availability of private capital allowed many companies to be more selective with the timing of their IPOs as markets were less stable.
Cross-border listing trends: US exchanges are the destination of choice
We believe it is important to recognize that the US remains the most attractive public equity market in the world. Stock exchanges are located in all regions of the world, and over the long term, more than 90% of IPOs occur on an exchange in the company’s home country. (See figure 4.) The common reasons for home-country bias include a strong base of customers or a growth strategy that focuses on the home market, a future investor and analyst base located in the home market, a higher comfort level with home-country regulation and compliance standards and cultural identity.
Figure 4: Historically, over 90% of IPOs have listed on their domestic exchanges, and the trend continues
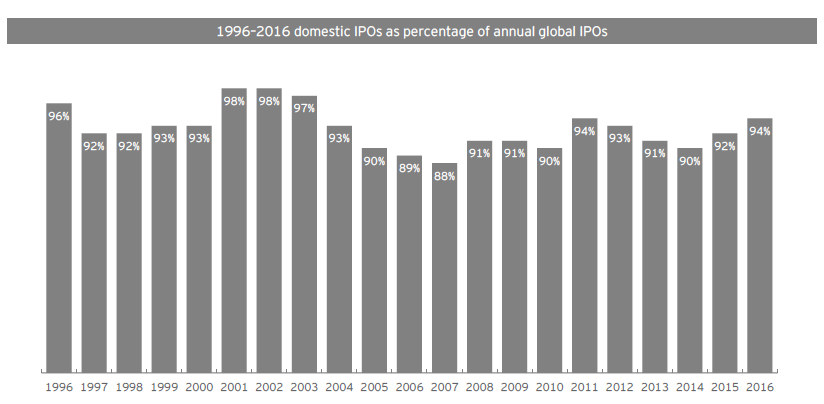
A foreign listing is where the domicile of the primary exchange (or the secondary exchange for dual listings) differs from the listed company domicile. Deals by Chinese companies on Hong Kong Stock Exchange (HKEx) are not considered foreign listings.
Source: Dealogic, Thomson Financial, EY research.
It is also important to note that the profile of US IPOs has changed fundamentally over the past two decades. Although there are fewer offerings, today’s US IPOs are fundamentally more stable and are raising more capital. At the 1996 peak, 624 US IPOs created $38b in total deal volume, averaging $61m. From 2012 to 2016, there were fewer than 300 IPOs per year, but average annual IPO proceeds exceeded the 1996 peak. Investors are putting more money into emerging companies, and those companies are likely to be more stable than in the past, as evidenced by the drop in delistings post-2008.
This trend toward IPOs of higher-quality, more sustainable companies is likely to benefit investors. Research provides strong evidence that IPO companies with higher levels of revenue perform better in the long run. Among IPOs completed from 1980 through 2014, issuers with annual revenue over $500m slightly outperformed the market. By contrast, issuers with annual revenue under $100m underperformed the market by an average of more than 27%.
The IPO outlook for 2017–18
After two weak years, signs point toward a rebound in the IPO market. So far in 2017, there has been an uptick in IPO activity, with several high-profile US companies choosing to go public given strong market conditions. That trend may continue with the robust pipeline of companies in venture capital and private equity portfolios seeking their next round of funding.
Issuers have begun pricing IPOs again in April 2017, and volumes are expected to ramp up significantly in the historically busy second-quarter window of May and June. Market and deal performance over the second quarter will influence issuer and investor appetite for the second half of the year and will greatly inform the deal outlook through year-end 2017 and into 2018. Financial sponsors continue to view the IPO market as a useful option on the path to exits, and their portfolio companies will continue to be a key source of IPO deal flow.
There is increased anticipation for listings from a number of start-ups with $1+ billion valuations, also known as unicorns, but most still have the luxury of picking the right timing based on their specific circumstances. As such, there is unlikely to be a long parade of unicorn listings in 2017. However, it would not be surprising to see several high-profile names pursue their much-anticipated IPOs if market conditions remain strong.
For foreign companies choosing to execute a cross-border listing, the US is the favored market. From 2012 through 2016, the US was home to almost twice as many foreign IPOs as its closest competitor, the United Kingdom. During the same time frame, US IPO volume from cross-border listings totaled $66b, more than four times as high as British cross-border IPO volume of around $12b. It’s clear that when a company decides to execute a cross-border listing, their market of choice is usually the US. (See figure 5.)
Figure 5: Among the key global IPO markets, the US IPO market attracted more cross-border IPOs in 2016
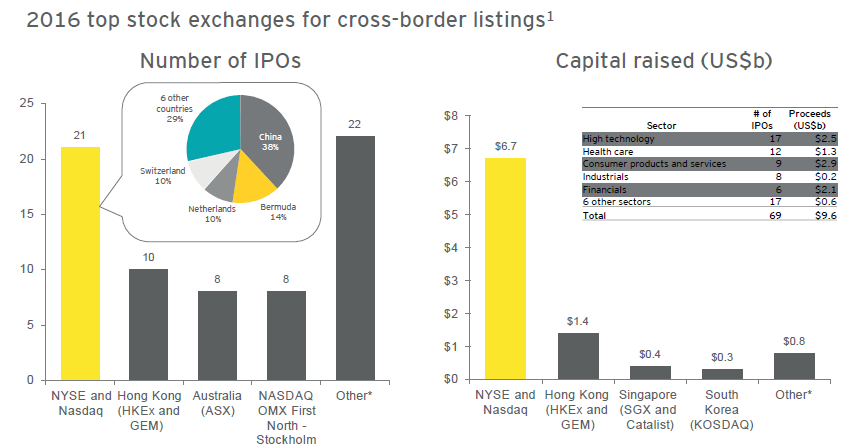
1 A foreign listing is where the domicile of the primary exchange (or the secondary exchange for dual listings) differs from the listed company domicile. For dual listings, all funds are allocated to the primary stock exchange. Deals by Chinese companies on HKEx are not considered foreign listings.
* Other cross-border IPOs by number of deals include: London (LSE & AIM) – 7; KOSDAQ – 6; Deutsche Borse — 3; Singapore (SGX & Catalist) — 3; Asia Pacific Exchange (APX) — 1; Bourse des Valeurs d’Abidjan (BRVM) — 1; Euronext (Paris) — 1. Other cross-border IPOs by capital raised (US$m) include: NASDAQ OMX First North — Stockholm — $224; Australia (ASX) — $178; Deutsche Borse — $149; London (LSE & AIM) — $131; Bourse des Valeurs d’Abidjan (BRVM) — $63; Euronext (Paris) — $37; Asia Pacific Exchange (APX) — $3. eSource:Dealogic, EY research
US companies, meanwhile, rarely list elsewhere. (See figure 6.) From 2012 to 2016, only 18 US-domiciled companies listed exclusively on foreign exchanges, raising only $1b collectively. In 2016, only two US IPOs listed exclusively on foreign exchanges. Overseas listings also tend to be smaller. Over 15 years, 73% of the 90 US companies that listed abroad raised less than $50m, well below the US non-accelerated filer and smaller reporting company thresholds of $75m in public float.
Figure 6: Very few US companies are listing abroad
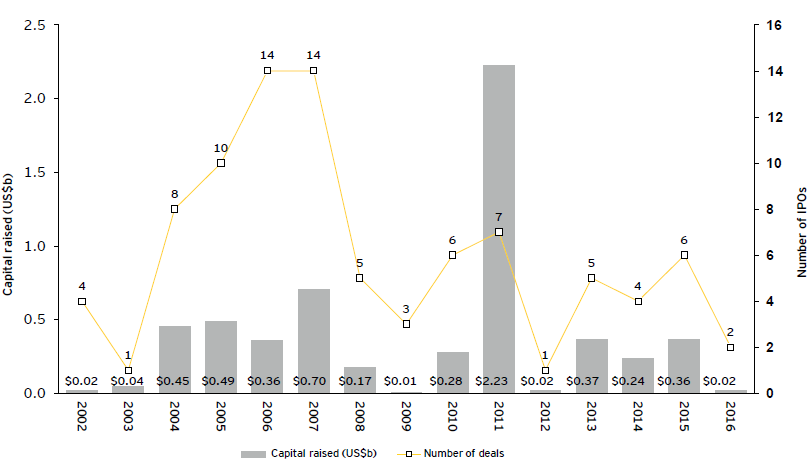
Based on IPO activity on non-US exchanges by US-domiciled companies, excluding dual listings.
Source: Dialogic.
Private market trends: multiple options for growing companies
“Why are more companies staying private, and for longer? Because they can.”
Testimony from Glen Giovannetti, EY Global Biotechnology Leader, before the Securities and Exchange Commission’s Advisory Committee on Small and Emerging Companies.
The private capital market has grown aggressively recently, allowing emerging companies to access more capital without going public.
To accurately measure the health of US capital markets, it is crucial to consider the availability and impact of private capital. Venture capital firms and private equity funds are aggressively financing emerging companies, with the healthy supply of private capital potentially delaying the timing for public offerings. In some cases, emerging companies are being acquired by strategic and financial buyers rather than going public. Venture capital and private equity firms as well as sovereign wealth funds have large amounts of capital to invest. Large companies are establishing venture arms; institutional investors have funds focused on private investing; and both are actively searching for ways to invest sizable amounts of capital.
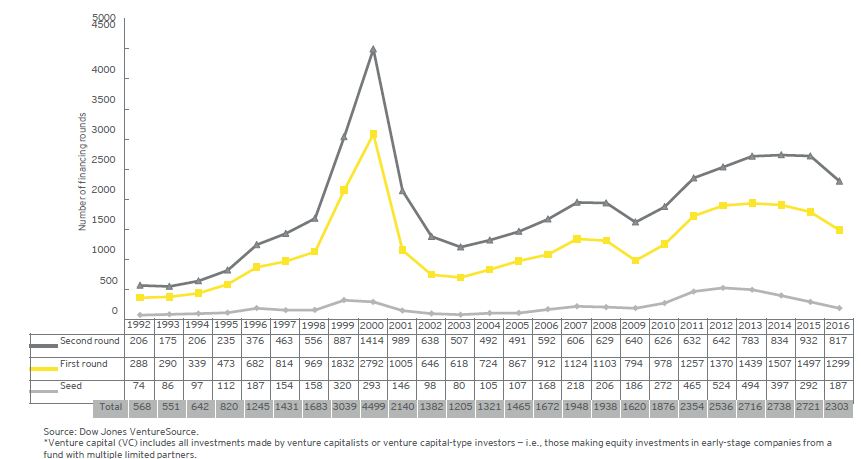
The trend toward private investment has been accelerating. (See figure 7.) Venture capital investment in private companies has exploded in recent years. In 2006, $31.2b of venture capital money funded 2,888 private US companies. In 2015, $77.3b went into 4,244 companies. However, we do expect the investment level to revert closer to historical norms as these markets ebb and flow.
Figure 7: There has been an upward trend in VC-backed* company formations
Other forms of private financing have grown just as quickly. The difference of just a few years can be dramatic. For example, Facebook raised $2.2b in private funding over seven years (2005 to 2011) ahead of its IPO. Over another seven-year period starting five years later (2010 to 2016), Uber raised more than five times as much capital in equity rounds—nearly $13b from venture capital and private equity firms, sovereign funds and corporations.
For many companies, debt financing has also been an attractive option as companies are able to borrow at or near all-time-low interest rates. Low-cost financing also enables strategic buyers to acquire private companies and smaller public companies. Finally, debt financing allows private companies to avoid diluting shares and adding new investors, thus keeping their shareholder count below the accredited investor limit of 2,000.
Some of the highest-value unicorn companies that are likely IPO candidates have sought additional financing through debt. While unicorns, start-ups with $1+ billion valuations, do not represent typical VC-backed companies, the top two unicorns as of January 2017 according to The Billion Dollar Startup Club (an interactive feature of The Wall Street Journal in conjunction with Dow Jones VentureSource) have taken on a significant amount of debt funding.
| Company | Last valuation | Last valuation date | Total equity funding | Total debt funding |
| Uber | $68.0b | 16-Jun | $12.9b | $3.15b |
| Airbnb | $31.0b | 17-Mar | $3.3b | $1.0b |
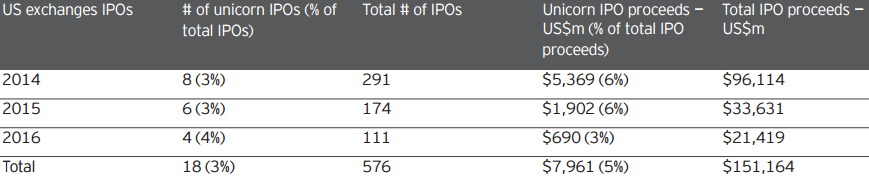
How much do unicorns matter?
While a significant amount of media attention is focused on so-called unicorn companies, it is important to remember that unicorns will represent only a small percentage of the population of private, high-growth companies looking to raise capital in the years ahead. The majority of companies that go public will not be unicorns.
Unicorn IPOs are a very small subset of the pool of start-up companies, representing just 3% of IPOs in the last three years since the term “unicorn” was coined in late 2013, and 5% of capital raised. Of the 18 unicorn IPOs, 4 were cross-border US listings of international companies, suggesting that US exchanges are the preferred venue for foreign unicorns to go public.
While being a unicorn brings the benefits of additional cachet, media attention and investor interest, their high valuations must be sustained by accelerating growth and financial performance along with the future liquidity provided from strong public equity markets.
Modern emerging companies are different from in past cycles
The typical profile of today’s emerging company is often a better fit with the private market than in previous economic cycles during which companies required heavy capital investments or had more predictable business models.
Some start-up technology companies today are able to build upon 20 years of innovation in technology and take advantage of low-cost cloud-based services rather than having to build their own networks and other infrastructure. Other start-ups are preferring to stay private until they have a more stable business model that will attract more IPO investors.
During a February 2017 meeting of the Securities and Exchange Commission (SEC) Advisory Committee on Small and Emerging Companies, it was observed that this generation of emerging companies and their founders prioritize control and flexibility over wealth creation in a way that encourages private sector financing. Under private owners, disruptive companies are able to take risks, sometimes in unregulated markets, outside of the public company spotlight. While public markets crave predictability, many of today’s new companies benefit from the ability to take risks without intense public scrutiny. Under private ownership, employees, founders and early investors are still able to sell shares via private share exchange programs to investors looking for a growth equity stake. Sometimes the company itself will repurchase shares to satisfy shareholder liquidity needs while remaining a privately held entity.
Companies with lower valuations or limited growth prospects have usually been more likely to explore an acquisition, especially if they have technologies or products that are valuable to large firms. However, these acquisitions are occurring in much greater numbers than in prior decades. In 2016, more than 4,800 private companies were acquired, compared with about 1,950 during the IPO peak in 1996. (See figure 8.) These trends have been fueled by a robust and sustained level of VC-backed company formations. (See figure 9.)
Figure 8: Acquisitions of US private companies remain robust
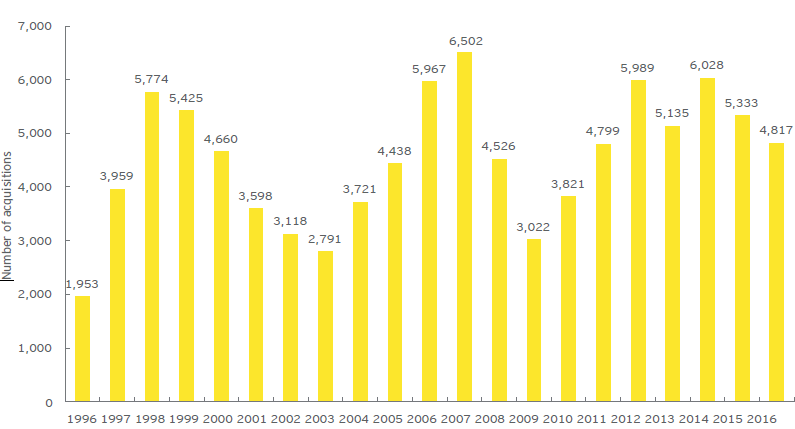
Source: Dealogic and EY analysis.
Figure 9: US VC-backed M&A activity remains strong. Valuations drive deal values up in recent years.
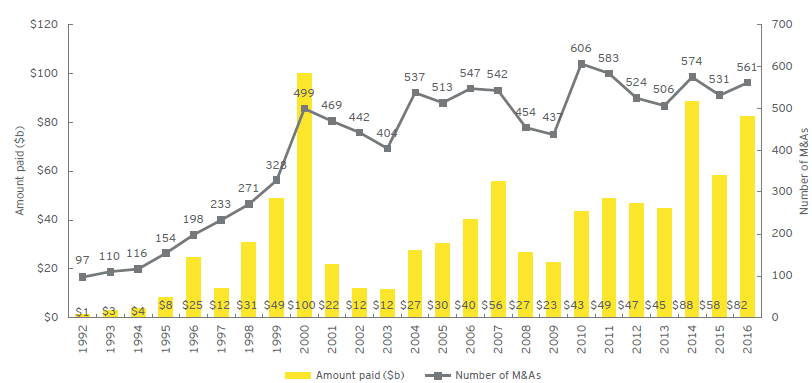
Source: Dow Jones VentureSource/EY.
Also, a large number of private companies with valuations in excess of $100m have been acquired in the past few years, illustrating the fact that it remains a viable option for larger companies if an IPO is out of reach. (See figure 10.)
Figure 10: Acquisitions of US private companies with values >$100m
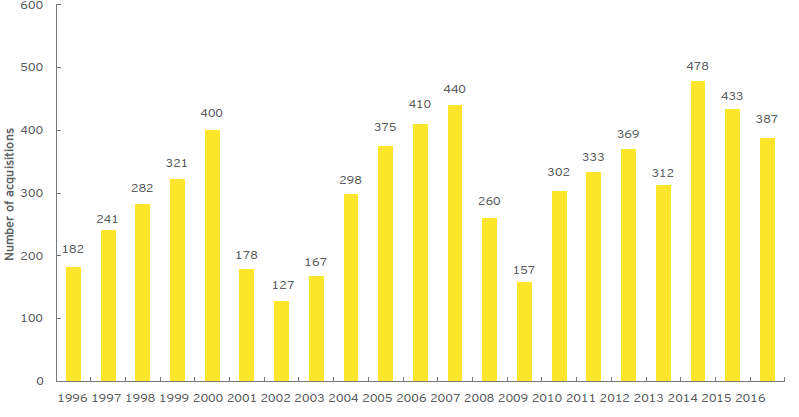
Source: Dealogic and EY analysis.
Congress takes action: legislation extends the IPO runway
Emerging companies searching for private financing have benefited from legislation passed in Congress in recent years that has allowed them to access private capital more easily. For example, the Jumpstart Our Business Startups (JOBS) Act of 2012, was intended to promote job creation and economic growth by improving access to the capital markets for emerging companies.
The JOBS Act increased the accredited investor limit for registering with the SEC from 500 to 2,000 and excluded employees receiving exempt equity awards from the investor count. Legislation passed in late 2015 created a safe harbor for secondary private placements that are not registered with the SEC. These changes allow private companies to remain private for longer, as long as their financing needs can be otherwise covered through private debt and private equity capital.
There is continued interest among policymakers to ease regulations on raising private capital. Already in 2017, the House and Senate have both taken up legislation to increase the cap on investors in a qualified venture capital fund from 100 to 250.
“[O]ur public capital markets are less attractive to business than in the past. As a result, investment opportunities for Main Street investors are more limited.”
Jay Clayton, during his confirmation hearing before the Senate Banking Committee to serve as chair of the Securities and Exchange Commission, 22 March 2017.
The Financial CHOICE Act of 2017, a comprehensive financial services regulatory reform bill authored by House Financial Services Committee Chairman Jeb Hensarling, includes identical language on venture funds. It also adds several other capital formation provisions, including streamlining the Regulation D offering process and authorizing the creation of “venture exchanges.”
Regulators are also looking at taking steps to spur investment. In a February 2017 speech, Acting SEC Chairman Michael Piwowar called for additional changes to the accredited investor threshold that would allow greater access by retail investors into the private markets, stating that, “In my view, there is a glaring need to move beyond the artificial distinction between ‘accredited’ and ‘non-accredited’ investors.”
During that same month, SEC Commissioner Kara Stein posed a question regarding additional disclosures and regulation around private market investment, noting, “We also need to understand why more companies are staying private for longer periods of time. Should we apply enhanced disclosure laws to these private companies? Or perhaps they require a unique set of rules.”
Crowdfunding is another recently sanctioned private-financing mechanism. Crowdfunding regulations adopted by the SEC in October 2015 allow start-ups and other private businesses to raise small amounts of equity capital (less than $1m annually) from potentially large pools of investors over the internet through an intermediary such as a broker-dealer or funding portal that must register with the SEC. This new platform yielded 163 offerings through the end of 2016.
In addition, a rule known as Regulation A+ (Reg A+) expanded companies’ ability to make unregistered public offerings to a maximum of $50m in any 12-month period. Through the end of 2016, there were 97 offerings under Reg A+, raising $239m so far, with a typical company seeking to raise $19m.
Additional costs to an IPO
An IPO is often the most important capital markets and wealth creation event in a corporate life cycle. Unmatched access to capital at a lower cost is a clear benefit in favor of an IPO, along with corporate branding opportunities and a host of other benefits. However, there are drawbacks to taking a company public that do not exist in the private market. Conducting an IPO results in less control by management and investors and increased accountability to public shareholders. In addition, the company will incur certain one-time costs and must plan for ongoing costs, including increased management and board compensation, advisory and legal fees, liability insurance and regulatory compliance costs. Management decisions and actions in public companies are more heavily scrutinized by investors, analysts and the media. Additionally, management may have different views on the best course for their business than the investment community. Disclosures required of public companies could mean transparency to competitors and the potential for shareholder activism.
Conclusion
In our view, US public capital markets are fundamentally healthy and remain the preferred choice for US and many foreign companies that seek to go public. The dynamics in the private capital market have changed significantly, at least temporarily, and allow companies to grow larger and stay private longer. The amount of private investment has grown immensely and takes many forms, including venture capital, private equity and debt financing. Companies that make it to a public offering in recent years have tended to be more mature and have solid business prospects, in contrast to the prior boom-bust cycles.
As policymakers respond to concerns about the decline in public company numbers, the implications to investors and companies could be significant and raise important questions:
- What should be the guiding objective of public policy regarding the public and private capital markets?
- Is the ultimate goal to generate capital formation in the US, regardless of whether it is in the public or private market?
- Is there a desire for more companies to go public sooner, if only to afford retail investors greater access to high-growth companies earlier in the corporate life cycle?
- Should regulations on private capital market investment be eased to afford more investors greater access, even though doing so would serve to further companies’ ability to grow bigger and stay private longer?
- Should private capital market activity be regulated differently if restrictions on investor participation are changed?
These are only some of the questions we believe warrant consideration as policymakers consider proposals that could have significant implications for investors, companies and the economy as a whole.
* * *
The complete publication, including footnotes, is available for download here.
